Introduction
This is a report for the insert benchmark with 480M docs and 24 client(s). It is generated by scripts (bash, awk, sed) and Tufte might not be impressed. An overview of the insert benchmark is here and a short update is here. Below, by DBMS, I mean DBMS+version.config. An example is my8020.c10b40 where my means MySQL, 8020 is version 8.0.20 and c10b40 is the name for the configuration file.
The test server has 80 cores with hyperthreads enabled, 256G RAM and fast storage. The benchmark was run with 24 clients and there were 1 or 3 connections per client (1 for queries or inserts without rate limits, 1+1 for rate limited inserts+deletes). There are 24 tables, with a client per table. It loads 480M rows without secondary indexes, creates secondary indexes, then inserts 960M rows with a delete per insert to avoid growing the table. It then does 3 read+write tests for 3600s each that do queries as fast as possible with 100, 500 and then 1000 inserts/second/client concurrent with the queries and 1000 deletes/second to avoid growing the table. The database is cached by InnoDB.
The tested DBMS are:
- my5740_rel_native_lto.cy10_u - InnoDB and MySQL 5.7.40, rel_native_lto build, cy10_u config, compiled with CMAKE_BUILD_TYPE=Release, base config
- my5740_rel_native_lto.cy10_ua1 - InnoDB and MySQL 5.7.40, rel_native_lto build, cy10_ua1 config, compiled with CMAKE_BUILD_TYPE=Release, adds innodb_use_native_aio=off
- my5740_rel_native_lto.cy10_ua2 - InnoDB and MySQL 5.7.40, rel_native_lto build, cy10_ua2 config, compiled with CMAKE_BUILD_TYPE=Release, adds innodb_io_capacity=20k, innodb_io_capacity_max=40k
- my5740_rel_native_lto.cy10_ua3 - InnoDB and MySQL 5.7.40, rel_native_lto build, cy10_ua3 config, compiled with CMAKE_BUILD_TYPE=Release, adds innodb_io_capacity=20k, innodb_io_capacity_max=40k, innodb_flush_sync=OFF
- my5740_rel_native_lto.cy10_ua4 - InnoDB and MySQL 5.7.40, rel_native_lto build, cy10_ua4 config, compiled with CMAKE_BUILD_TYPE=Release, adds innodb_flush_method=fsync
Contents
- Summary
- l.i0: load without secondary indexes
- l.x: create secondary indexes
- l.i1: continue load after secondary indexes created
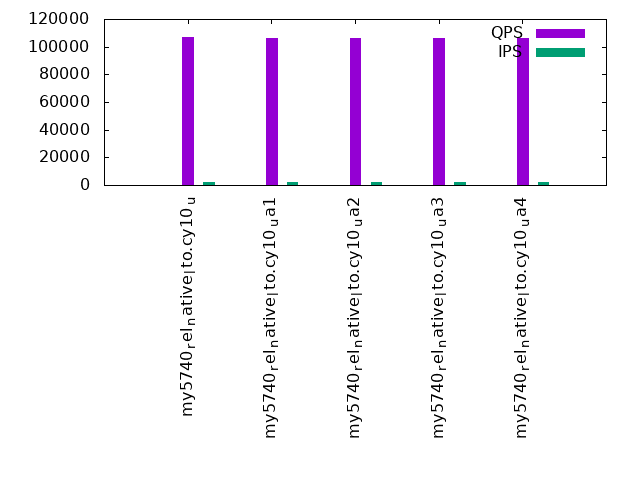
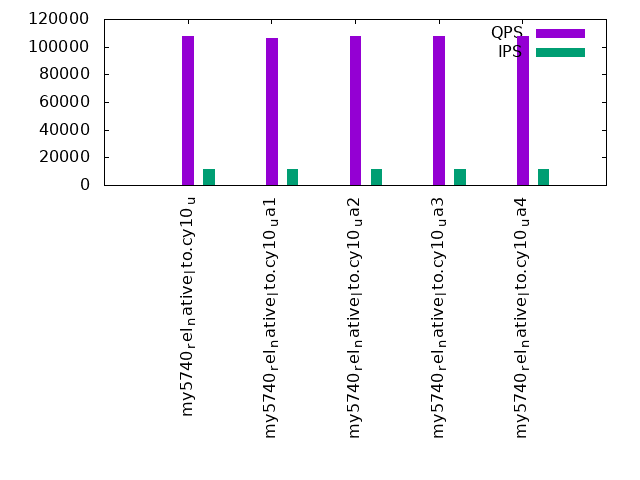
- q100.1: range queries with 100 insert/s per client
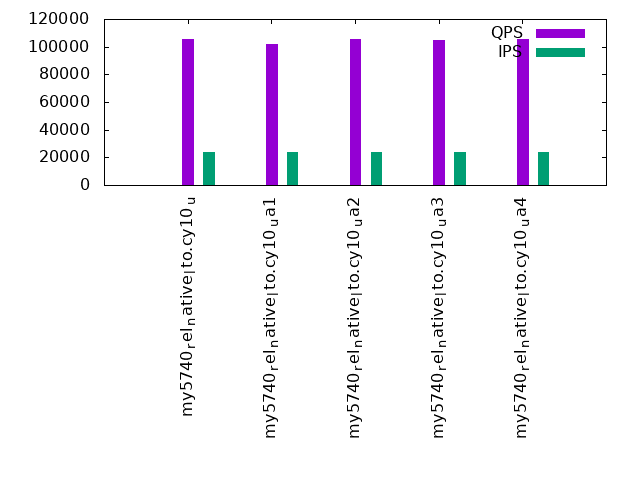
- q500.1: range queries with 500 insert/s per client
- q1000.1: range queries with 1000 insert/s per client
Summary
The numbers are inserts/s for l.i0 and l.i1, indexed docs (or rows) /s for l.x and queries/s for q*.2. The values are the average rate over the entire test for inserts (IPS) and queries (QPS). The range of values for IPS and QPS is split into 3 parts: bottom 25%, middle 50%, top 25%. Values in the bottom 25% have a red background, values in the top 25% have a green background and values in the middle have no color. A gray background is used for values that can be ignored because the DBMS did not sustain the target insert rate. Red backgrounds are not used when the minimum value is within 80% of the max value.
| dbms | l.i0 | l.x | l.i1 | q100.1 | q500.1 | q1000.1 |
|---|---|---|---|---|---|---|
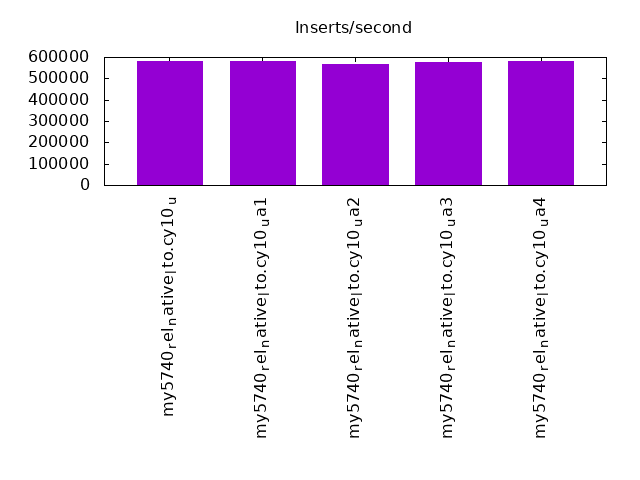
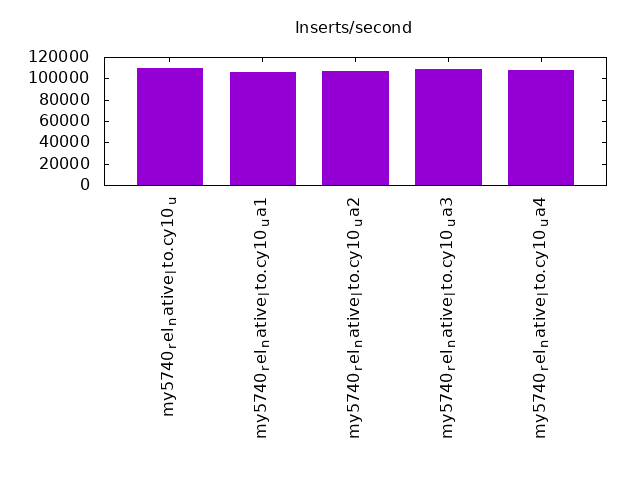
| my5740_rel_native_lto.cy10_u | 579710 | 1352394 | 109626 | 106796 | 107989 | 105594 |
| my5740_rel_native_lto.cy10_ua1 | 579710 | 1387572 | 105960 | 106196 | 105956 | 101978 |
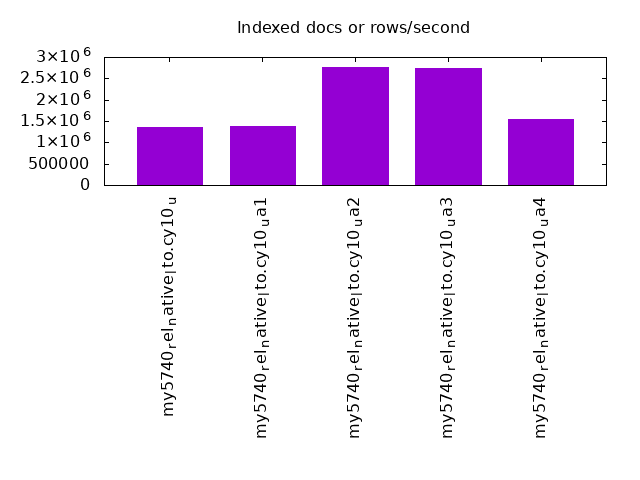
| my5740_rel_native_lto.cy10_ua2 | 569395 | 2775144 | 107191 | 106622 | 108008 | 105458 |
| my5740_rel_native_lto.cy10_ua3 | 576923 | 2743428 | 108806 | 106096 | 107502 | 104621 |
| my5740_rel_native_lto.cy10_ua4 | 579710 | 1548710 | 107635 | 106402 | 107835 | 105713 |
This table has relative throughput, throughput for the DBMS relative to the DBMS in the first line, using the absolute throughput from the previous table. Values less than 0.95 have a yellow background. Values greater than 1.05 have a blue background.
| dbms | l.i0 | l.x | l.i1 | q100.1 | q500.1 | q1000.1 |
|---|---|---|---|---|---|---|
| my5740_rel_native_lto.cy10_u | 1.00 | 1.00 | 1.00 | 1.00 | 1.00 | 1.00 |
| my5740_rel_native_lto.cy10_ua1 | 1.00 | 1.03 | 0.97 | 0.99 | 0.98 | 0.97 |
| my5740_rel_native_lto.cy10_ua2 | 0.98 | 2.05 | 0.98 | 1.00 | 1.00 | 1.00 |
| my5740_rel_native_lto.cy10_ua3 | 1.00 | 2.03 | 0.99 | 0.99 | 1.00 | 0.99 |
| my5740_rel_native_lto.cy10_ua4 | 1.00 | 1.15 | 0.98 | 1.00 | 1.00 | 1.00 |
This lists the average rate of inserts/s for the tests that do inserts concurrent with queries. For such tests the query rate is listed in the table above. The read+write tests are setup so that the insert rate should match the target rate every second. Cells that are not at least 95% of the target have a red background to indicate a failure to satisfy the target.
| dbms | q100.1 | q500.1 | q1000.1 |
|---|---|---|---|
| my5740_rel_native_lto.cy10_u | 2379 | 11904 | 23828 |
| my5740_rel_native_lto.cy10_ua1 | 2372 | 11904 | 23815 |
| my5740_rel_native_lto.cy10_ua2 | 2378 | 11904 | 23828 |
| my5740_rel_native_lto.cy10_ua3 | 2379 | 11904 | 23821 |
| my5740_rel_native_lto.cy10_ua4 | 2379 | 11904 | 23828 |
| target | 2400 | 12000 | 24000 |
l.i0
l.i0: load without secondary indexes. Graphs for performance per 1-second interval are here.
Average throughput:
Insert response time histogram: each cell has the percentage of responses that take <= the time in the header and max is the max response time in seconds. For the max column values in the top 25% of the range have a red background and in the bottom 25% of the range have a green background. The red background is not used when the min value is within 80% of the max value.
| dbms | 256us | 1ms | 4ms | 16ms | 64ms | 256ms | 1s | 4s | 16s | gt | max |
|---|---|---|---|---|---|---|---|---|---|---|---|
| my5740_rel_native_lto.cy10_u | 0.216 | 57.866 | 41.872 | 0.003 | 0.043 | 0.166 | |||||
| my5740_rel_native_lto.cy10_ua1 | 0.084 | 57.313 | 42.555 | 0.004 | 0.043 | 0.097 | |||||
| my5740_rel_native_lto.cy10_ua2 | 0.197 | 49.400 | 50.357 | 0.003 | 0.043 | 0.116 | |||||
| my5740_rel_native_lto.cy10_ua3 | 0.175 | 55.546 | 44.233 | 0.003 | 0.043 | 0.099 | |||||
| my5740_rel_native_lto.cy10_ua4 | 0.188 | 57.888 | 41.878 | 0.003 | 0.043 | 0.103 |
Performance metrics for the DBMS listed above. Some are normalized by throughput, others are not. Legend for results is here.
ips	qps	rps	rmbps	wps	wmbps	rpq	rkbpq	wpi	wkbpi	csps	cpups	cspq	cpupq	dbgb1	dbgb2	rss	maxop	p50	p99	tag
579710	0	0	0.0	2893.0	137.5	0.000	0.000	0.005	0.243	91633	40.5	0.158	56	31.8	160.3	47.5	0.166	24775	21881	480m.my5740_rel_native_lto.cy10_u
579710	0	0	0.0	2895.0	137.2	0.000	0.000	0.005	0.242	99366	40.6	0.171	56	31.8	160.3	47.5	0.097	24675	22278	480m.my5740_rel_native_lto.cy10_ua1
569395	0	0	0.0	3148.9	143.3	0.000	0.000	0.006	0.258	89359	40.1	0.157	56	31.8	160.3	47.5	0.116	24273	21678	480m.my5740_rel_native_lto.cy10_ua2
576923	0	0	0.0	3169.4	145.2	0.000	0.000	0.005	0.258	88637	40.2	0.154	56	31.8	160.3	47.5	0.099	24575	21980	480m.my5740_rel_native_lto.cy10_ua3
579710	0	0	0.0	1687.5	120.8	0.000	0.000	0.003	0.213	92438	40.4	0.159	56	31.8	160.3	47.5	0.103	24678	21978	480m.my5740_rel_native_lto.cy10_ua4
l.x
l.x: create secondary indexes.
Average throughput:
Performance metrics for the DBMS listed above. Some are normalized by throughput, others are not. Legend for results is here.
ips	qps	rps	rmbps	wps	wmbps	rpq	rkbpq	wpi	wkbpi	csps	cpups	cspq	cpupq	dbgb1	dbgb2	rss	maxop	p50	p99	tag
1352394	0	0	0.0	21715.0	1151.5	0.000	0.000	0.016	0.872	110742	30.9	0.082	18	70.8	199.3	81.6	0.002	NA	NA	480m.my5740_rel_native_lto.cy10_u
1387572	0	0	0.0	22291.0	1185.8	0.000	0.000	0.016	0.875	293499	31.2	0.212	18	70.8	199.3	81.6	0.003	NA	NA	480m.my5740_rel_native_lto.cy10_ua1
2775144	0	0	0.0	37559.2	2290.1	0.000	0.000	0.014	0.845	133024	27.6	0.048	8	70.8	199.3	81.6	0.002	NA	NA	480m.my5740_rel_native_lto.cy10_ua2
2743428	0	1	0.1	37199.4	2289.9	0.000	0.000	0.014	0.855	125902	29.4	0.046	9	70.8	199.3	81.6	0.002	NA	NA	480m.my5740_rel_native_lto.cy10_ua3
1548710	0	0	0.0	17539.8	1260.1	0.000	0.000	0.011	0.833	124594	31.0	0.080	16	70.8	199.3	81.6	0.002	NA	NA	480m.my5740_rel_native_lto.cy10_ua4
l.i1
l.i1: continue load after secondary indexes created. Graphs for performance per 1-second interval are here.
Average throughput:
Insert response time histogram: each cell has the percentage of responses that take <= the time in the header and max is the max response time in seconds. For the max column values in the top 25% of the range have a red background and in the bottom 25% of the range have a green background. The red background is not used when the min value is within 80% of the max value.
| dbms | 256us | 1ms | 4ms | 16ms | 64ms | 256ms | 1s | 4s | 16s | gt | max |
|---|---|---|---|---|---|---|---|---|---|---|---|
| my5740_rel_native_lto.cy10_u | 0.012 | 99.772 | 0.193 | 0.023 | nonzero | 0.663 | |||||
| my5740_rel_native_lto.cy10_ua1 | 0.021 | 99.509 | 0.300 | 0.170 | nonzero | 0.262 | |||||
| my5740_rel_native_lto.cy10_ua2 | 0.027 | 99.573 | 0.373 | 0.027 | nonzero | 0.266 | |||||
| my5740_rel_native_lto.cy10_ua3 | 0.013 | 99.604 | 0.349 | 0.033 | 0.131 | ||||||
| my5740_rel_native_lto.cy10_ua4 | 0.057 | 99.524 | 0.395 | 0.024 | 0.128 |
Delete response time histogram: each cell has the percentage of responses that take <= the time in the header and max is the max response time in seconds. For the max column values in the top 25% of the range have a red background and in the bottom 25% of the range have a green background. The red background is not used when the min value is within 80% of the max value.
| dbms | 256us | 1ms | 4ms | 16ms | 64ms | 256ms | 1s | 4s | 16s | gt | max |
|---|---|---|---|---|---|---|---|---|---|---|---|
| my5740_rel_native_lto.cy10_u | 0.034 | 99.843 | 0.100 | 0.022 | nonzero | 0.660 | |||||
| my5740_rel_native_lto.cy10_ua1 | 0.330 | 99.562 | 0.082 | 0.026 | 0.166 | ||||||
| my5740_rel_native_lto.cy10_ua2 | 0.052 | 99.701 | 0.220 | 0.027 | nonzero | 0.266 | |||||
| my5740_rel_native_lto.cy10_ua3 | 0.034 | 99.732 | 0.201 | 0.032 | 0.130 | ||||||
| my5740_rel_native_lto.cy10_ua4 | 0.046 | 99.745 | 0.175 | 0.034 | 0.126 |
Performance metrics for the DBMS listed above. Some are normalized by throughput, others are not. Legend for results is here.
ips	qps	rps	rmbps	wps	wmbps	rpq	rkbpq	wpi	wkbpi	csps	cpups	cspq	cpupq	dbgb1	dbgb2	rss	maxop	p50	p99	tag
109626	0	119	1.9	10923.2	342.8	0.001	0.017	0.100	3.202	114400	70.1	1.044	512	220.9	400.1	216.8	0.663	4595	4196	480m.my5740_rel_native_lto.cy10_u
105960	0	137	2.1	10682.9	335.0	0.001	0.021	0.101	3.237	312604	69.3	2.950	523	224.0	405.8	216.8	0.262	4496	599	480m.my5740_rel_native_lto.cy10_ua1
107191	0	114	1.8	13651.8	417.6	0.001	0.017	0.127	3.990	121036	70.1	1.129	523	220.7	399.7	216.8	0.266	4446	4046	480m.my5740_rel_native_lto.cy10_ua2
108806	0	120	1.9	13782.8	421.8	0.001	0.018	0.127	3.969	120881	70.0	1.111	515	221.0	400.3	216.8	0.131	4545	4096	480m.my5740_rel_native_lto.cy10_ua3
107635	0	24	1.4	10407.0	300.3	0.000	0.013	0.097	2.857	128043	69.5	1.190	517	220.9	400.1	216.8	0.128	4496	4113	480m.my5740_rel_native_lto.cy10_ua4
q100.1
q100.1: range queries with 100 insert/s per client. Graphs for performance per 1-second interval are here.
Average throughput:
Query response time histogram: each cell has the percentage of responses that take <= the time in the header and max is the max response time in seconds. For max values in the top 25% of the range have a red background and in the bottom 25% of the range have a green background. The red background is not used when the min value is within 80% of the max value.
| dbms | 256us | 1ms | 4ms | 16ms | 64ms | 256ms | 1s | 4s | 16s | gt | max |
|---|---|---|---|---|---|---|---|---|---|---|---|
| my5740_rel_native_lto.cy10_u | 84.942 | 15.055 | 0.003 | nonzero | nonzero | 0.023 | |||||
| my5740_rel_native_lto.cy10_ua1 | 84.025 | 15.972 | 0.002 | nonzero | 0.014 | ||||||
| my5740_rel_native_lto.cy10_ua2 | 84.724 | 15.273 | 0.003 | nonzero | nonzero | 0.025 | |||||
| my5740_rel_native_lto.cy10_ua3 | 84.243 | 15.754 | 0.003 | nonzero | nonzero | 0.032 | |||||
| my5740_rel_native_lto.cy10_ua4 | 84.578 | 15.392 | 0.030 | nonzero | nonzero | 0.050 |
Insert response time histogram: each cell has the percentage of responses that take <= the time in the header and max is the max response time in seconds. For max values in the top 25% of the range have a red background and in the bottom 25% of the range have a green background. The red background is not used when the min value is within 80% of the max value.
| dbms | 256us | 1ms | 4ms | 16ms | 64ms | 256ms | 1s | 4s | 16s | gt | max |
|---|---|---|---|---|---|---|---|---|---|---|---|
| my5740_rel_native_lto.cy10_u | 31.056 | 68.943 | 0.001 | 0.022 | |||||||
| my5740_rel_native_lto.cy10_ua1 | 39.173 | 60.826 | 0.001 | 0.016 | |||||||
| my5740_rel_native_lto.cy10_ua2 | 32.083 | 67.914 | 0.002 | 0.037 | |||||||
| my5740_rel_native_lto.cy10_ua3 | 29.350 | 70.648 | 0.002 | 0.041 | |||||||
| my5740_rel_native_lto.cy10_ua4 | 27.935 | 72.059 | 0.006 | 0.052 |
Delete response time histogram: each cell has the percentage of responses that take <= the time in the header and max is the max response time in seconds. For max values in the top 25% of the range have a red background and in the bottom 25% of the range have a green background. The red background is not used when the min value is within 80% of the max value.
| dbms | 256us | 1ms | 4ms | 16ms | 64ms | 256ms | 1s | 4s | 16s | gt | max |
|---|---|---|---|---|---|---|---|---|---|---|---|
| my5740_rel_native_lto.cy10_u | 78.004 | 21.996 | 0.015 | ||||||||
| my5740_rel_native_lto.cy10_ua1 | 91.534 | 8.466 | 0.011 | ||||||||
| my5740_rel_native_lto.cy10_ua2 | 79.220 | 20.779 | 0.001 | 0.037 | |||||||
| my5740_rel_native_lto.cy10_ua3 | 80.806 | 19.192 | 0.002 | 0.058 | |||||||
| my5740_rel_native_lto.cy10_ua4 | 80.845 | 19.152 | 0.002 | 0.052 |
Performance metrics for the DBMS listed above. Some are normalized by throughput, others are not. Legend for results is here.
ips	qps	rps	rmbps	wps	wmbps	rpq	rkbpq	wpi	wkbpi	csps	cpups	cspq	cpupq	dbgb1	dbgb2	rss	maxop	p50	p99	tag
2379	106796	967	15.1	7160.1	205.5	0.009	0.145	3.010	88.476	453290	41.7	4.244	312	220.9	400.1	216.9	0.023	4476	4188	480m.my5740_rel_native_lto.cy10_u
2372	106196	852	13.3	5386.8	153.5	0.008	0.128	2.271	66.242	861007	41.1	8.108	310	224.0	405.8	216.9	0.014	4460	4140	480m.my5740_rel_native_lto.cy10_ua1
2378	106622	966	15.1	8858.2	252.7	0.009	0.145	3.725	108.796	456625	41.7	4.283	313	220.7	399.7	216.9	0.025	4491	4220	480m.my5740_rel_native_lto.cy10_ua2
2379	106096	957	15.0	8853.0	252.5	0.009	0.144	3.722	108.690	454134	41.6	4.280	314	221.0	400.3	216.9	0.032	4460	4171	480m.my5740_rel_native_lto.cy10_ua3
2379	106402	161	9.5	7124.9	197.6	0.002	0.091	2.995	85.051	460415	41.9	4.327	315	220.9	400.1	216.9	0.050	4460	4156	480m.my5740_rel_native_lto.cy10_ua4
q500.1
q500.1: range queries with 500 insert/s per client. Graphs for performance per 1-second interval are here.
Average throughput:
Query response time histogram: each cell has the percentage of responses that take <= the time in the header and max is the max response time in seconds. For max values in the top 25% of the range have a red background and in the bottom 25% of the range have a green background. The red background is not used when the min value is within 80% of the max value.
| dbms | 256us | 1ms | 4ms | 16ms | 64ms | 256ms | 1s | 4s | 16s | gt | max |
|---|---|---|---|---|---|---|---|---|---|---|---|
| my5740_rel_native_lto.cy10_u | 86.685 | 13.306 | 0.008 | nonzero | nonzero | nonzero | 0.095 | ||||
| my5740_rel_native_lto.cy10_ua1 | 83.809 | 16.185 | 0.006 | nonzero | nonzero | 0.016 | |||||
| my5740_rel_native_lto.cy10_ua2 | 86.688 | 13.303 | 0.008 | nonzero | nonzero | 0.020 | |||||
| my5740_rel_native_lto.cy10_ua3 | 86.276 | 13.716 | 0.008 | nonzero | nonzero | 0.035 | |||||
| my5740_rel_native_lto.cy10_ua4 | 86.562 | 13.422 | 0.016 | 0.001 | nonzero | 0.054 |
Insert response time histogram: each cell has the percentage of responses that take <= the time in the header and max is the max response time in seconds. For max values in the top 25% of the range have a red background and in the bottom 25% of the range have a green background. The red background is not used when the min value is within 80% of the max value.
| dbms | 256us | 1ms | 4ms | 16ms | 64ms | 256ms | 1s | 4s | 16s | gt | max |
|---|---|---|---|---|---|---|---|---|---|---|---|
| my5740_rel_native_lto.cy10_u | 6.337 | 93.658 | 0.005 | nonzero | 0.093 | ||||||
| my5740_rel_native_lto.cy10_ua1 | 22.444 | 77.552 | 0.005 | 0.027 | |||||||
| my5740_rel_native_lto.cy10_ua2 | 9.605 | 90.390 | 0.005 | 0.025 | |||||||
| my5740_rel_native_lto.cy10_ua3 | 12.125 | 87.874 | 0.001 | 0.039 | |||||||
| my5740_rel_native_lto.cy10_ua4 | 21.165 | 78.826 | 0.009 | 0.040 |
Delete response time histogram: each cell has the percentage of responses that take <= the time in the header and max is the max response time in seconds. For max values in the top 25% of the range have a red background and in the bottom 25% of the range have a green background. The red background is not used when the min value is within 80% of the max value.
| dbms | 256us | 1ms | 4ms | 16ms | 64ms | 256ms | 1s | 4s | 16s | gt | max |
|---|---|---|---|---|---|---|---|---|---|---|---|
| my5740_rel_native_lto.cy10_u | 14.686 | 85.310 | 0.004 | 0.045 | |||||||
| my5740_rel_native_lto.cy10_ua1 | 82.521 | 17.477 | 0.002 | 0.019 | |||||||
| my5740_rel_native_lto.cy10_ua2 | 19.606 | 80.390 | 0.003 | 0.022 | |||||||
| my5740_rel_native_lto.cy10_ua3 | 28.462 | 71.537 | 0.001 | nonzero | 0.082 | ||||||
| my5740_rel_native_lto.cy10_ua4 | 35.909 | 64.088 | 0.002 | 0.033 |
Performance metrics for the DBMS listed above. Some are normalized by throughput, others are not. Legend for results is here.
ips	qps	rps	rmbps	wps	wmbps	rpq	rkbpq	wpi	wkbpi	csps	cpups	cspq	cpupq	dbgb1	dbgb2	rss	maxop	p50	p99	tag
11904	107989	489	7.6	5682.5	164.5	0.005	0.072	0.477	14.148	456755	43.7	4.230	324	220.9	400.1	216.9	0.095	4523	4220	480m.my5740_rel_native_lto.cy10_u
11904	105956	299	4.7	6208.6	179.1	0.003	0.045	0.522	15.408	929241	43.0	8.770	325	224.0	405.8	216.9	0.016	4444	4108	480m.my5740_rel_native_lto.cy10_ua1
11904	108008	493	7.7	6851.8	196.9	0.005	0.073	0.576	16.936	459408	43.7	4.253	324	220.7	399.7	216.9	0.020	4539	4220	480m.my5740_rel_native_lto.cy10_ua2
11904	107502	483	7.5	6905.0	198.4	0.004	0.072	0.580	17.066	457327	43.5	4.254	324	221.0	400.3	216.9	0.035	4509	4220	480m.my5740_rel_native_lto.cy10_ua3
11904	107835	136	6.5	5662.4	160.2	0.001	0.062	0.476	13.777	462694	44.0	4.291	326	220.9	400.1	216.9	0.054	4540	4236	480m.my5740_rel_native_lto.cy10_ua4
q1000.1
q1000.1: range queries with 1000 insert/s per client. Graphs for performance per 1-second interval are here.
Average throughput:
Query response time histogram: each cell has the percentage of responses that take <= the time in the header and max is the max response time in seconds. For max values in the top 25% of the range have a red background and in the bottom 25% of the range have a green background. The red background is not used when the min value is within 80% of the max value.
| dbms | 256us | 1ms | 4ms | 16ms | 64ms | 256ms | 1s | 4s | 16s | gt | max |
|---|---|---|---|---|---|---|---|---|---|---|---|
| my5740_rel_native_lto.cy10_u | 82.592 | 17.313 | 0.073 | 0.021 | nonzero | 0.036 | |||||
| my5740_rel_native_lto.cy10_ua1 | 78.515 | 21.421 | 0.054 | 0.010 | nonzero | 0.027 | |||||
| my5740_rel_native_lto.cy10_ua2 | 82.447 | 17.463 | 0.070 | 0.021 | nonzero | 0.031 | |||||
| my5740_rel_native_lto.cy10_ua3 | 81.940 | 17.966 | 0.072 | 0.021 | nonzero | nonzero | 0.065 | ||||
| my5740_rel_native_lto.cy10_ua4 | 82.837 | 17.065 | 0.076 | 0.022 | nonzero | 0.052 |
Insert response time histogram: each cell has the percentage of responses that take <= the time in the header and max is the max response time in seconds. For max values in the top 25% of the range have a red background and in the bottom 25% of the range have a green background. The red background is not used when the min value is within 80% of the max value.
| dbms | 256us | 1ms | 4ms | 16ms | 64ms | 256ms | 1s | 4s | 16s | gt | max |
|---|---|---|---|---|---|---|---|---|---|---|---|
| my5740_rel_native_lto.cy10_u | 2.776 | 93.934 | 3.290 | 0.058 | |||||||
| my5740_rel_native_lto.cy10_ua1 | 12.481 | 87.004 | 0.515 | 0.050 | |||||||
| my5740_rel_native_lto.cy10_ua2 | 2.172 | 94.511 | 3.317 | 0.054 | |||||||
| my5740_rel_native_lto.cy10_ua3 | 2.087 | 94.527 | 3.386 | 0.055 | |||||||
| my5740_rel_native_lto.cy10_ua4 | 2.231 | 93.925 | 3.844 | 0.057 |
Delete response time histogram: each cell has the percentage of responses that take <= the time in the header and max is the max response time in seconds. For max values in the top 25% of the range have a red background and in the bottom 25% of the range have a green background. The red background is not used when the min value is within 80% of the max value.
| dbms | 256us | 1ms | 4ms | 16ms | 64ms | 256ms | 1s | 4s | 16s | gt | max |
|---|---|---|---|---|---|---|---|---|---|---|---|
| my5740_rel_native_lto.cy10_u | 2.837 | 94.731 | 2.432 | 0.048 | |||||||
| my5740_rel_native_lto.cy10_ua1 | 14.530 | 85.121 | 0.348 | 0.050 | |||||||
| my5740_rel_native_lto.cy10_ua2 | 2.120 | 95.419 | 2.460 | 0.049 | |||||||
| my5740_rel_native_lto.cy10_ua3 | 2.083 | 95.369 | 2.548 | 0.057 | |||||||
| my5740_rel_native_lto.cy10_ua4 | 1.951 | 95.964 | 2.085 | 0.052 |
Performance metrics for the DBMS listed above. Some are normalized by throughput, others are not. Legend for results is here.
ips	qps	rps	rmbps	wps	wmbps	rpq	rkbpq	wpi	wkbpi	csps	cpups	cspq	cpupq	dbgb1	dbgb2	rss	maxop	p50	p99	tag
23828	105594	255	4.0	4920.9	143.9	0.002	0.039	0.207	6.185	434485	49.1	4.115	372	220.9	400.1	216.9	0.036	4412	4060	480m.my5740_rel_native_lto.cy10_u
23815	101978	394	6.2	4915.1	142.0	0.004	0.062	0.206	6.106	795493	49.5	7.801	388	224.0	405.8	216.9	0.027	4284	3964	480m.my5740_rel_native_lto.cy10_ua1
23828	105458	248	3.9	5631.7	163.7	0.002	0.038	0.236	7.036	434903	49.2	4.124	373	220.7	399.7	216.9	0.031	4412	4076	480m.my5740_rel_native_lto.cy10_ua2
23821	104621	272	4.3	5775.2	167.9	0.003	0.042	0.242	7.219	433561	49.5	4.144	379	221.0	400.3	216.9	0.065	4379	4044	480m.my5740_rel_native_lto.cy10_ua3
23828	105713	189	4.7	4830.1	138.8	0.002	0.045	0.203	5.964	441534	49.0	4.177	371	220.9	400.1	216.9	0.052	4427	4060	480m.my5740_rel_native_lto.cy10_ua4
l.i0
l.i0: load without secondary indexes
Performance metrics for all DBMS, not just the ones listed above. Some are normalized by throughput, others are not. Legend for results is here.
ips	qps	rps	rmbps	wps	wmbps	rpq	rkbpq	wpi	wkbpi	csps	cpups	cspq	cpupq	dbgb1	dbgb2	rss	maxop	p50	p99	tag
579710	0	0	0.0	2893.0	137.5	0.000	0.000	0.005	0.243	91633	40.5	0.158	56	31.8	160.3	47.5	0.166	24775	21881	480m.my5740_rel_native_lto.cy10_u
579710	0	0	0.0	2895.0	137.2	0.000	0.000	0.005	0.242	99366	40.6	0.171	56	31.8	160.3	47.5	0.097	24675	22278	480m.my5740_rel_native_lto.cy10_ua1
569395	0	0	0.0	3148.9	143.3	0.000	0.000	0.006	0.258	89359	40.1	0.157	56	31.8	160.3	47.5	0.116	24273	21678	480m.my5740_rel_native_lto.cy10_ua2
576923	0	0	0.0	3169.4	145.2	0.000	0.000	0.005	0.258	88637	40.2	0.154	56	31.8	160.3	47.5	0.099	24575	21980	480m.my5740_rel_native_lto.cy10_ua3
579710	0	0	0.0	1687.5	120.8	0.000	0.000	0.003	0.213	92438	40.4	0.159	56	31.8	160.3	47.5	0.103	24678	21978	480m.my5740_rel_native_lto.cy10_ua4
l.x
l.x: create secondary indexes
Performance metrics for all DBMS, not just the ones listed above. Some are normalized by throughput, others are not. Legend for results is here.
ips	qps	rps	rmbps	wps	wmbps	rpq	rkbpq	wpi	wkbpi	csps	cpups	cspq	cpupq	dbgb1	dbgb2	rss	maxop	p50	p99	tag
1352394	0	0	0.0	21715.0	1151.5	0.000	0.000	0.016	0.872	110742	30.9	0.082	18	70.8	199.3	81.6	0.002	NA	NA	480m.my5740_rel_native_lto.cy10_u
1387572	0	0	0.0	22291.0	1185.8	0.000	0.000	0.016	0.875	293499	31.2	0.212	18	70.8	199.3	81.6	0.003	NA	NA	480m.my5740_rel_native_lto.cy10_ua1
2775144	0	0	0.0	37559.2	2290.1	0.000	0.000	0.014	0.845	133024	27.6	0.048	8	70.8	199.3	81.6	0.002	NA	NA	480m.my5740_rel_native_lto.cy10_ua2
2743428	0	1	0.1	37199.4	2289.9	0.000	0.000	0.014	0.855	125902	29.4	0.046	9	70.8	199.3	81.6	0.002	NA	NA	480m.my5740_rel_native_lto.cy10_ua3
1548710	0	0	0.0	17539.8	1260.1	0.000	0.000	0.011	0.833	124594	31.0	0.080	16	70.8	199.3	81.6	0.002	NA	NA	480m.my5740_rel_native_lto.cy10_ua4
l.i1
l.i1: continue load after secondary indexes created
Performance metrics for all DBMS, not just the ones listed above. Some are normalized by throughput, others are not. Legend for results is here.
ips	qps	rps	rmbps	wps	wmbps	rpq	rkbpq	wpi	wkbpi	csps	cpups	cspq	cpupq	dbgb1	dbgb2	rss	maxop	p50	p99	tag
109626	0	119	1.9	10923.2	342.8	0.001	0.017	0.100	3.202	114400	70.1	1.044	512	220.9	400.1	216.8	0.663	4595	4196	480m.my5740_rel_native_lto.cy10_u
105960	0	137	2.1	10682.9	335.0	0.001	0.021	0.101	3.237	312604	69.3	2.950	523	224.0	405.8	216.8	0.262	4496	599	480m.my5740_rel_native_lto.cy10_ua1
107191	0	114	1.8	13651.8	417.6	0.001	0.017	0.127	3.990	121036	70.1	1.129	523	220.7	399.7	216.8	0.266	4446	4046	480m.my5740_rel_native_lto.cy10_ua2
108806	0	120	1.9	13782.8	421.8	0.001	0.018	0.127	3.969	120881	70.0	1.111	515	221.0	400.3	216.8	0.131	4545	4096	480m.my5740_rel_native_lto.cy10_ua3
107635	0	24	1.4	10407.0	300.3	0.000	0.013	0.097	2.857	128043	69.5	1.190	517	220.9	400.1	216.8	0.128	4496	4113	480m.my5740_rel_native_lto.cy10_ua4
q100.1
q100.1: range queries with 100 insert/s per client
Performance metrics for all DBMS, not just the ones listed above. Some are normalized by throughput, others are not. Legend for results is here.
ips	qps	rps	rmbps	wps	wmbps	rpq	rkbpq	wpi	wkbpi	csps	cpups	cspq	cpupq	dbgb1	dbgb2	rss	maxop	p50	p99	tag
2379	106796	967	15.1	7160.1	205.5	0.009	0.145	3.010	88.476	453290	41.7	4.244	312	220.9	400.1	216.9	0.023	4476	4188	480m.my5740_rel_native_lto.cy10_u
2372	106196	852	13.3	5386.8	153.5	0.008	0.128	2.271	66.242	861007	41.1	8.108	310	224.0	405.8	216.9	0.014	4460	4140	480m.my5740_rel_native_lto.cy10_ua1
2378	106622	966	15.1	8858.2	252.7	0.009	0.145	3.725	108.796	456625	41.7	4.283	313	220.7	399.7	216.9	0.025	4491	4220	480m.my5740_rel_native_lto.cy10_ua2
2379	106096	957	15.0	8853.0	252.5	0.009	0.144	3.722	108.690	454134	41.6	4.280	314	221.0	400.3	216.9	0.032	4460	4171	480m.my5740_rel_native_lto.cy10_ua3
2379	106402	161	9.5	7124.9	197.6	0.002	0.091	2.995	85.051	460415	41.9	4.327	315	220.9	400.1	216.9	0.050	4460	4156	480m.my5740_rel_native_lto.cy10_ua4
q500.1
q500.1: range queries with 500 insert/s per client
Performance metrics for all DBMS, not just the ones listed above. Some are normalized by throughput, others are not. Legend for results is here.
ips	qps	rps	rmbps	wps	wmbps	rpq	rkbpq	wpi	wkbpi	csps	cpups	cspq	cpupq	dbgb1	dbgb2	rss	maxop	p50	p99	tag
11904	107989	489	7.6	5682.5	164.5	0.005	0.072	0.477	14.148	456755	43.7	4.230	324	220.9	400.1	216.9	0.095	4523	4220	480m.my5740_rel_native_lto.cy10_u
11904	105956	299	4.7	6208.6	179.1	0.003	0.045	0.522	15.408	929241	43.0	8.770	325	224.0	405.8	216.9	0.016	4444	4108	480m.my5740_rel_native_lto.cy10_ua1
11904	108008	493	7.7	6851.8	196.9	0.005	0.073	0.576	16.936	459408	43.7	4.253	324	220.7	399.7	216.9	0.020	4539	4220	480m.my5740_rel_native_lto.cy10_ua2
11904	107502	483	7.5	6905.0	198.4	0.004	0.072	0.580	17.066	457327	43.5	4.254	324	221.0	400.3	216.9	0.035	4509	4220	480m.my5740_rel_native_lto.cy10_ua3
11904	107835	136	6.5	5662.4	160.2	0.001	0.062	0.476	13.777	462694	44.0	4.291	326	220.9	400.1	216.9	0.054	4540	4236	480m.my5740_rel_native_lto.cy10_ua4
q1000.1
q1000.1: range queries with 1000 insert/s per client
Performance metrics for all DBMS, not just the ones listed above. Some are normalized by throughput, others are not. Legend for results is here.
ips	qps	rps	rmbps	wps	wmbps	rpq	rkbpq	wpi	wkbpi	csps	cpups	cspq	cpupq	dbgb1	dbgb2	rss	maxop	p50	p99	tag
23828	105594	255	4.0	4920.9	143.9	0.002	0.039	0.207	6.185	434485	49.1	4.115	372	220.9	400.1	216.9	0.036	4412	4060	480m.my5740_rel_native_lto.cy10_u
23815	101978	394	6.2	4915.1	142.0	0.004	0.062	0.206	6.106	795493	49.5	7.801	388	224.0	405.8	216.9	0.027	4284	3964	480m.my5740_rel_native_lto.cy10_ua1
23828	105458	248	3.9	5631.7	163.7	0.002	0.038	0.236	7.036	434903	49.2	4.124	373	220.7	399.7	216.9	0.031	4412	4076	480m.my5740_rel_native_lto.cy10_ua2
23821	104621	272	4.3	5775.2	167.9	0.003	0.042	0.242	7.219	433561	49.5	4.144	379	221.0	400.3	216.9	0.065	4379	4044	480m.my5740_rel_native_lto.cy10_ua3
23828	105713	189	4.7	4830.1	138.8	0.002	0.045	0.203	5.964	441534	49.0	4.177	371	220.9	400.1	216.9	0.052	4427	4060	480m.my5740_rel_native_lto.cy10_ua4
l.i0
- l.i0: load without secondary indexes
- Legend for results is here.
- Each entry lists the percentage of responses that fit in that bucket (slower than max time for previous bucket, faster than min time for next bucket).
Insert response time histogram
256us	1ms	4ms	16ms	64ms	256ms	1s	4s	16s	gt	max	tag
0.000	0.216	57.866	41.872	0.003	0.043	0.000	0.000	0.000	0.000	0.166	my5740_rel_native_lto.cy10_u
0.000	0.084	57.313	42.555	0.004	0.043	0.000	0.000	0.000	0.000	0.097	my5740_rel_native_lto.cy10_ua1
0.000	0.197	49.400	50.357	0.003	0.043	0.000	0.000	0.000	0.000	0.116	my5740_rel_native_lto.cy10_ua2
0.000	0.175	55.546	44.233	0.003	0.043	0.000	0.000	0.000	0.000	0.099	my5740_rel_native_lto.cy10_ua3
0.000	0.188	57.888	41.878	0.003	0.043	0.000	0.000	0.000	0.000	0.103	my5740_rel_native_lto.cy10_ua4
l.x
- l.x: create secondary indexes
- Legend for results is here.
- Each entry lists the percentage of responses that fit in that bucket (slower than max time for previous bucket, faster than min time for next bucket).
TODO - determine whether there is data for create index response time
l.i1
- l.i1: continue load after secondary indexes created
- Legend for results is here.
- Each entry lists the percentage of responses that fit in that bucket (slower than max time for previous bucket, faster than min time for next bucket).
Insert response time histogram
256us	1ms	4ms	16ms	64ms	256ms	1s	4s	16s	gt	max	tag
0.000	0.000	0.012	99.772	0.193	0.023	nonzero	0.000	0.000	0.000	0.663	my5740_rel_native_lto.cy10_u
0.000	0.000	0.021	99.509	0.300	0.170	nonzero	0.000	0.000	0.000	0.262	my5740_rel_native_lto.cy10_ua1
0.000	0.000	0.027	99.573	0.373	0.027	nonzero	0.000	0.000	0.000	0.266	my5740_rel_native_lto.cy10_ua2
0.000	0.000	0.013	99.604	0.349	0.033	0.000	0.000	0.000	0.000	0.131	my5740_rel_native_lto.cy10_ua3
0.000	0.000	0.057	99.524	0.395	0.024	0.000	0.000	0.000	0.000	0.128	my5740_rel_native_lto.cy10_ua4
Delete response time histogram
256us	1ms	4ms	16ms	64ms	256ms	1s	4s	16s	gt	max	tag
0.000	0.000	0.034	99.843	0.100	0.022	nonzero	0.000	0.000	0.000	0.660	my5740_rel_native_lto.cy10_u
0.000	0.000	0.330	99.562	0.082	0.026	0.000	0.000	0.000	0.000	0.166	my5740_rel_native_lto.cy10_ua1
0.000	0.000	0.052	99.701	0.220	0.027	nonzero	0.000	0.000	0.000	0.266	my5740_rel_native_lto.cy10_ua2
0.000	0.000	0.034	99.732	0.201	0.032	0.000	0.000	0.000	0.000	0.130	my5740_rel_native_lto.cy10_ua3
0.000	0.000	0.046	99.745	0.175	0.034	0.000	0.000	0.000	0.000	0.126	my5740_rel_native_lto.cy10_ua4
q100.1
- q100.1: range queries with 100 insert/s per client
- Legend for results is here.
- Each entry lists the percentage of responses that fit in that bucket (slower than max time for previous bucket, faster than min time for next bucket).
Query response time histogram
256us	1ms	4ms	16ms	64ms	256ms	1s	4s	16s	gt	max	tag
84.942	15.055	0.003	nonzero	nonzero	0.000	0.000	0.000	0.000	0.000	0.023	my5740_rel_native_lto.cy10_u
84.025	15.972	0.002	nonzero	0.000	0.000	0.000	0.000	0.000	0.000	0.014	my5740_rel_native_lto.cy10_ua1
84.724	15.273	0.003	nonzero	nonzero	0.000	0.000	0.000	0.000	0.000	0.025	my5740_rel_native_lto.cy10_ua2
84.243	15.754	0.003	nonzero	nonzero	0.000	0.000	0.000	0.000	0.000	0.032	my5740_rel_native_lto.cy10_ua3
84.578	15.392	0.030	nonzero	nonzero	0.000	0.000	0.000	0.000	0.000	0.050	my5740_rel_native_lto.cy10_ua4
Insert response time histogram
256us	1ms	4ms	16ms	64ms	256ms	1s	4s	16s	gt	max	tag
0.000	0.000	31.056	68.943	0.001	0.000	0.000	0.000	0.000	0.000	0.022	my5740_rel_native_lto.cy10_u
0.000	0.000	39.173	60.826	0.001	0.000	0.000	0.000	0.000	0.000	0.016	my5740_rel_native_lto.cy10_ua1
0.000	0.000	32.083	67.914	0.002	0.000	0.000	0.000	0.000	0.000	0.037	my5740_rel_native_lto.cy10_ua2
0.000	0.000	29.350	70.648	0.002	0.000	0.000	0.000	0.000	0.000	0.041	my5740_rel_native_lto.cy10_ua3
0.000	0.000	27.935	72.059	0.006	0.000	0.000	0.000	0.000	0.000	0.052	my5740_rel_native_lto.cy10_ua4
Delete response time histogram
256us	1ms	4ms	16ms	64ms	256ms	1s	4s	16s	gt	max	tag
0.000	0.000	78.004	21.996	0.000	0.000	0.000	0.000	0.000	0.000	0.015	my5740_rel_native_lto.cy10_u
0.000	0.000	91.534	8.466	0.000	0.000	0.000	0.000	0.000	0.000	0.011	my5740_rel_native_lto.cy10_ua1
0.000	0.000	79.220	20.779	0.001	0.000	0.000	0.000	0.000	0.000	0.037	my5740_rel_native_lto.cy10_ua2
0.000	0.000	80.806	19.192	0.002	0.000	0.000	0.000	0.000	0.000	0.058	my5740_rel_native_lto.cy10_ua3
0.000	0.000	80.845	19.152	0.002	0.000	0.000	0.000	0.000	0.000	0.052	my5740_rel_native_lto.cy10_ua4
q500.1
- q500.1: range queries with 500 insert/s per client
- Legend for results is here.
- Each entry lists the percentage of responses that fit in that bucket (slower than max time for previous bucket, faster than min time for next bucket).
Query response time histogram
256us	1ms	4ms	16ms	64ms	256ms	1s	4s	16s	gt	max	tag
86.685	13.306	0.008	nonzero	nonzero	nonzero	0.000	0.000	0.000	0.000	0.095	my5740_rel_native_lto.cy10_u
83.809	16.185	0.006	nonzero	nonzero	0.000	0.000	0.000	0.000	0.000	0.016	my5740_rel_native_lto.cy10_ua1
86.688	13.303	0.008	nonzero	nonzero	0.000	0.000	0.000	0.000	0.000	0.020	my5740_rel_native_lto.cy10_ua2
86.276	13.716	0.008	nonzero	nonzero	0.000	0.000	0.000	0.000	0.000	0.035	my5740_rel_native_lto.cy10_ua3
86.562	13.422	0.016	0.001	nonzero	0.000	0.000	0.000	0.000	0.000	0.054	my5740_rel_native_lto.cy10_ua4
Insert response time histogram
256us	1ms	4ms	16ms	64ms	256ms	1s	4s	16s	gt	max	tag
0.000	0.000	6.337	93.658	0.005	nonzero	0.000	0.000	0.000	0.000	0.093	my5740_rel_native_lto.cy10_u
0.000	0.000	22.444	77.552	0.005	0.000	0.000	0.000	0.000	0.000	0.027	my5740_rel_native_lto.cy10_ua1
0.000	0.000	9.605	90.390	0.005	0.000	0.000	0.000	0.000	0.000	0.025	my5740_rel_native_lto.cy10_ua2
0.000	0.000	12.125	87.874	0.001	0.000	0.000	0.000	0.000	0.000	0.039	my5740_rel_native_lto.cy10_ua3
0.000	0.000	21.165	78.826	0.009	0.000	0.000	0.000	0.000	0.000	0.040	my5740_rel_native_lto.cy10_ua4
Delete response time histogram
256us	1ms	4ms	16ms	64ms	256ms	1s	4s	16s	gt	max	tag
0.000	0.000	14.686	85.310	0.004	0.000	0.000	0.000	0.000	0.000	0.045	my5740_rel_native_lto.cy10_u
0.000	0.000	82.521	17.477	0.002	0.000	0.000	0.000	0.000	0.000	0.019	my5740_rel_native_lto.cy10_ua1
0.000	0.000	19.606	80.390	0.003	0.000	0.000	0.000	0.000	0.000	0.022	my5740_rel_native_lto.cy10_ua2
0.000	0.000	28.462	71.537	0.001	nonzero	0.000	0.000	0.000	0.000	0.082	my5740_rel_native_lto.cy10_ua3
0.000	0.000	35.909	64.088	0.002	0.000	0.000	0.000	0.000	0.000	0.033	my5740_rel_native_lto.cy10_ua4
q1000.1
- q1000.1: range queries with 1000 insert/s per client
- Legend for results is here.
- Each entry lists the percentage of responses that fit in that bucket (slower than max time for previous bucket, faster than min time for next bucket).
Query response time histogram
256us	1ms	4ms	16ms	64ms	256ms	1s	4s	16s	gt	max	tag
82.592	17.313	0.073	0.021	nonzero	0.000	0.000	0.000	0.000	0.000	0.036	my5740_rel_native_lto.cy10_u
78.515	21.421	0.054	0.010	nonzero	0.000	0.000	0.000	0.000	0.000	0.027	my5740_rel_native_lto.cy10_ua1
82.447	17.463	0.070	0.021	nonzero	0.000	0.000	0.000	0.000	0.000	0.031	my5740_rel_native_lto.cy10_ua2
81.940	17.966	0.072	0.021	nonzero	nonzero	0.000	0.000	0.000	0.000	0.065	my5740_rel_native_lto.cy10_ua3
82.837	17.065	0.076	0.022	nonzero	0.000	0.000	0.000	0.000	0.000	0.052	my5740_rel_native_lto.cy10_ua4
Insert response time histogram
256us	1ms	4ms	16ms	64ms	256ms	1s	4s	16s	gt	max	tag
0.000	0.000	2.776	93.934	3.290	0.000	0.000	0.000	0.000	0.000	0.058	my5740_rel_native_lto.cy10_u
0.000	0.000	12.481	87.004	0.515	0.000	0.000	0.000	0.000	0.000	0.050	my5740_rel_native_lto.cy10_ua1
0.000	0.000	2.172	94.511	3.317	0.000	0.000	0.000	0.000	0.000	0.054	my5740_rel_native_lto.cy10_ua2
0.000	0.000	2.087	94.527	3.386	0.000	0.000	0.000	0.000	0.000	0.055	my5740_rel_native_lto.cy10_ua3
0.000	0.000	2.231	93.925	3.844	0.000	0.000	0.000	0.000	0.000	0.057	my5740_rel_native_lto.cy10_ua4
Delete response time histogram
256us	1ms	4ms	16ms	64ms	256ms	1s	4s	16s	gt	max	tag
0.000	0.000	2.837	94.731	2.432	0.000	0.000	0.000	0.000	0.000	0.048	my5740_rel_native_lto.cy10_u
0.000	0.000	14.530	85.121	0.348	0.000	0.000	0.000	0.000	0.000	0.050	my5740_rel_native_lto.cy10_ua1
0.000	0.000	2.120	95.419	2.460	0.000	0.000	0.000	0.000	0.000	0.049	my5740_rel_native_lto.cy10_ua2
0.000	0.000	2.083	95.369	2.548	0.000	0.000	0.000	0.000	0.000	0.057	my5740_rel_native_lto.cy10_ua3
0.000	0.000	1.951	95.964	2.085	0.000	0.000	0.000	0.000	0.000	0.052	my5740_rel_native_lto.cy10_ua4