Introduction
This is a report for the insert benchmark with 480M docs and 24 client(s). It is generated by scripts (bash, awk, sed) and Tufte might not be impressed. An overview of the insert benchmark is here and a short update is here. Below, by DBMS, I mean DBMS+version.config. An example is my8020.c10b40 where my means MySQL, 8020 is version 8.0.20 and c10b40 is the name for the configuration file.
The test server has 80 cores with hyperthreads enabled, 256G RAM and fast storage. The benchmark was run with 24 clients and there were 1 or 3 connections per client (1 for queries or inserts without rate limits, 1+1 for rate limited inserts+deletes). There are 24 tables, with a client per table. It loads 480M rows without secondary indexes, creates secondary indexes, then inserts 120M rows with a delete per insert to avoid growing the table. It then does 3 read+write tests for 3600s each that do queries as fast as possible with 100, 500 and then 1000 inserts/second/client concurrent with the queries and 1000 deletes/second to avoid growing the table. The database is cached by the OS but not by InnoDB.
The tested DBMS are:
- my5740_rel_native_lto.cy10_4g_u - InnoDB and MySQL 5.7.40, rel_native_lto build, cy10_4g_u config, compiled with CMAKE_BUILD_TYPE=Release, base config
- my5740_rel_native_lto.cy10_4g_ua1 - InnoDB and MySQL 5.7.40, rel_native_lto build, cy10_4g_ua1 config, compiled with CMAKE_BUILD_TYPE=Release, adds innodb_use_native_aio=off
- my5740_rel_native_lto.cy10_4g_ua2 - InnoDB and MySQL 5.7.40, rel_native_lto build, cy10_4g_ua2 config, compiled with CMAKE_BUILD_TYPE=Release, adds innodb_io_capacity=20k, innodb_io_capacity_max=40k
- my5740_rel_native_lto.cy10_4g_ua3 - InnoDB and MySQL 5.7.40, rel_native_lto build, cy10_4g_ua3 config, compiled with CMAKE_BUILD_TYPE=Release, adds innodb_io_capacity=20k, innodb_io_capacity_max=40k, innodb_flush_sync=OFF
Contents
- Summary
- l.i0: load without secondary indexes
- l.x: create secondary indexes
- l.i1: continue load after secondary indexes created
- q100.1: range queries with 100 insert/s per client
- q500.1: range queries with 500 insert/s per client
- q1000.1: range queries with 1000 insert/s per client
Summary
The numbers are inserts/s for l.i0 and l.i1, indexed docs (or rows) /s for l.x and queries/s for q*.2. The values are the average rate over the entire test for inserts (IPS) and queries (QPS). The range of values for IPS and QPS is split into 3 parts: bottom 25%, middle 50%, top 25%. Values in the bottom 25% have a red background, values in the top 25% have a green background and values in the middle have no color. A gray background is used for values that can be ignored because the DBMS did not sustain the target insert rate. Red backgrounds are not used when the minimum value is within 80% of the max value.
| dbms | l.i0 | l.x | l.i1 | q100.1 | q500.1 | q1000.1 |
|---|---|---|---|---|---|---|
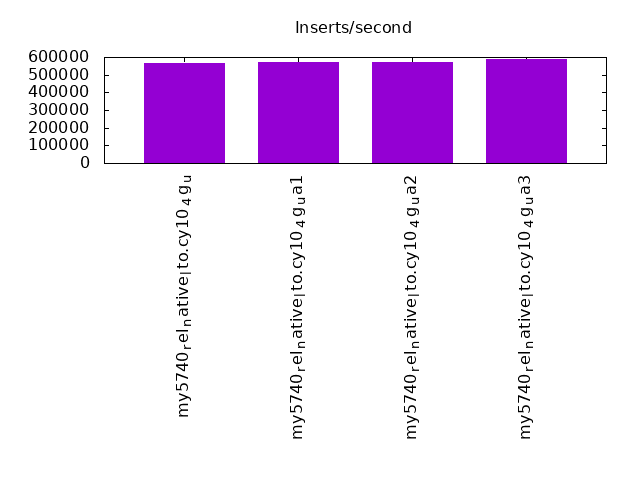
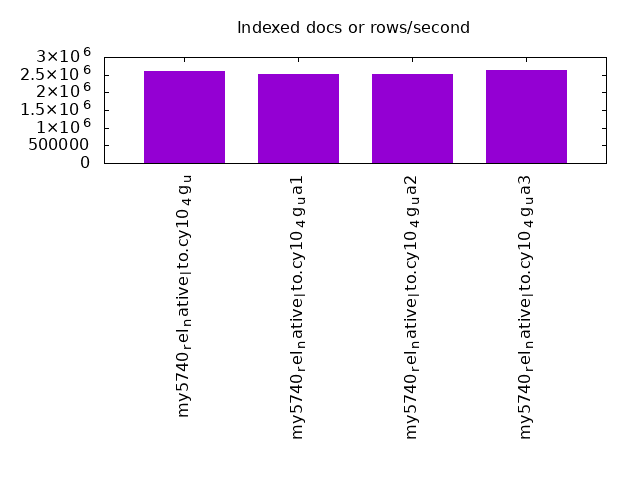
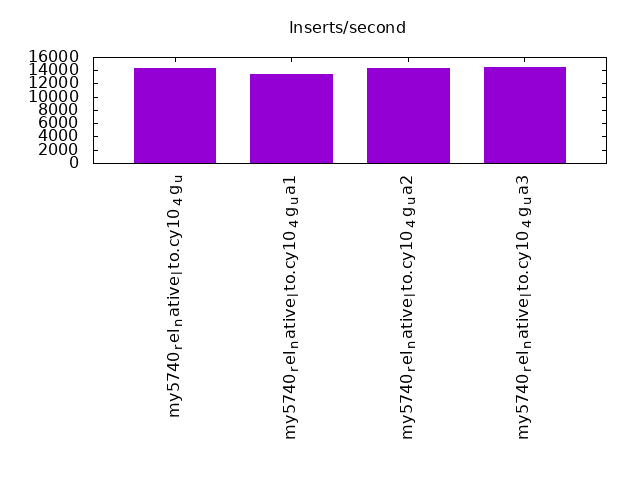
| my5740_rel_native_lto.cy10_4g_u | 565371 | 2595135 | 14332 | 13544 | 5825 | 3725 |
| my5740_rel_native_lto.cy10_4g_ua1 | 574163 | 2513612 | 13498 | 13980 | 4081 | 3533 |
| my5740_rel_native_lto.cy10_4g_ua2 | 570749 | 2513612 | 14407 | 13439 | 5352 | 3614 |
| my5740_rel_native_lto.cy10_4g_ua3 | 587515 | 2637912 | 14420 | 13417 | 5569 | 3642 |
This table has relative throughput, throughput for the DBMS relative to the DBMS in the first line, using the absolute throughput from the previous table. Values less than 0.95 have a yellow background. Values greater than 1.05 have a blue background.
| dbms | l.i0 | l.x | l.i1 | q100.1 | q500.1 | q1000.1 |
|---|---|---|---|---|---|---|
| my5740_rel_native_lto.cy10_4g_u | 1.00 | 1.00 | 1.00 | 1.00 | 1.00 | 1.00 |
| my5740_rel_native_lto.cy10_4g_ua1 | 1.02 | 0.97 | 0.94 | 1.03 | 0.70 | 0.95 |
| my5740_rel_native_lto.cy10_4g_ua2 | 1.01 | 0.97 | 1.01 | 0.99 | 0.92 | 0.97 |
| my5740_rel_native_lto.cy10_4g_ua3 | 1.04 | 1.02 | 1.01 | 0.99 | 0.96 | 0.98 |
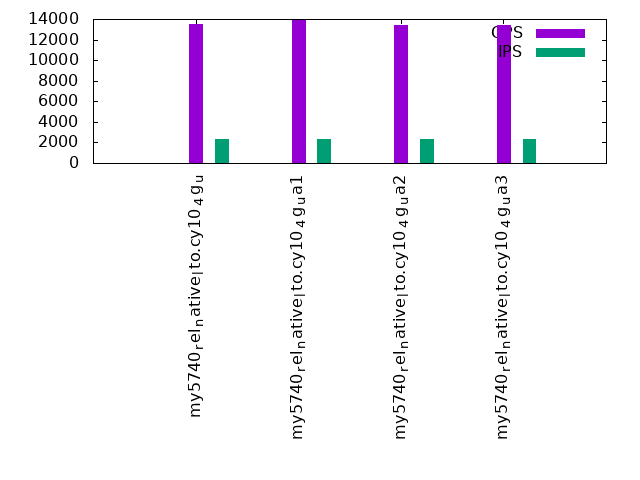
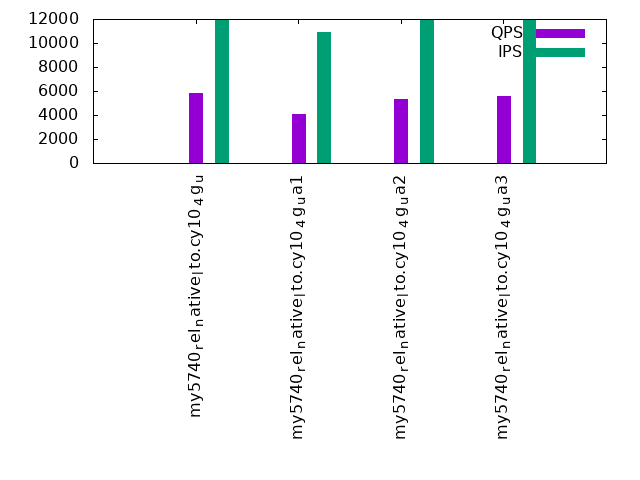
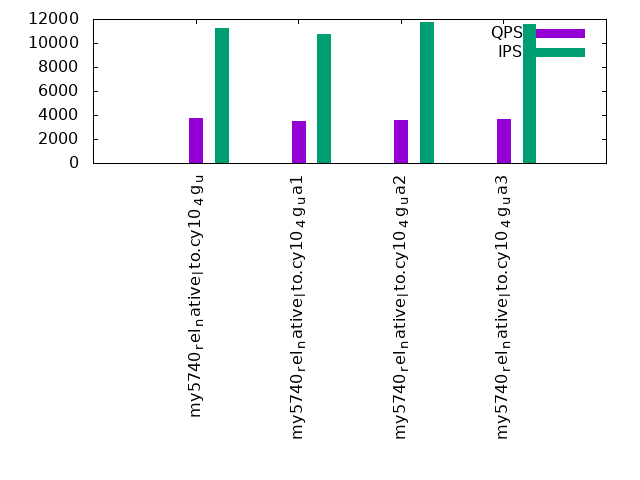
This lists the average rate of inserts/s for the tests that do inserts concurrent with queries. For such tests the query rate is listed in the table above. The read+write tests are setup so that the insert rate should match the target rate every second. Cells that are not at least 95% of the target have a red background to indicate a failure to satisfy the target.
| dbms | q100.1 | q500.1 | q1000.1 |
|---|---|---|---|
| my5740_rel_native_lto.cy10_4g_u | 2380 | 11901 | 11262 |
| my5740_rel_native_lto.cy10_4g_ua1 | 2380 | 10945 | 10774 |
| my5740_rel_native_lto.cy10_4g_ua2 | 2380 | 11907 | 11744 |
| my5740_rel_native_lto.cy10_4g_ua3 | 2378 | 11904 | 11619 |
| target | 2400 | 12000 | 24000 |
l.i0
l.i0: load without secondary indexes. Graphs for performance per 1-second interval are here.
Average throughput:
Insert response time histogram: each cell has the percentage of responses that take <= the time in the header and max is the max response time in seconds. For the max column values in the top 25% of the range have a red background and in the bottom 25% of the range have a green background. The red background is not used when the min value is within 80% of the max value.
| dbms | 256us | 1ms | 4ms | 16ms | 64ms | 256ms | 1s | 4s | 16s | gt | max |
|---|---|---|---|---|---|---|---|---|---|---|---|
| my5740_rel_native_lto.cy10_4g_u | 0.193 | 47.744 | 52.015 | 0.005 | 0.043 | 0.090 | |||||
| my5740_rel_native_lto.cy10_4g_ua1 | 0.132 | 55.021 | 44.799 | 0.006 | 0.043 | 0.096 | |||||
| my5740_rel_native_lto.cy10_4g_ua2 | 0.210 | 51.650 | 48.090 | 0.006 | 0.043 | 0.091 | |||||
| my5740_rel_native_lto.cy10_4g_ua3 | 0.208 | 63.846 | 35.898 | 0.005 | 0.043 | 0.095 |
Performance metrics for the DBMS listed above. Some are normalized by throughput, others are not. Legend for results is here.
ips	qps	rps	rmbps	wps	wmbps	rpq	rkbpq	wpi	wkbpi	csps	cpups	cspq	cpupq	dbgb1	dbgb2	rss	maxop	p50	p99	tag
565371	0	0	0.0	1849.8	142.1	0.000	0.000	0.003	0.257	90151	40.1	0.159	57	31.8	160.3	4.5	0.090	24176	21678	480m.my5740_rel_native_lto.cy10_4g_u
574163	0	0	0.0	1869.3	145.1	0.000	0.000	0.003	0.259	105591	40.6	0.184	57	31.8	160.3	4.5	0.096	24476	22078	480m.my5740_rel_native_lto.cy10_4g_ua1
570749	0	0	0.0	1868.5	143.6	0.000	0.000	0.003	0.258	90412	40.2	0.158	56	31.8	160.3	4.5	0.091	24375	21678	480m.my5740_rel_native_lto.cy10_4g_ua2
587515	0	0	0.0	1910.6	147.9	0.000	0.000	0.003	0.258	92746	40.6	0.158	55	31.8	160.3	4.5	0.095	25075	22478	480m.my5740_rel_native_lto.cy10_4g_ua3
l.x
l.x: create secondary indexes.
Average throughput:
Performance metrics for the DBMS listed above. Some are normalized by throughput, others are not. Legend for results is here.
ips	qps	rps	rmbps	wps	wmbps	rpq	rkbpq	wpi	wkbpi	csps	cpups	cspq	cpupq	dbgb1	dbgb2	rss	maxop	p50	p99	tag
2595135	0	1	0.1	23225.7	1987.2	0.000	0.000	0.009	0.784	124631	27.0	0.048	8	70.8	199.3	5.1	0.002	NA	NA	480m.my5740_rel_native_lto.cy10_4g_u
2513612	0	1	0.1	21901.1	1928.1	0.000	0.000	0.009	0.785	352516	28.4	0.140	9	70.8	199.3	5.1	0.004	NA	NA	480m.my5740_rel_native_lto.cy10_4g_ua1
2513612	0	1	0.0	22193.5	1925.6	0.000	0.000	0.009	0.784	132237	26.7	0.053	8	70.8	199.3	5.1	0.002	NA	NA	480m.my5740_rel_native_lto.cy10_4g_ua2
2637912	0	1	0.1	23310.0	2026.5	0.000	0.000	0.009	0.787	129588	28.5	0.049	9	70.8	199.3	5.1	0.002	NA	NA	480m.my5740_rel_native_lto.cy10_4g_ua3
l.i1
l.i1: continue load after secondary indexes created. Graphs for performance per 1-second interval are here.
Average throughput:
Insert response time histogram: each cell has the percentage of responses that take <= the time in the header and max is the max response time in seconds. For the max column values in the top 25% of the range have a red background and in the bottom 25% of the range have a green background. The red background is not used when the min value is within 80% of the max value.
| dbms | 256us | 1ms | 4ms | 16ms | 64ms | 256ms | 1s | 4s | 16s | gt | max |
|---|---|---|---|---|---|---|---|---|---|---|---|
| my5740_rel_native_lto.cy10_4g_u | nonzero | 0.831 | 63.862 | 30.031 | 5.138 | 0.136 | 0.001 | 6.573 | |||
| my5740_rel_native_lto.cy10_4g_ua1 | nonzero | 0.132 | 78.704 | 16.153 | 4.074 | 0.931 | 0.005 | 8.467 | |||
| my5740_rel_native_lto.cy10_4g_ua2 | nonzero | 0.704 | 64.175 | 29.983 | 5.006 | 0.129 | 0.002 | 6.513 | |||
| my5740_rel_native_lto.cy10_4g_ua3 | nonzero | 0.703 | 64.066 | 30.042 | 5.065 | 0.123 | 0.002 | 6.369 |
Delete response time histogram: each cell has the percentage of responses that take <= the time in the header and max is the max response time in seconds. For the max column values in the top 25% of the range have a red background and in the bottom 25% of the range have a green background. The red background is not used when the min value is within 80% of the max value.
| dbms | 256us | 1ms | 4ms | 16ms | 64ms | 256ms | 1s | 4s | 16s | gt | max |
|---|---|---|---|---|---|---|---|---|---|---|---|
| my5740_rel_native_lto.cy10_4g_u | 0.048 | 2.622 | 66.272 | 27.144 | 3.788 | 0.126 | 0.001 | 6.532 | |||
| my5740_rel_native_lto.cy10_4g_ua1 | 0.025 | 1.832 | 81.371 | 12.874 | 3.084 | 0.809 | 0.004 | 8.628 | |||
| my5740_rel_native_lto.cy10_4g_ua2 | 0.047 | 2.446 | 66.821 | 26.896 | 3.671 | 0.118 | 0.002 | 7.567 | |||
| my5740_rel_native_lto.cy10_4g_ua3 | 0.049 | 2.420 | 66.618 | 27.083 | 3.718 | 0.110 | 0.002 | 5.822 |
Performance metrics for the DBMS listed above. Some are normalized by throughput, others are not. Legend for results is here.
ips	qps	rps	rmbps	wps	wmbps	rpq	rkbpq	wpi	wkbpi	csps	cpups	cspq	cpupq	dbgb1	dbgb2	rss	maxop	p50	p99	tag
14332	0	7	0.5	29005.2	775.8	0.000	0.036	2.024	55.432	375300	36.7	26.187	2049	117.5	256.0	5.1	6.573	549	0	480m.my5740_rel_native_lto.cy10_4g_u
13498	0	7	0.4	24621.8	707.0	0.001	0.034	1.824	53.636	558553	37.7	41.379	2234	117.7	256.5	5.1	8.467	549	0	480m.my5740_rel_native_lto.cy10_4g_ua1
14407	0	7	0.5	29340.0	789.2	0.000	0.033	2.036	56.093	381392	36.3	26.472	2016	117.5	256.0	5.1	6.513	549	0	480m.my5740_rel_native_lto.cy10_4g_ua2
14420	0	7	0.4	29046.6	811.9	0.001	0.030	2.014	57.657	379648	36.6	26.329	2031	117.5	256.0	5.1	6.369	549	0	480m.my5740_rel_native_lto.cy10_4g_ua3
q100.1
q100.1: range queries with 100 insert/s per client. Graphs for performance per 1-second interval are here.
Average throughput:
Query response time histogram: each cell has the percentage of responses that take <= the time in the header and max is the max response time in seconds. For max values in the top 25% of the range have a red background and in the bottom 25% of the range have a green background. The red background is not used when the min value is within 80% of the max value.
| dbms | 256us | 1ms | 4ms | 16ms | 64ms | 256ms | 1s | 4s | 16s | gt | max |
|---|---|---|---|---|---|---|---|---|---|---|---|
| my5740_rel_native_lto.cy10_4g_u | 2.914 | 33.316 | 56.957 | 6.767 | 0.046 | nonzero | 0.203 | ||||
| my5740_rel_native_lto.cy10_4g_ua1 | 2.755 | 36.971 | 53.410 | 6.806 | 0.058 | 0.001 | nonzero | 0.472 | |||
| my5740_rel_native_lto.cy10_4g_ua2 | 2.992 | 34.388 | 55.378 | 7.202 | 0.037 | 0.003 | nonzero | 0.270 | |||
| my5740_rel_native_lto.cy10_4g_ua3 | 2.954 | 33.252 | 56.784 | 6.961 | 0.048 | 0.001 | nonzero | 0.422 |
Insert response time histogram: each cell has the percentage of responses that take <= the time in the header and max is the max response time in seconds. For max values in the top 25% of the range have a red background and in the bottom 25% of the range have a green background. The red background is not used when the min value is within 80% of the max value.
| dbms | 256us | 1ms | 4ms | 16ms | 64ms | 256ms | 1s | 4s | 16s | gt | max |
|---|---|---|---|---|---|---|---|---|---|---|---|
| my5740_rel_native_lto.cy10_4g_u | 0.204 | 96.130 | 3.624 | 0.042 | 0.213 | ||||||
| my5740_rel_native_lto.cy10_4g_ua1 | 0.179 | 91.109 | 8.619 | 0.091 | 0.002 | 0.426 | |||||
| my5740_rel_native_lto.cy10_4g_ua2 | 0.240 | 97.054 | 2.638 | 0.067 | 0.001 | 0.299 | |||||
| my5740_rel_native_lto.cy10_4g_ua3 | 0.208 | 95.910 | 3.793 | 0.084 | 0.005 | 0.410 |
Delete response time histogram: each cell has the percentage of responses that take <= the time in the header and max is the max response time in seconds. For max values in the top 25% of the range have a red background and in the bottom 25% of the range have a green background. The red background is not used when the min value is within 80% of the max value.
| dbms | 256us | 1ms | 4ms | 16ms | 64ms | 256ms | 1s | 4s | 16s | gt | max |
|---|---|---|---|---|---|---|---|---|---|---|---|
| my5740_rel_native_lto.cy10_4g_u | 0.299 | 96.501 | 3.159 | 0.041 | 0.215 | ||||||
| my5740_rel_native_lto.cy10_4g_ua1 | 0.215 | 92.489 | 7.211 | 0.083 | 0.002 | 0.478 | |||||
| my5740_rel_native_lto.cy10_4g_ua2 | 0.399 | 97.328 | 2.218 | 0.056 | 0.001 | 0.298 | |||||
| my5740_rel_native_lto.cy10_4g_ua3 | 0.310 | 96.344 | 3.271 | 0.072 | 0.003 | 0.366 |
Performance metrics for the DBMS listed above. Some are normalized by throughput, others are not. Legend for results is here.
ips	qps	rps	rmbps	wps	wmbps	rpq	rkbpq	wpi	wkbpi	csps	cpups	cspq	cpupq	dbgb1	dbgb2	rss	maxop	p50	p99	tag
2380	13544	56	1.2	58856.4	1069.1	0.004	0.090	24.729	459.968	677403	32.5	50.015	1920	117.5	256.0	5.1	0.203	559	176	480m.my5740_rel_native_lto.cy10_4g_u
2380	13980	64	1.3	55558.4	1043.7	0.005	0.097	23.349	449.151	644666	34.0	46.115	1946	117.7	256.5	5.1	0.472	591	240	480m.my5740_rel_native_lto.cy10_4g_ua1
2380	13439	54	1.1	59665.0	1085.2	0.004	0.084	25.075	467.021	700440	32.1	52.120	1911	117.5	256.0	5.1	0.270	559	384	480m.my5740_rel_native_lto.cy10_4g_ua2
2378	13417	58	1.2	59546.7	1085.1	0.004	0.093	25.040	467.260	695657	32.5	51.848	1938	117.5	256.0	5.1	0.422	559	336	480m.my5740_rel_native_lto.cy10_4g_ua3
q500.1
q500.1: range queries with 500 insert/s per client. Graphs for performance per 1-second interval are here.
Average throughput:
Query response time histogram: each cell has the percentage of responses that take <= the time in the header and max is the max response time in seconds. For max values in the top 25% of the range have a red background and in the bottom 25% of the range have a green background. The red background is not used when the min value is within 80% of the max value.
| dbms | 256us | 1ms | 4ms | 16ms | 64ms | 256ms | 1s | 4s | 16s | gt | max |
|---|---|---|---|---|---|---|---|---|---|---|---|
| my5740_rel_native_lto.cy10_4g_u | 2.920 | 16.347 | 48.904 | 29.273 | 2.445 | 0.086 | 0.025 | 0.992 | |||
| my5740_rel_native_lto.cy10_4g_ua1 | 1.963 | 20.341 | 42.150 | 28.756 | 6.421 | 0.288 | 0.074 | 0.007 | 2.661 | ||
| my5740_rel_native_lto.cy10_4g_ua2 | 2.660 | 16.732 | 47.475 | 29.747 | 3.237 | 0.109 | 0.041 | nonzero | 1.172 | ||
| my5740_rel_native_lto.cy10_4g_ua3 | 2.792 | 16.178 | 48.667 | 29.429 | 2.803 | 0.095 | 0.037 | nonzero | 1.201 |
Insert response time histogram: each cell has the percentage of responses that take <= the time in the header and max is the max response time in seconds. For max values in the top 25% of the range have a red background and in the bottom 25% of the range have a green background. The red background is not used when the min value is within 80% of the max value.
| dbms | 256us | 1ms | 4ms | 16ms | 64ms | 256ms | 1s | 4s | 16s | gt | max |
|---|---|---|---|---|---|---|---|---|---|---|---|
| my5740_rel_native_lto.cy10_4g_u | 0.003 | 5.001 | 81.075 | 12.661 | 1.256 | 0.004 | 1.606 | ||||
| my5740_rel_native_lto.cy10_4g_ua1 | 0.003 | 1.560 | 47.717 | 46.056 | 4.317 | 0.347 | 3.764 | ||||
| my5740_rel_native_lto.cy10_4g_ua2 | 0.003 | 2.840 | 75.787 | 19.287 | 2.074 | 0.008 | 1.328 | ||||
| my5740_rel_native_lto.cy10_4g_ua3 | 0.003 | 3.340 | 79.464 | 15.331 | 1.853 | 0.007 | 1.376 |
Delete response time histogram: each cell has the percentage of responses that take <= the time in the header and max is the max response time in seconds. For max values in the top 25% of the range have a red background and in the bottom 25% of the range have a green background. The red background is not used when the min value is within 80% of the max value.
| dbms | 256us | 1ms | 4ms | 16ms | 64ms | 256ms | 1s | 4s | 16s | gt | max |
|---|---|---|---|---|---|---|---|---|---|---|---|
| my5740_rel_native_lto.cy10_4g_u | 0.006 | 5.585 | 81.093 | 12.281 | 1.032 | 0.003 | 1.552 | ||||
| my5740_rel_native_lto.cy10_4g_ua1 | 0.005 | 1.665 | 48.981 | 45.410 | 3.702 | 0.238 | 2.894 | ||||
| my5740_rel_native_lto.cy10_4g_ua2 | 0.008 | 2.988 | 76.235 | 19.021 | 1.742 | 0.005 | 1.246 | ||||
| my5740_rel_native_lto.cy10_4g_ua3 | 0.005 | 3.603 | 79.828 | 15.037 | 1.523 | 0.004 | 1.462 |
Performance metrics for the DBMS listed above. Some are normalized by throughput, others are not. Legend for results is here.
ips	qps	rps	rmbps	wps	wmbps	rpq	rkbpq	wpi	wkbpi	csps	cpups	cspq	cpupq	dbgb1	dbgb2	rss	maxop	p50	p99	tag
11901	5825	313	6.1	48821.2	971.7	0.054	1.066	4.102	83.609	557492	48.0	95.710	6593	117.8	256.6	5.2	0.992	256	128	480m.my5740_rel_native_lto.cy10_4g_u
10945	4081	278	5.4	33342.8	758.9	0.068	1.353	3.046	71.001	553299	51.6	135.576	10115	118.4	258.1	5.1	2.661	176	16	480m.my5740_rel_native_lto.cy10_4g_ua1
11907	5352	313	6.1	46634.9	947.2	0.059	1.161	3.916	81.456	540947	49.5	101.070	7399	117.8	256.8	5.2	1.172	224	96	480m.my5740_rel_native_lto.cy10_4g_ua2
11904	5569	334	6.4	48286.7	980.6	0.060	1.179	4.056	84.355	551131	49.1	98.969	7054	117.8	256.8	5.2	1.201	240	96	480m.my5740_rel_native_lto.cy10_4g_ua3
q1000.1
q1000.1: range queries with 1000 insert/s per client. Graphs for performance per 1-second interval are here.
Average throughput:
Query response time histogram: each cell has the percentage of responses that take <= the time in the header and max is the max response time in seconds. For max values in the top 25% of the range have a red background and in the bottom 25% of the range have a green background. The red background is not used when the min value is within 80% of the max value.
| dbms | 256us | 1ms | 4ms | 16ms | 64ms | 256ms | 1s | 4s | 16s | gt | max |
|---|---|---|---|---|---|---|---|---|---|---|---|
| my5740_rel_native_lto.cy10_4g_u | 1.550 | 19.169 | 40.870 | 29.823 | 8.097 | 0.405 | 0.085 | nonzero | 1.748 | ||
| my5740_rel_native_lto.cy10_4g_ua1 | 1.406 | 20.614 | 39.033 | 30.006 | 8.429 | 0.411 | 0.092 | 0.009 | nonzero | 4.292 | |
| my5740_rel_native_lto.cy10_4g_ua2 | 1.676 | 18.978 | 40.671 | 30.250 | 7.957 | 0.335 | 0.132 | 0.001 | 1.734 | ||
| my5740_rel_native_lto.cy10_4g_ua3 | 1.740 | 18.905 | 40.836 | 30.253 | 7.813 | 0.325 | 0.127 | 0.001 | 1.524 |
Insert response time histogram: each cell has the percentage of responses that take <= the time in the header and max is the max response time in seconds. For max values in the top 25% of the range have a red background and in the bottom 25% of the range have a green background. The red background is not used when the min value is within 80% of the max value.
| dbms | 256us | 1ms | 4ms | 16ms | 64ms | 256ms | 1s | 4s | 16s | gt | max |
|---|---|---|---|---|---|---|---|---|---|---|---|
| my5740_rel_native_lto.cy10_4g_u | nonzero | 0.427 | 40.456 | 52.901 | 6.163 | 0.053 | 2.123 | ||||
| my5740_rel_native_lto.cy10_4g_ua1 | nonzero | 0.628 | 39.967 | 53.566 | 5.421 | 0.418 | nonzero | 4.677 | |||
| my5740_rel_native_lto.cy10_4g_ua2 | nonzero | 0.616 | 47.988 | 44.845 | 6.425 | 0.126 | 1.836 | ||||
| my5740_rel_native_lto.cy10_4g_ua3 | nonzero | 0.749 | 46.525 | 46.182 | 6.418 | 0.126 | 1.817 |
Delete response time histogram: each cell has the percentage of responses that take <= the time in the header and max is the max response time in seconds. For max values in the top 25% of the range have a red background and in the bottom 25% of the range have a green background. The red background is not used when the min value is within 80% of the max value.
| dbms | 256us | 1ms | 4ms | 16ms | 64ms | 256ms | 1s | 4s | 16s | gt | max |
|---|---|---|---|---|---|---|---|---|---|---|---|
| my5740_rel_native_lto.cy10_4g_u | 0.001 | 0.439 | 41.628 | 52.488 | 5.412 | 0.031 | 2.002 | ||||
| my5740_rel_native_lto.cy10_4g_ua1 | 0.002 | 0.653 | 41.249 | 53.001 | 4.802 | 0.292 | nonzero | 4.279 | |||
| my5740_rel_native_lto.cy10_4g_ua2 | 0.002 | 0.643 | 49.643 | 44.115 | 5.522 | 0.075 | 1.885 | ||||
| my5740_rel_native_lto.cy10_4g_ua3 | 0.002 | 0.790 | 48.151 | 45.424 | 5.562 | 0.072 | 1.773 |
Performance metrics for the DBMS listed above. Some are normalized by throughput, others are not. Legend for results is here.
ips	qps	rps	rmbps	wps	wmbps	rpq	rkbpq	wpi	wkbpi	csps	cpups	cspq	cpupq	dbgb1	dbgb2	rss	maxop	p50	p99	tag
11262	3725	6	0.1	33847.5	763.7	0.001	0.030	3.006	69.445	463692	54.2	124.485	11641	122.9	267.6	5.2	1.748	160	48	480m.my5740_rel_native_lto.cy10_4g_u
10774	3533	9	0.2	30211.1	696.3	0.002	0.049	2.804	66.173	540742	52.9	153.059	11979	123.6	269.1	5.1	4.292	160	16	480m.my5740_rel_native_lto.cy10_4g_ua1
11744	3614	10	0.2	34447.0	771.0	0.003	0.047	2.933	67.222	449872	52.9	124.494	11711	123.1	268.0	5.2	1.734	160	48	480m.my5740_rel_native_lto.cy10_4g_ua2
11619	3642	15	0.2	34458.5	795.7	0.004	0.063	2.966	70.125	448576	53.1	123.178	11665	123.0	267.9	5.2	1.524	160	48	480m.my5740_rel_native_lto.cy10_4g_ua3
l.i0
l.i0: load without secondary indexes
Performance metrics for all DBMS, not just the ones listed above. Some are normalized by throughput, others are not. Legend for results is here.
ips	qps	rps	rmbps	wps	wmbps	rpq	rkbpq	wpi	wkbpi	csps	cpups	cspq	cpupq	dbgb1	dbgb2	rss	maxop	p50	p99	tag
565371	0	0	0.0	1849.8	142.1	0.000	0.000	0.003	0.257	90151	40.1	0.159	57	31.8	160.3	4.5	0.090	24176	21678	480m.my5740_rel_native_lto.cy10_4g_u
574163	0	0	0.0	1869.3	145.1	0.000	0.000	0.003	0.259	105591	40.6	0.184	57	31.8	160.3	4.5	0.096	24476	22078	480m.my5740_rel_native_lto.cy10_4g_ua1
570749	0	0	0.0	1868.5	143.6	0.000	0.000	0.003	0.258	90412	40.2	0.158	56	31.8	160.3	4.5	0.091	24375	21678	480m.my5740_rel_native_lto.cy10_4g_ua2
587515	0	0	0.0	1910.6	147.9	0.000	0.000	0.003	0.258	92746	40.6	0.158	55	31.8	160.3	4.5	0.095	25075	22478	480m.my5740_rel_native_lto.cy10_4g_ua3
l.x
l.x: create secondary indexes
Performance metrics for all DBMS, not just the ones listed above. Some are normalized by throughput, others are not. Legend for results is here.
ips	qps	rps	rmbps	wps	wmbps	rpq	rkbpq	wpi	wkbpi	csps	cpups	cspq	cpupq	dbgb1	dbgb2	rss	maxop	p50	p99	tag
2595135	0	1	0.1	23225.7	1987.2	0.000	0.000	0.009	0.784	124631	27.0	0.048	8	70.8	199.3	5.1	0.002	NA	NA	480m.my5740_rel_native_lto.cy10_4g_u
2513612	0	1	0.1	21901.1	1928.1	0.000	0.000	0.009	0.785	352516	28.4	0.140	9	70.8	199.3	5.1	0.004	NA	NA	480m.my5740_rel_native_lto.cy10_4g_ua1
2513612	0	1	0.0	22193.5	1925.6	0.000	0.000	0.009	0.784	132237	26.7	0.053	8	70.8	199.3	5.1	0.002	NA	NA	480m.my5740_rel_native_lto.cy10_4g_ua2
2637912	0	1	0.1	23310.0	2026.5	0.000	0.000	0.009	0.787	129588	28.5	0.049	9	70.8	199.3	5.1	0.002	NA	NA	480m.my5740_rel_native_lto.cy10_4g_ua3
l.i1
l.i1: continue load after secondary indexes created
Performance metrics for all DBMS, not just the ones listed above. Some are normalized by throughput, others are not. Legend for results is here.
ips	qps	rps	rmbps	wps	wmbps	rpq	rkbpq	wpi	wkbpi	csps	cpups	cspq	cpupq	dbgb1	dbgb2	rss	maxop	p50	p99	tag
14332	0	7	0.5	29005.2	775.8	0.000	0.036	2.024	55.432	375300	36.7	26.187	2049	117.5	256.0	5.1	6.573	549	0	480m.my5740_rel_native_lto.cy10_4g_u
13498	0	7	0.4	24621.8	707.0	0.001	0.034	1.824	53.636	558553	37.7	41.379	2234	117.7	256.5	5.1	8.467	549	0	480m.my5740_rel_native_lto.cy10_4g_ua1
14407	0	7	0.5	29340.0	789.2	0.000	0.033	2.036	56.093	381392	36.3	26.472	2016	117.5	256.0	5.1	6.513	549	0	480m.my5740_rel_native_lto.cy10_4g_ua2
14420	0	7	0.4	29046.6	811.9	0.001	0.030	2.014	57.657	379648	36.6	26.329	2031	117.5	256.0	5.1	6.369	549	0	480m.my5740_rel_native_lto.cy10_4g_ua3
q100.1
q100.1: range queries with 100 insert/s per client
Performance metrics for all DBMS, not just the ones listed above. Some are normalized by throughput, others are not. Legend for results is here.
ips	qps	rps	rmbps	wps	wmbps	rpq	rkbpq	wpi	wkbpi	csps	cpups	cspq	cpupq	dbgb1	dbgb2	rss	maxop	p50	p99	tag
2380	13544	56	1.2	58856.4	1069.1	0.004	0.090	24.729	459.968	677403	32.5	50.015	1920	117.5	256.0	5.1	0.203	559	176	480m.my5740_rel_native_lto.cy10_4g_u
2380	13980	64	1.3	55558.4	1043.7	0.005	0.097	23.349	449.151	644666	34.0	46.115	1946	117.7	256.5	5.1	0.472	591	240	480m.my5740_rel_native_lto.cy10_4g_ua1
2380	13439	54	1.1	59665.0	1085.2	0.004	0.084	25.075	467.021	700440	32.1	52.120	1911	117.5	256.0	5.1	0.270	559	384	480m.my5740_rel_native_lto.cy10_4g_ua2
2378	13417	58	1.2	59546.7	1085.1	0.004	0.093	25.040	467.260	695657	32.5	51.848	1938	117.5	256.0	5.1	0.422	559	336	480m.my5740_rel_native_lto.cy10_4g_ua3
q500.1
q500.1: range queries with 500 insert/s per client
Performance metrics for all DBMS, not just the ones listed above. Some are normalized by throughput, others are not. Legend for results is here.
ips	qps	rps	rmbps	wps	wmbps	rpq	rkbpq	wpi	wkbpi	csps	cpups	cspq	cpupq	dbgb1	dbgb2	rss	maxop	p50	p99	tag
11901	5825	313	6.1	48821.2	971.7	0.054	1.066	4.102	83.609	557492	48.0	95.710	6593	117.8	256.6	5.2	0.992	256	128	480m.my5740_rel_native_lto.cy10_4g_u
10945	4081	278	5.4	33342.8	758.9	0.068	1.353	3.046	71.001	553299	51.6	135.576	10115	118.4	258.1	5.1	2.661	176	16	480m.my5740_rel_native_lto.cy10_4g_ua1
11907	5352	313	6.1	46634.9	947.2	0.059	1.161	3.916	81.456	540947	49.5	101.070	7399	117.8	256.8	5.2	1.172	224	96	480m.my5740_rel_native_lto.cy10_4g_ua2
11904	5569	334	6.4	48286.7	980.6	0.060	1.179	4.056	84.355	551131	49.1	98.969	7054	117.8	256.8	5.2	1.201	240	96	480m.my5740_rel_native_lto.cy10_4g_ua3
q1000.1
q1000.1: range queries with 1000 insert/s per client
Performance metrics for all DBMS, not just the ones listed above. Some are normalized by throughput, others are not. Legend for results is here.
ips	qps	rps	rmbps	wps	wmbps	rpq	rkbpq	wpi	wkbpi	csps	cpups	cspq	cpupq	dbgb1	dbgb2	rss	maxop	p50	p99	tag
11262	3725	6	0.1	33847.5	763.7	0.001	0.030	3.006	69.445	463692	54.2	124.485	11641	122.9	267.6	5.2	1.748	160	48	480m.my5740_rel_native_lto.cy10_4g_u
10774	3533	9	0.2	30211.1	696.3	0.002	0.049	2.804	66.173	540742	52.9	153.059	11979	123.6	269.1	5.1	4.292	160	16	480m.my5740_rel_native_lto.cy10_4g_ua1
11744	3614	10	0.2	34447.0	771.0	0.003	0.047	2.933	67.222	449872	52.9	124.494	11711	123.1	268.0	5.2	1.734	160	48	480m.my5740_rel_native_lto.cy10_4g_ua2
11619	3642	15	0.2	34458.5	795.7	0.004	0.063	2.966	70.125	448576	53.1	123.178	11665	123.0	267.9	5.2	1.524	160	48	480m.my5740_rel_native_lto.cy10_4g_ua3
l.i0
- l.i0: load without secondary indexes
- Legend for results is here.
- Each entry lists the percentage of responses that fit in that bucket (slower than max time for previous bucket, faster than min time for next bucket).
Insert response time histogram
256us	1ms	4ms	16ms	64ms	256ms	1s	4s	16s	gt	max	tag
0.000	0.193	47.744	52.015	0.005	0.043	0.000	0.000	0.000	0.000	0.090	my5740_rel_native_lto.cy10_4g_u
0.000	0.132	55.021	44.799	0.006	0.043	0.000	0.000	0.000	0.000	0.096	my5740_rel_native_lto.cy10_4g_ua1
0.000	0.210	51.650	48.090	0.006	0.043	0.000	0.000	0.000	0.000	0.091	my5740_rel_native_lto.cy10_4g_ua2
0.000	0.208	63.846	35.898	0.005	0.043	0.000	0.000	0.000	0.000	0.095	my5740_rel_native_lto.cy10_4g_ua3
l.x
- l.x: create secondary indexes
- Legend for results is here.
- Each entry lists the percentage of responses that fit in that bucket (slower than max time for previous bucket, faster than min time for next bucket).
TODO - determine whether there is data for create index response time
l.i1
- l.i1: continue load after secondary indexes created
- Legend for results is here.
- Each entry lists the percentage of responses that fit in that bucket (slower than max time for previous bucket, faster than min time for next bucket).
Insert response time histogram
256us	1ms	4ms	16ms	64ms	256ms	1s	4s	16s	gt	max	tag
0.000	0.000	nonzero	0.831	63.862	30.031	5.138	0.136	0.001	0.000	6.573	my5740_rel_native_lto.cy10_4g_u
0.000	0.000	nonzero	0.132	78.704	16.153	4.074	0.931	0.005	0.000	8.467	my5740_rel_native_lto.cy10_4g_ua1
0.000	0.000	nonzero	0.704	64.175	29.983	5.006	0.129	0.002	0.000	6.513	my5740_rel_native_lto.cy10_4g_ua2
0.000	0.000	nonzero	0.703	64.066	30.042	5.065	0.123	0.002	0.000	6.369	my5740_rel_native_lto.cy10_4g_ua3
Delete response time histogram
256us	1ms	4ms	16ms	64ms	256ms	1s	4s	16s	gt	max	tag
0.000	0.000	0.048	2.622	66.272	27.144	3.788	0.126	0.001	0.000	6.532	my5740_rel_native_lto.cy10_4g_u
0.000	0.000	0.025	1.832	81.371	12.874	3.084	0.809	0.004	0.000	8.628	my5740_rel_native_lto.cy10_4g_ua1
0.000	0.000	0.047	2.446	66.821	26.896	3.671	0.118	0.002	0.000	7.567	my5740_rel_native_lto.cy10_4g_ua2
0.000	0.000	0.049	2.420	66.618	27.083	3.718	0.110	0.002	0.000	5.822	my5740_rel_native_lto.cy10_4g_ua3
q100.1
- q100.1: range queries with 100 insert/s per client
- Legend for results is here.
- Each entry lists the percentage of responses that fit in that bucket (slower than max time for previous bucket, faster than min time for next bucket).
Query response time histogram
256us	1ms	4ms	16ms	64ms	256ms	1s	4s	16s	gt	max	tag
2.914	33.316	56.957	6.767	0.046	nonzero	0.000	0.000	0.000	0.000	0.203	my5740_rel_native_lto.cy10_4g_u
2.755	36.971	53.410	6.806	0.058	0.001	nonzero	0.000	0.000	0.000	0.472	my5740_rel_native_lto.cy10_4g_ua1
2.992	34.388	55.378	7.202	0.037	0.003	nonzero	0.000	0.000	0.000	0.270	my5740_rel_native_lto.cy10_4g_ua2
2.954	33.252	56.784	6.961	0.048	0.001	nonzero	0.000	0.000	0.000	0.422	my5740_rel_native_lto.cy10_4g_ua3
Insert response time histogram
256us	1ms	4ms	16ms	64ms	256ms	1s	4s	16s	gt	max	tag
0.000	0.000	0.204	96.130	3.624	0.042	0.000	0.000	0.000	0.000	0.213	my5740_rel_native_lto.cy10_4g_u
0.000	0.000	0.179	91.109	8.619	0.091	0.002	0.000	0.000	0.000	0.426	my5740_rel_native_lto.cy10_4g_ua1
0.000	0.000	0.240	97.054	2.638	0.067	0.001	0.000	0.000	0.000	0.299	my5740_rel_native_lto.cy10_4g_ua2
0.000	0.000	0.208	95.910	3.793	0.084	0.005	0.000	0.000	0.000	0.410	my5740_rel_native_lto.cy10_4g_ua3
Delete response time histogram
256us	1ms	4ms	16ms	64ms	256ms	1s	4s	16s	gt	max	tag
0.000	0.000	0.299	96.501	3.159	0.041	0.000	0.000	0.000	0.000	0.215	my5740_rel_native_lto.cy10_4g_u
0.000	0.000	0.215	92.489	7.211	0.083	0.002	0.000	0.000	0.000	0.478	my5740_rel_native_lto.cy10_4g_ua1
0.000	0.000	0.399	97.328	2.218	0.056	0.001	0.000	0.000	0.000	0.298	my5740_rel_native_lto.cy10_4g_ua2
0.000	0.000	0.310	96.344	3.271	0.072	0.003	0.000	0.000	0.000	0.366	my5740_rel_native_lto.cy10_4g_ua3
q500.1
- q500.1: range queries with 500 insert/s per client
- Legend for results is here.
- Each entry lists the percentage of responses that fit in that bucket (slower than max time for previous bucket, faster than min time for next bucket).
Query response time histogram
256us	1ms	4ms	16ms	64ms	256ms	1s	4s	16s	gt	max	tag
2.920	16.347	48.904	29.273	2.445	0.086	0.025	0.000	0.000	0.000	0.992	my5740_rel_native_lto.cy10_4g_u
1.963	20.341	42.150	28.756	6.421	0.288	0.074	0.007	0.000	0.000	2.661	my5740_rel_native_lto.cy10_4g_ua1
2.660	16.732	47.475	29.747	3.237	0.109	0.041	nonzero	0.000	0.000	1.172	my5740_rel_native_lto.cy10_4g_ua2
2.792	16.178	48.667	29.429	2.803	0.095	0.037	nonzero	0.000	0.000	1.201	my5740_rel_native_lto.cy10_4g_ua3
Insert response time histogram
256us	1ms	4ms	16ms	64ms	256ms	1s	4s	16s	gt	max	tag
0.000	0.000	0.003	5.001	81.075	12.661	1.256	0.004	0.000	0.000	1.606	my5740_rel_native_lto.cy10_4g_u
0.000	0.000	0.003	1.560	47.717	46.056	4.317	0.347	0.000	0.000	3.764	my5740_rel_native_lto.cy10_4g_ua1
0.000	0.000	0.003	2.840	75.787	19.287	2.074	0.008	0.000	0.000	1.328	my5740_rel_native_lto.cy10_4g_ua2
0.000	0.000	0.003	3.340	79.464	15.331	1.853	0.007	0.000	0.000	1.376	my5740_rel_native_lto.cy10_4g_ua3
Delete response time histogram
256us	1ms	4ms	16ms	64ms	256ms	1s	4s	16s	gt	max	tag
0.000	0.000	0.006	5.585	81.093	12.281	1.032	0.003	0.000	0.000	1.552	my5740_rel_native_lto.cy10_4g_u
0.000	0.000	0.005	1.665	48.981	45.410	3.702	0.238	0.000	0.000	2.894	my5740_rel_native_lto.cy10_4g_ua1
0.000	0.000	0.008	2.988	76.235	19.021	1.742	0.005	0.000	0.000	1.246	my5740_rel_native_lto.cy10_4g_ua2
0.000	0.000	0.005	3.603	79.828	15.037	1.523	0.004	0.000	0.000	1.462	my5740_rel_native_lto.cy10_4g_ua3
q1000.1
- q1000.1: range queries with 1000 insert/s per client
- Legend for results is here.
- Each entry lists the percentage of responses that fit in that bucket (slower than max time for previous bucket, faster than min time for next bucket).
Query response time histogram
256us	1ms	4ms	16ms	64ms	256ms	1s	4s	16s	gt	max	tag
1.550	19.169	40.870	29.823	8.097	0.405	0.085	nonzero	0.000	0.000	1.748	my5740_rel_native_lto.cy10_4g_u
1.406	20.614	39.033	30.006	8.429	0.411	0.092	0.009	nonzero	0.000	4.292	my5740_rel_native_lto.cy10_4g_ua1
1.676	18.978	40.671	30.250	7.957	0.335	0.132	0.001	0.000	0.000	1.734	my5740_rel_native_lto.cy10_4g_ua2
1.740	18.905	40.836	30.253	7.813	0.325	0.127	0.001	0.000	0.000	1.524	my5740_rel_native_lto.cy10_4g_ua3
Insert response time histogram
256us	1ms	4ms	16ms	64ms	256ms	1s	4s	16s	gt	max	tag
0.000	0.000	nonzero	0.427	40.456	52.901	6.163	0.053	0.000	0.000	2.123	my5740_rel_native_lto.cy10_4g_u
0.000	0.000	nonzero	0.628	39.967	53.566	5.421	0.418	nonzero	0.000	4.677	my5740_rel_native_lto.cy10_4g_ua1
0.000	0.000	nonzero	0.616	47.988	44.845	6.425	0.126	0.000	0.000	1.836	my5740_rel_native_lto.cy10_4g_ua2
0.000	0.000	nonzero	0.749	46.525	46.182	6.418	0.126	0.000	0.000	1.817	my5740_rel_native_lto.cy10_4g_ua3
Delete response time histogram
256us	1ms	4ms	16ms	64ms	256ms	1s	4s	16s	gt	max	tag
0.000	0.000	0.001	0.439	41.628	52.488	5.412	0.031	0.000	0.000	2.002	my5740_rel_native_lto.cy10_4g_u
0.000	0.000	0.002	0.653	41.249	53.001	4.802	0.292	nonzero	0.000	4.279	my5740_rel_native_lto.cy10_4g_ua1
0.000	0.000	0.002	0.643	49.643	44.115	5.522	0.075	0.000	0.000	1.885	my5740_rel_native_lto.cy10_4g_ua2
0.000	0.000	0.002	0.790	48.151	45.424	5.562	0.072	0.000	0.000	1.773	my5740_rel_native_lto.cy10_4g_ua3