Introduction
This is a report for the insert benchmark with 12000M docs and 24 client(s). It is generated by scripts (bash, awk, sed) and Tufte might not be impressed. An overview of the insert benchmark is here and a short update is here. Below, by DBMS, I mean DBMS+version.config. An example is my8020.c10b40 where my means MySQL, 8020 is version 8.0.20 and c10b40 is the name for the configuration file.
The test server has 80 cores with hyperthreads enabled, 256G RAM and fast storage. The benchmark was run with 24 client and there were 1 or 3 connections per client (1 for queries or inserts without rate limits, 1+1 for rate limited inserts+deletes). There are 24 tables, with a client per table. It loads 12B rows without secondary indexes, creates secondary indexes, then inserts 120M rows with a delete per insert to avoid growing the table. It then does 3 read+write tests for 3600s each that do queries as fast as possible with 100, 500 and then 1000 inserts/second/client concurrent with the queries and 1000 deletes/second to avoid growing the table. The database is larger than memory.
The tested DBMS are:
- my5651_rel_native_lto.cy10_u - InnoDB and MySQL 5.6.51, rel_native_lto build, cy10_u config, compiled with CMAKE_BUILD_TYPE=Release
- my5651_rel_native_lto.cy10_ua1 - InnoDB and MySQL 5.6.51, rel_native_lto build, cy10_ua1 config, compiled with CMAKE_BUILD_TYPE=Release, adds innodb_use_native_aio=off
- my5651_rel_native_lto.cy10_ua2 - InnoDB and MySQL 5.6.51, rel_native_lto build, cy10_ua2 config, compiled with CMAKE_BUILD_TYPE=Release, adds innodb_io_capacity=20k, innodb_io_capacity_max=40k
- my5651_rel_native_lto.cy10_ua4 - InnoDB and MySQL 5.6.51, rel_native_lto build, cy10_ua4 config, compiled with CMAKE_BUILD_TYPE=Release, adds innodb_flush_method=fsync
Contents
- Summary
- l.i0: load without secondary indexes
- l.x: create secondary indexes
- l.i1: continue load after secondary indexes created
- q100.1: range queries with 100 insert/s per client
- q500.1: range queries with 500 insert/s per client
- q1000.1: range queries with 1000 insert/s per client
Summary
The numbers are inserts/s for l.i0 and l.i1, indexed docs (or rows) /s for l.x and queries/s for q*.2. The values are the average rate over the entire test for inserts (IPS) and queries (QPS). The range of values for IPS and QPS is split into 3 parts: bottom 25%, middle 50%, top 25%. Values in the bottom 25% have a red background, values in the top 25% have a green background and values in the middle have no color. A gray background is used for values that can be ignored because the DBMS did not sustain the target insert rate. Red backgrounds are not used when the minimum value is within 80% of the max value.
| dbms | l.i0 | l.x | l.i1 | q100.1 | q500.1 | q1000.1 |
|---|---|---|---|---|---|---|
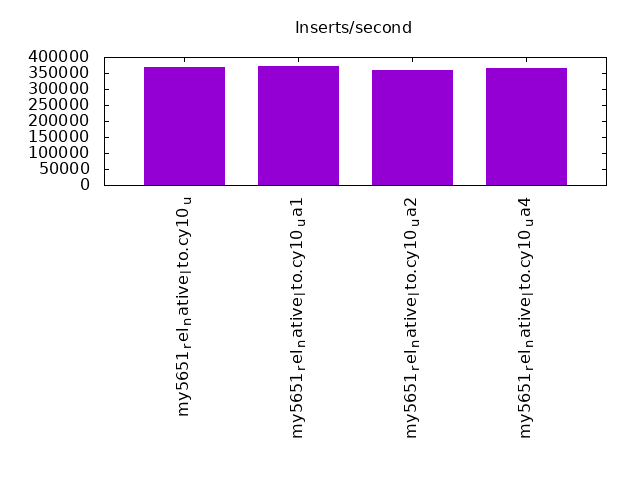
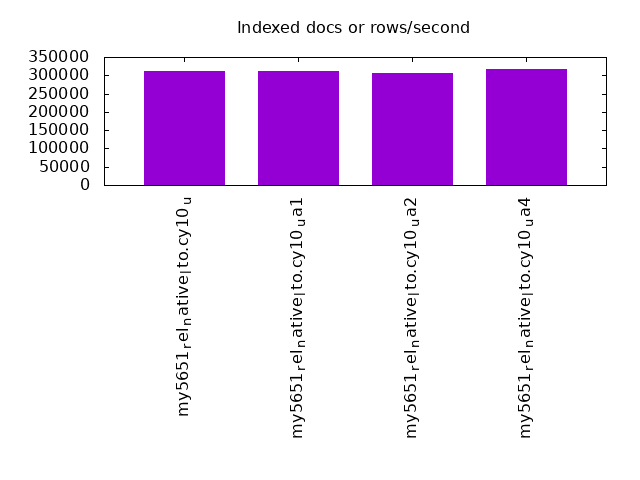
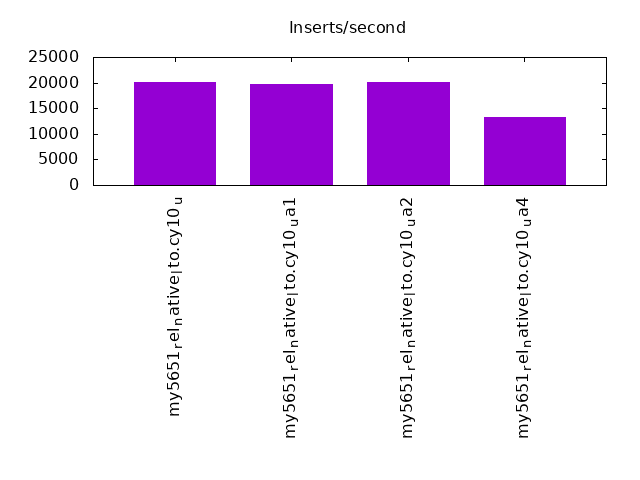
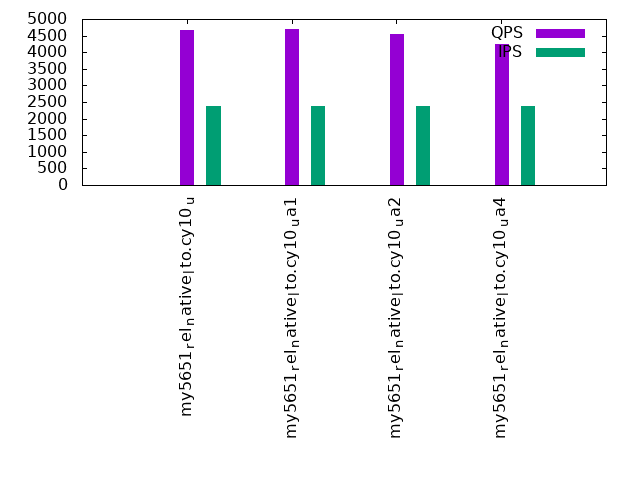
| my5651_rel_native_lto.cy10_u | 368562 | 311999 | 20154 | 4660 | 4236 | 4143 |
| my5651_rel_native_lto.cy10_ua1 | 373169 | 312429 | 19750 | 4698 | 4312 | 4265 |
| my5651_rel_native_lto.cy10_ua2 | 360133 | 307269 | 20084 | 4537 | 4092 | 4009 |
| my5651_rel_native_lto.cy10_ua4 | 364133 | 317648 | 13302 | 4233 | 4258 | 4190 |
This table has relative throughput, throughput for the DBMS relative to the DBMS in the first line, using the absolute throughput from the previous table. Values less than 0.95 have a yellow background. Values greater than 1.05 have a blue background.
| dbms | l.i0 | l.x | l.i1 | q100.1 | q500.1 | q1000.1 |
|---|---|---|---|---|---|---|
| my5651_rel_native_lto.cy10_u | 1.00 | 1.00 | 1.00 | 1.00 | 1.00 | 1.00 |
| my5651_rel_native_lto.cy10_ua1 | 1.01 | 1.00 | 0.98 | 1.01 | 1.02 | 1.03 |
| my5651_rel_native_lto.cy10_ua2 | 0.98 | 0.98 | 1.00 | 0.97 | 0.97 | 0.97 |
| my5651_rel_native_lto.cy10_ua4 | 0.99 | 1.02 | 0.66 | 0.91 | 1.01 | 1.01 |
This lists the average rate of inserts/s for the tests that do inserts concurrent with queries. For such tests the query rate is listed in the table above. The read+write tests are setup so that the insert rate should match the target rate every second. Cells that are not at least 95% of the target have a red background to indicate a failure to satisfy the target.
| dbms | q100.1 | q500.1 | q1000.1 |
|---|---|---|---|
| my5651_rel_native_lto.cy10_u | 2380 | 8241 | 7842 |
| my5651_rel_native_lto.cy10_ua1 | 2380 | 8560 | 8461 |
| my5651_rel_native_lto.cy10_ua2 | 2380 | 7828 | 7406 |
| my5651_rel_native_lto.cy10_ua4 | 2376 | 6320 | 5732 |
| target | 2400 | 12000 | 24000 |
l.i0
l.i0: load without secondary indexes. Graphs for performance per 1-second interval are here.
Average throughput:
Insert response time histogram: each cell has the percentage of responses that take <= the time in the header and max is the max response time in seconds. For the max column values in the top 25% of the range have a red background and in the bottom 25% of the range have a green background. The red background is not used when the min value is within 80% of the max value.
| dbms | 256us | 1ms | 4ms | 16ms | 64ms | 256ms | 1s | 4s | 16s | gt | max |
|---|---|---|---|---|---|---|---|---|---|---|---|
| my5651_rel_native_lto.cy10_u | 0.013 | 0.959 | 98.792 | 0.207 | 0.030 | nonzero | 0.278 | ||||
| my5651_rel_native_lto.cy10_ua1 | 0.013 | 1.547 | 98.190 | 0.215 | 0.034 | nonzero | 0.324 | ||||
| my5651_rel_native_lto.cy10_ua2 | 0.021 | 0.554 | 99.186 | 0.209 | 0.031 | nonzero | 0.258 | ||||
| my5651_rel_native_lto.cy10_ua4 | 0.013 | 0.706 | 99.059 | 0.191 | 0.030 | nonzero | 0.411 |
Performance metrics for the DBMS listed above. Some are normalized by throughput, others are not. Legend for results is here.
ips	qps	rps	rmbps	wps	wmbps	rpq	rkbpq	wpi	wkbpi	csps	cpups	cspq	cpupq	dbgb1	dbgb2	rss	maxop	p50	p99	tag
368562	0	2461	9.6	2459.7	104.5	0.007	0.027	0.007	0.290	91009	36.7	0.247	80	789.3	917.8	215.3	0.278	15085	13387	12000m.my5651_rel_native_lto.cy10_u
373169	0	2342	9.2	1149.2	98.6	0.006	0.025	0.003	0.271	86728	36.9	0.232	79	789.3	917.8	215.3	0.324	15085	13387	12000m.my5651_rel_native_lto.cy10_ua1
360133	0	2473	9.7	2400.4	101.9	0.007	0.027	0.007	0.290	89832	36.5	0.249	81	789.3	917.8	215.3	0.258	14785	13087	12000m.my5651_rel_native_lto.cy10_ua2
364133	0	2424	9.5	1167.3	90.9	0.007	0.027	0.003	0.256	94709	36.8	0.260	81	789.3	917.8	214.7	0.411	14884	13187	12000m.my5651_rel_native_lto.cy10_ua4
l.x
l.x: create secondary indexes.
Average throughput:
Performance metrics for the DBMS listed above. Some are normalized by throughput, others are not. Legend for results is here.
ips	qps	rps	rmbps	wps	wmbps	rpq	rkbpq	wpi	wkbpi	csps	cpups	cspq	cpupq	dbgb1	dbgb2	rss	maxop	p50	p99	tag
311999	0	4488	263.5	18406.4	682.2	0.014	0.865	0.059	2.239	96216	31.1	0.308	80	1626.5	1755.0	215.5	0.002	NA	NA	12000m.my5651_rel_native_lto.cy10_u
312429	0	3401	270.3	15651.0	654.8	0.011	0.886	0.050	2.146	90163	31.0	0.289	79	1626.5	1755.0	215.5	0.002	NA	NA	12000m.my5651_rel_native_lto.cy10_ua1
307269	0	4412	263.7	18305.1	675.8	0.014	0.879	0.060	2.252	95319	31.0	0.310	81	1626.5	1755.0	215.5	0.003	NA	NA	12000m.my5651_rel_native_lto.cy10_ua2
317648	0	3308	276.2	15524.2	616.4	0.010	0.890	0.049	1.987	123033	31.1	0.387	78	1626.5	1755.0	214.9	0.002	NA	NA	12000m.my5651_rel_native_lto.cy10_ua4
l.i1
l.i1: continue load after secondary indexes created. Graphs for performance per 1-second interval are here.
Average throughput:
Insert response time histogram: each cell has the percentage of responses that take <= the time in the header and max is the max response time in seconds. For the max column values in the top 25% of the range have a red background and in the bottom 25% of the range have a green background. The red background is not used when the min value is within 80% of the max value.
| dbms | 256us | 1ms | 4ms | 16ms | 64ms | 256ms | 1s | 4s | 16s | gt | max |
|---|---|---|---|---|---|---|---|---|---|---|---|
| my5651_rel_native_lto.cy10_u | 0.628 | 75.542 | 22.624 | 1.206 | 0.001 | 2.027 | |||||
| my5651_rel_native_lto.cy10_ua1 | nonzero | 0.600 | 74.737 | 23.348 | 1.314 | 0.001 | 1.887 | ||||
| my5651_rel_native_lto.cy10_ua2 | 0.418 | 75.771 | 22.616 | 1.194 | 0.001 | 1.994 | |||||
| my5651_rel_native_lto.cy10_ua4 | 0.001 | 0.525 | 63.493 | 27.605 | 8.376 | 0.001 | 1.819 |
Delete response time histogram: each cell has the percentage of responses that take <= the time in the header and max is the max response time in seconds. For the max column values in the top 25% of the range have a red background and in the bottom 25% of the range have a green background. The red background is not used when the min value is within 80% of the max value.
| dbms | 256us | 1ms | 4ms | 16ms | 64ms | 256ms | 1s | 4s | 16s | gt | max |
|---|---|---|---|---|---|---|---|---|---|---|---|
| my5651_rel_native_lto.cy10_u | 0.004 | 13.024 | 86.742 | 0.229 | 0.001 | nonzero | 1.489 | ||||
| my5651_rel_native_lto.cy10_ua1 | 0.004 | 15.477 | 84.340 | 0.178 | 0.001 | nonzero | 1.265 | ||||
| my5651_rel_native_lto.cy10_ua2 | 0.003 | 12.629 | 87.137 | 0.230 | 0.001 | nonzero | 1.442 | ||||
| my5651_rel_native_lto.cy10_ua4 | 0.280 | 19.483 | 79.212 | 1.023 | 0.001 | nonzero | 1.183 |
Performance metrics for the DBMS listed above. Some are normalized by throughput, others are not. Legend for results is here.
ips	qps	rps	rmbps	wps	wmbps	rpq	rkbpq	wpi	wkbpi	csps	cpups	cspq	cpupq	dbgb1	dbgb2	rss	maxop	p50	p99	tag
20154	0	33465	515.2	74876.8	1529.0	1.660	26.175	3.715	77.685	361156	36.0	17.919	1429	2419.6	2615.4	215.5	2.027	849	150	12000m.my5651_rel_native_lto.cy10_u
19750	0	33012	512.1	72032.3	1508.7	1.672	26.551	3.647	78.225	395899	36.6	20.046	1483	2419.2	2614.8	215.6	1.887	799	150	12000m.my5651_rel_native_lto.cy10_ua1
20084	0	33370	513.7	74636.8	1525.0	1.662	26.189	3.716	77.753	360024	36.3	17.926	1446	2419.5	2615.6	215.6	1.994	849	150	12000m.my5651_rel_native_lto.cy10_ua2
13302	0	24068	607.4	50254.1	983.5	1.809	46.760	3.778	75.712	644219	30.7	48.429	1846	2420.7	2616.5	214.9	1.819	300	100	12000m.my5651_rel_native_lto.cy10_ua4
q100.1
q100.1: range queries with 100 insert/s per client. Graphs for performance per 1-second interval are here.
Average throughput:
Query response time histogram: each cell has the percentage of responses that take <= the time in the header and max is the max response time in seconds. For max values in the top 25% of the range have a red background and in the bottom 25% of the range have a green background. The red background is not used when the min value is within 80% of the max value.
| dbms | 256us | 1ms | 4ms | 16ms | 64ms | 256ms | 1s | 4s | 16s | gt | max |
|---|---|---|---|---|---|---|---|---|---|---|---|
| my5651_rel_native_lto.cy10_u | 28.981 | 9.157 | 29.691 | 25.124 | 6.440 | 0.604 | 0.003 | 0.476 | |||
| my5651_rel_native_lto.cy10_ua1 | 28.860 | 9.289 | 29.642 | 25.247 | 6.379 | 0.580 | 0.003 | 0.589 | |||
| my5651_rel_native_lto.cy10_ua2 | 29.074 | 9.043 | 29.632 | 24.894 | 6.681 | 0.672 | 0.004 | 0.519 | |||
| my5651_rel_native_lto.cy10_ua4 | 26.242 | 11.782 | 25.969 | 28.019 | 7.341 | 0.645 | 0.002 | 0.742 |
Insert response time histogram: each cell has the percentage of responses that take <= the time in the header and max is the max response time in seconds. For max values in the top 25% of the range have a red background and in the bottom 25% of the range have a green background. The red background is not used when the min value is within 80% of the max value.
| dbms | 256us | 1ms | 4ms | 16ms | 64ms | 256ms | 1s | 4s | 16s | gt | max |
|---|---|---|---|---|---|---|---|---|---|---|---|
| my5651_rel_native_lto.cy10_u | 4.842 | 38.807 | 37.060 | 19.291 | 0.763 | ||||||
| my5651_rel_native_lto.cy10_ua1 | 0.001 | 6.244 | 36.166 | 40.097 | 17.493 | 0.797 | |||||
| my5651_rel_native_lto.cy10_ua2 | 4.951 | 37.000 | 38.841 | 19.208 | 0.668 | ||||||
| my5651_rel_native_lto.cy10_ua4 | 1.277 | 35.323 | 53.803 | 9.597 | 0.803 |
Delete response time histogram: each cell has the percentage of responses that take <= the time in the header and max is the max response time in seconds. For max values in the top 25% of the range have a red background and in the bottom 25% of the range have a green background. The red background is not used when the min value is within 80% of the max value.
| dbms | 256us | 1ms | 4ms | 16ms | 64ms | 256ms | 1s | 4s | 16s | gt | max |
|---|---|---|---|---|---|---|---|---|---|---|---|
| my5651_rel_native_lto.cy10_u | 0.001 | 7.219 | 37.856 | 36.747 | 18.177 | 0.635 | |||||
| my5651_rel_native_lto.cy10_ua1 | 0.001 | 9.383 | 34.466 | 39.898 | 16.252 | 0.788 | |||||
| my5651_rel_native_lto.cy10_ua2 | 0.001 | 7.635 | 35.841 | 38.460 | 18.063 | 0.630 | |||||
| my5651_rel_native_lto.cy10_ua4 | 0.002 | 2.415 | 37.305 | 51.631 | 8.647 | 0.556 |
Performance metrics for the DBMS listed above. Some are normalized by throughput, others are not. Legend for results is here.
ips	qps	rps	rmbps	wps	wmbps	rpq	rkbpq	wpi	wkbpi	csps	cpups	cspq	cpupq	dbgb1	dbgb2	rss	maxop	p50	p99	tag
2380	4660	29995	467.7	24786.3	480.4	6.437	102.785	10.414	206.692	257481	31.7	55.255	5442	2419.6	2615.4	215.6	0.476	208	144	12000m.my5651_rel_native_lto.cy10_u
2380	4698	29777	471.1	24263.8	479.8	6.338	102.694	10.194	206.424	255028	31.5	54.286	5364	2419.2	2614.8	215.6	0.589	208	144	12000m.my5651_rel_native_lto.cy10_ua1
2380	4537	29239	455.9	24141.3	473.2	6.445	102.905	10.146	203.658	254919	31.6	56.190	5572	2419.5	2615.6	215.6	0.519	192	128	12000m.my5651_rel_native_lto.cy10_ua2
2376	4233	27584	1038.6	21080.3	435.1	6.516	251.235	8.871	187.506	357912	33.9	84.549	6406	2420.7	2616.5	214.9	0.742	192	128	12000m.my5651_rel_native_lto.cy10_ua4
q500.1
q500.1: range queries with 500 insert/s per client. Graphs for performance per 1-second interval are here.
Average throughput:

Query response time histogram: each cell has the percentage of responses that take <= the time in the header and max is the max response time in seconds. For max values in the top 25% of the range have a red background and in the bottom 25% of the range have a green background. The red background is not used when the min value is within 80% of the max value.
| dbms | 256us | 1ms | 4ms | 16ms | 64ms | 256ms | 1s | 4s | 16s | gt | max |
|---|---|---|---|---|---|---|---|---|---|---|---|
| my5651_rel_native_lto.cy10_u | 18.191 | 18.267 | 27.889 | 25.447 | 10.080 | 0.126 | nonzero | 0.289 | |||
| my5651_rel_native_lto.cy10_ua1 | 17.656 | 18.854 | 27.983 | 25.620 | 9.771 | 0.118 | nonzero | 0.282 | |||
| my5651_rel_native_lto.cy10_ua2 | 18.099 | 18.226 | 27.753 | 25.062 | 10.704 | 0.156 | nonzero | 0.360 | |||
| my5651_rel_native_lto.cy10_ua4 | 16.595 | 19.961 | 25.738 | 27.705 | 9.918 | 0.083 | nonzero | 0.324 |
Insert response time histogram: each cell has the percentage of responses that take <= the time in the header and max is the max response time in seconds. For max values in the top 25% of the range have a red background and in the bottom 25% of the range have a green background. The red background is not used when the min value is within 80% of the max value.
| dbms | 256us | 1ms | 4ms | 16ms | 64ms | 256ms | 1s | 4s | 16s | gt | max |
|---|---|---|---|---|---|---|---|---|---|---|---|
| my5651_rel_native_lto.cy10_u | 0.002 | 0.184 | 32.079 | 50.520 | 17.214 | 0.753 | |||||
| my5651_rel_native_lto.cy10_ua1 | 0.001 | 0.208 | 34.058 | 50.209 | 15.523 | 0.717 | |||||
| my5651_rel_native_lto.cy10_ua2 | 0.001 | 0.128 | 30.988 | 48.354 | 20.530 | 0.679 | |||||
| my5651_rel_native_lto.cy10_ua4 | nonzero | 0.131 | 0.788 | 81.060 | 18.021 | 0.758 |
Delete response time histogram: each cell has the percentage of responses that take <= the time in the header and max is the max response time in seconds. For max values in the top 25% of the range have a red background and in the bottom 25% of the range have a green background. The red background is not used when the min value is within 80% of the max value.
| dbms | 256us | 1ms | 4ms | 16ms | 64ms | 256ms | 1s | 4s | 16s | gt | max |
|---|---|---|---|---|---|---|---|---|---|---|---|
| my5651_rel_native_lto.cy10_u | 0.006 | 0.214 | 33.492 | 50.733 | 15.555 | 0.652 | |||||
| my5651_rel_native_lto.cy10_ua1 | 0.001 | 0.256 | 35.551 | 50.364 | 13.828 | 0.731 | |||||
| my5651_rel_native_lto.cy10_ua2 | 0.002 | 0.162 | 32.436 | 48.584 | 18.815 | 0.650 | |||||
| my5651_rel_native_lto.cy10_ua4 | 0.001 | 0.183 | 0.817 | 82.578 | 16.421 | 0.761 |
Performance metrics for the DBMS listed above. Some are normalized by throughput, others are not. Legend for results is here.
ips	qps	rps	rmbps	wps	wmbps	rpq	rkbpq	wpi	wkbpi	csps	cpups	cspq	cpupq	dbgb1	dbgb2	rss	maxop	p50	p99	tag
8241	4236	25780	399.8	15114.7	361.9	6.086	96.628	1.834	44.966	298639	49.4	70.495	9329	2428.2	2626.6	215.6	0.289	176	128	12000m.my5651_rel_native_lto.cy10_u
8560	4312	25968	407.7	15393.5	371.1	6.023	96.835	1.798	44.390	298581	49.7	69.247	9221	2428.0	2626.3	215.6	0.282	176	128	12000m.my5651_rel_native_lto.cy10_ua1
7828	4092	24856	385.4	13885.7	348.2	6.074	96.433	1.774	45.558	293081	48.5	71.614	9481	2428.4	2627.2	215.6	0.360	176	128	12000m.my5651_rel_native_lto.cy10_ua2
6320	4258	25650	980.8	10715.6	307.0	6.024	235.871	1.695	49.746	348870	51.0	81.929	9582	2428.9	2627.7	214.9	0.324	176	144	12000m.my5651_rel_native_lto.cy10_ua4
q1000.1
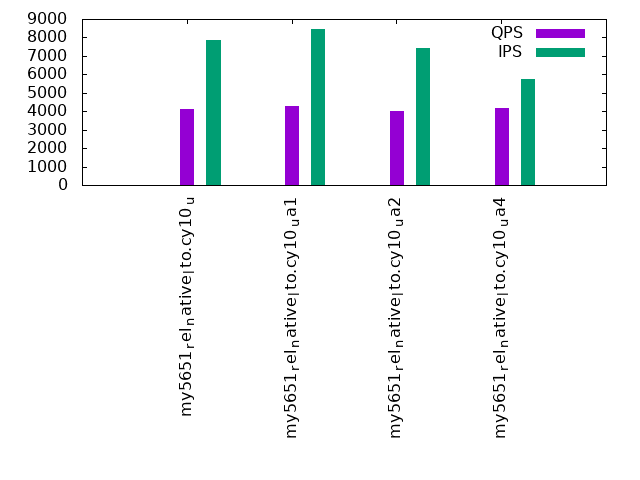
q1000.1: range queries with 1000 insert/s per client. Graphs for performance per 1-second interval are here.
Average throughput:
Query response time histogram: each cell has the percentage of responses that take <= the time in the header and max is the max response time in seconds. For max values in the top 25% of the range have a red background and in the bottom 25% of the range have a green background. The red background is not used when the min value is within 80% of the max value.
| dbms | 256us | 1ms | 4ms | 16ms | 64ms | 256ms | 1s | 4s | 16s | gt | max |
|---|---|---|---|---|---|---|---|---|---|---|---|
| my5651_rel_native_lto.cy10_u | 18.204 | 18.972 | 27.816 | 24.665 | 10.115 | 0.223 | 0.005 | 0.912 | |||
| my5651_rel_native_lto.cy10_ua1 | 17.864 | 19.499 | 27.914 | 24.960 | 9.548 | 0.207 | 0.007 | nonzero | 1.716 | ||
| my5651_rel_native_lto.cy10_ua2 | 18.126 | 18.889 | 27.736 | 24.319 | 10.664 | 0.261 | 0.005 | 0.980 | |||
| my5651_rel_native_lto.cy10_ua4 | 15.826 | 21.049 | 25.214 | 27.457 | 10.384 | 0.069 | nonzero | 0.611 |
Insert response time histogram: each cell has the percentage of responses that take <= the time in the header and max is the max response time in seconds. For max values in the top 25% of the range have a red background and in the bottom 25% of the range have a green background. The red background is not used when the min value is within 80% of the max value.
| dbms | 256us | 1ms | 4ms | 16ms | 64ms | 256ms | 1s | 4s | 16s | gt | max |
|---|---|---|---|---|---|---|---|---|---|---|---|
| my5651_rel_native_lto.cy10_u | 0.002 | 0.115 | 33.398 | 46.209 | 20.274 | 0.002 | 1.726 | ||||
| my5651_rel_native_lto.cy10_ua1 | nonzero | 0.103 | 37.288 | 45.516 | 17.070 | 0.022 | 1.993 | ||||
| my5651_rel_native_lto.cy10_ua2 | nonzero | 0.092 | 32.186 | 44.200 | 23.519 | 0.003 | 1.234 | ||||
| my5651_rel_native_lto.cy10_ua4 | nonzero | 0.068 | 0.525 | 74.243 | 25.163 | 0.869 |
Delete response time histogram: each cell has the percentage of responses that take <= the time in the header and max is the max response time in seconds. For max values in the top 25% of the range have a red background and in the bottom 25% of the range have a green background. The red background is not used when the min value is within 80% of the max value.
| dbms | 256us | 1ms | 4ms | 16ms | 64ms | 256ms | 1s | 4s | 16s | gt | max |
|---|---|---|---|---|---|---|---|---|---|---|---|
| my5651_rel_native_lto.cy10_u | 0.002 | 0.124 | 33.836 | 45.965 | 20.072 | 0.001 | 1.343 | ||||
| my5651_rel_native_lto.cy10_ua1 | nonzero | 0.115 | 37.759 | 45.219 | 16.901 | 0.007 | 1.793 | ||||
| my5651_rel_native_lto.cy10_ua2 | 0.001 | 0.100 | 32.594 | 44.141 | 23.164 | 0.001 | 1.324 | ||||
| my5651_rel_native_lto.cy10_ua4 | nonzero | 0.078 | 0.547 | 73.677 | 25.697 | 0.829 |
Performance metrics for the DBMS listed above. Some are normalized by throughput, others are not. Legend for results is here.
ips	qps	rps	rmbps	wps	wmbps	rpq	rkbpq	wpi	wkbpi	csps	cpups	cspq	cpupq	dbgb1	dbgb2	rss	maxop	p50	p99	tag
7842	4143	25372	393.5	15645.3	368.8	6.124	97.267	1.995	48.151	316147	51.9	76.311	10022	2438.7	2644.4	215.6	0.912	176	112	12000m.my5651_rel_native_lto.cy10_u
8461	4265	25379	406.7	16489.2	386.7	5.950	97.646	1.949	46.803	317994	52.5	74.559	9848	2438.7	2644.5	215.6	1.716	176	112	12000m.my5651_rel_native_lto.cy10_ua1
7406	4009	24506	380.1	14274.8	352.9	6.113	97.084	1.927	48.796	309335	50.8	77.158	10137	2438.7	2643.6	215.6	0.980	160	112	12000m.my5651_rel_native_lto.cy10_ua2
5732	4190	25401	985.0	10436.6	304.4	6.062	240.714	1.821	54.390	356738	52.1	85.134	9947	2438.7	2644.0	214.9	0.611	176	128	12000m.my5651_rel_native_lto.cy10_ua4
l.i0
l.i0: load without secondary indexes
Performance metrics for all DBMS, not just the ones listed above. Some are normalized by throughput, others are not. Legend for results is here.
ips	qps	rps	rmbps	wps	wmbps	rpq	rkbpq	wpi	wkbpi	csps	cpups	cspq	cpupq	dbgb1	dbgb2	rss	maxop	p50	p99	tag
368562	0	2461	9.6	2459.7	104.5	0.007	0.027	0.007	0.290	91009	36.7	0.247	80	789.3	917.8	215.3	0.278	15085	13387	12000m.my5651_rel_native_lto.cy10_u
373169	0	2342	9.2	1149.2	98.6	0.006	0.025	0.003	0.271	86728	36.9	0.232	79	789.3	917.8	215.3	0.324	15085	13387	12000m.my5651_rel_native_lto.cy10_ua1
360133	0	2473	9.7	2400.4	101.9	0.007	0.027	0.007	0.290	89832	36.5	0.249	81	789.3	917.8	215.3	0.258	14785	13087	12000m.my5651_rel_native_lto.cy10_ua2
364133	0	2424	9.5	1167.3	90.9	0.007	0.027	0.003	0.256	94709	36.8	0.260	81	789.3	917.8	214.7	0.411	14884	13187	12000m.my5651_rel_native_lto.cy10_ua4
l.x
l.x: create secondary indexes
Performance metrics for all DBMS, not just the ones listed above. Some are normalized by throughput, others are not. Legend for results is here.
ips	qps	rps	rmbps	wps	wmbps	rpq	rkbpq	wpi	wkbpi	csps	cpups	cspq	cpupq	dbgb1	dbgb2	rss	maxop	p50	p99	tag
311999	0	4488	263.5	18406.4	682.2	0.014	0.865	0.059	2.239	96216	31.1	0.308	80	1626.5	1755.0	215.5	0.002	NA	NA	12000m.my5651_rel_native_lto.cy10_u
312429	0	3401	270.3	15651.0	654.8	0.011	0.886	0.050	2.146	90163	31.0	0.289	79	1626.5	1755.0	215.5	0.002	NA	NA	12000m.my5651_rel_native_lto.cy10_ua1
307269	0	4412	263.7	18305.1	675.8	0.014	0.879	0.060	2.252	95319	31.0	0.310	81	1626.5	1755.0	215.5	0.003	NA	NA	12000m.my5651_rel_native_lto.cy10_ua2
317648	0	3308	276.2	15524.2	616.4	0.010	0.890	0.049	1.987	123033	31.1	0.387	78	1626.5	1755.0	214.9	0.002	NA	NA	12000m.my5651_rel_native_lto.cy10_ua4
l.i1
l.i1: continue load after secondary indexes created
Performance metrics for all DBMS, not just the ones listed above. Some are normalized by throughput, others are not. Legend for results is here.
ips	qps	rps	rmbps	wps	wmbps	rpq	rkbpq	wpi	wkbpi	csps	cpups	cspq	cpupq	dbgb1	dbgb2	rss	maxop	p50	p99	tag
20154	0	33465	515.2	74876.8	1529.0	1.660	26.175	3.715	77.685	361156	36.0	17.919	1429	2419.6	2615.4	215.5	2.027	849	150	12000m.my5651_rel_native_lto.cy10_u
19750	0	33012	512.1	72032.3	1508.7	1.672	26.551	3.647	78.225	395899	36.6	20.046	1483	2419.2	2614.8	215.6	1.887	799	150	12000m.my5651_rel_native_lto.cy10_ua1
20084	0	33370	513.7	74636.8	1525.0	1.662	26.189	3.716	77.753	360024	36.3	17.926	1446	2419.5	2615.6	215.6	1.994	849	150	12000m.my5651_rel_native_lto.cy10_ua2
13302	0	24068	607.4	50254.1	983.5	1.809	46.760	3.778	75.712	644219	30.7	48.429	1846	2420.7	2616.5	214.9	1.819	300	100	12000m.my5651_rel_native_lto.cy10_ua4
q100.1
q100.1: range queries with 100 insert/s per client
Performance metrics for all DBMS, not just the ones listed above. Some are normalized by throughput, others are not. Legend for results is here.
ips	qps	rps	rmbps	wps	wmbps	rpq	rkbpq	wpi	wkbpi	csps	cpups	cspq	cpupq	dbgb1	dbgb2	rss	maxop	p50	p99	tag
2380	4660	29995	467.7	24786.3	480.4	6.437	102.785	10.414	206.692	257481	31.7	55.255	5442	2419.6	2615.4	215.6	0.476	208	144	12000m.my5651_rel_native_lto.cy10_u
2380	4698	29777	471.1	24263.8	479.8	6.338	102.694	10.194	206.424	255028	31.5	54.286	5364	2419.2	2614.8	215.6	0.589	208	144	12000m.my5651_rel_native_lto.cy10_ua1
2380	4537	29239	455.9	24141.3	473.2	6.445	102.905	10.146	203.658	254919	31.6	56.190	5572	2419.5	2615.6	215.6	0.519	192	128	12000m.my5651_rel_native_lto.cy10_ua2
2376	4233	27584	1038.6	21080.3	435.1	6.516	251.235	8.871	187.506	357912	33.9	84.549	6406	2420.7	2616.5	214.9	0.742	192	128	12000m.my5651_rel_native_lto.cy10_ua4
q500.1
q500.1: range queries with 500 insert/s per client
Performance metrics for all DBMS, not just the ones listed above. Some are normalized by throughput, others are not. Legend for results is here.
ips	qps	rps	rmbps	wps	wmbps	rpq	rkbpq	wpi	wkbpi	csps	cpups	cspq	cpupq	dbgb1	dbgb2	rss	maxop	p50	p99	tag
8241	4236	25780	399.8	15114.7	361.9	6.086	96.628	1.834	44.966	298639	49.4	70.495	9329	2428.2	2626.6	215.6	0.289	176	128	12000m.my5651_rel_native_lto.cy10_u
8560	4312	25968	407.7	15393.5	371.1	6.023	96.835	1.798	44.390	298581	49.7	69.247	9221	2428.0	2626.3	215.6	0.282	176	128	12000m.my5651_rel_native_lto.cy10_ua1
7828	4092	24856	385.4	13885.7	348.2	6.074	96.433	1.774	45.558	293081	48.5	71.614	9481	2428.4	2627.2	215.6	0.360	176	128	12000m.my5651_rel_native_lto.cy10_ua2
6320	4258	25650	980.8	10715.6	307.0	6.024	235.871	1.695	49.746	348870	51.0	81.929	9582	2428.9	2627.7	214.9	0.324	176	144	12000m.my5651_rel_native_lto.cy10_ua4
q1000.1
q1000.1: range queries with 1000 insert/s per client
Performance metrics for all DBMS, not just the ones listed above. Some are normalized by throughput, others are not. Legend for results is here.
ips	qps	rps	rmbps	wps	wmbps	rpq	rkbpq	wpi	wkbpi	csps	cpups	cspq	cpupq	dbgb1	dbgb2	rss	maxop	p50	p99	tag
7842	4143	25372	393.5	15645.3	368.8	6.124	97.267	1.995	48.151	316147	51.9	76.311	10022	2438.7	2644.4	215.6	0.912	176	112	12000m.my5651_rel_native_lto.cy10_u
8461	4265	25379	406.7	16489.2	386.7	5.950	97.646	1.949	46.803	317994	52.5	74.559	9848	2438.7	2644.5	215.6	1.716	176	112	12000m.my5651_rel_native_lto.cy10_ua1
7406	4009	24506	380.1	14274.8	352.9	6.113	97.084	1.927	48.796	309335	50.8	77.158	10137	2438.7	2643.6	215.6	0.980	160	112	12000m.my5651_rel_native_lto.cy10_ua2
5732	4190	25401	985.0	10436.6	304.4	6.062	240.714	1.821	54.390	356738	52.1	85.134	9947	2438.7	2644.0	214.9	0.611	176	128	12000m.my5651_rel_native_lto.cy10_ua4
l.i0
- l.i0: load without secondary indexes
- Legend for results is here.
- Each entry lists the percentage of responses that fit in that bucket (slower than max time for previous bucket, faster than min time for next bucket).
Insert response time histogram
256us	1ms	4ms	16ms	64ms	256ms	1s	4s	16s	gt	max	tag
0.000	0.013	0.959	98.792	0.207	0.030	nonzero	0.000	0.000	0.000	0.278	my5651_rel_native_lto.cy10_u
0.000	0.013	1.547	98.190	0.215	0.034	nonzero	0.000	0.000	0.000	0.324	my5651_rel_native_lto.cy10_ua1
0.000	0.021	0.554	99.186	0.209	0.031	nonzero	0.000	0.000	0.000	0.258	my5651_rel_native_lto.cy10_ua2
0.000	0.013	0.706	99.059	0.191	0.030	nonzero	0.000	0.000	0.000	0.411	my5651_rel_native_lto.cy10_ua4
l.x
- l.x: create secondary indexes
- Legend for results is here.
- Each entry lists the percentage of responses that fit in that bucket (slower than max time for previous bucket, faster than min time for next bucket).
TODO - determine whether there is data for create index response time
l.i1
- l.i1: continue load after secondary indexes created
- Legend for results is here.
- Each entry lists the percentage of responses that fit in that bucket (slower than max time for previous bucket, faster than min time for next bucket).
Insert response time histogram
256us	1ms	4ms	16ms	64ms	256ms	1s	4s	16s	gt	max	tag
0.000	0.000	0.000	0.628	75.542	22.624	1.206	0.001	0.000	0.000	2.027	my5651_rel_native_lto.cy10_u
0.000	0.000	nonzero	0.600	74.737	23.348	1.314	0.001	0.000	0.000	1.887	my5651_rel_native_lto.cy10_ua1
0.000	0.000	0.000	0.418	75.771	22.616	1.194	0.001	0.000	0.000	1.994	my5651_rel_native_lto.cy10_ua2
0.000	0.000	0.001	0.525	63.493	27.605	8.376	0.001	0.000	0.000	1.819	my5651_rel_native_lto.cy10_ua4
Delete response time histogram
256us	1ms	4ms	16ms	64ms	256ms	1s	4s	16s	gt	max	tag
0.000	0.000	0.004	13.024	86.742	0.229	0.001	nonzero	0.000	0.000	1.489	my5651_rel_native_lto.cy10_u
0.000	0.000	0.004	15.477	84.340	0.178	0.001	nonzero	0.000	0.000	1.265	my5651_rel_native_lto.cy10_ua1
0.000	0.000	0.003	12.629	87.137	0.230	0.001	nonzero	0.000	0.000	1.442	my5651_rel_native_lto.cy10_ua2
0.000	0.000	0.280	19.483	79.212	1.023	0.001	nonzero	0.000	0.000	1.183	my5651_rel_native_lto.cy10_ua4
q100.1
- q100.1: range queries with 100 insert/s per client
- Legend for results is here.
- Each entry lists the percentage of responses that fit in that bucket (slower than max time for previous bucket, faster than min time for next bucket).
Query response time histogram
256us	1ms	4ms	16ms	64ms	256ms	1s	4s	16s	gt	max	tag
28.981	9.157	29.691	25.124	6.440	0.604	0.003	0.000	0.000	0.000	0.476	my5651_rel_native_lto.cy10_u
28.860	9.289	29.642	25.247	6.379	0.580	0.003	0.000	0.000	0.000	0.589	my5651_rel_native_lto.cy10_ua1
29.074	9.043	29.632	24.894	6.681	0.672	0.004	0.000	0.000	0.000	0.519	my5651_rel_native_lto.cy10_ua2
26.242	11.782	25.969	28.019	7.341	0.645	0.002	0.000	0.000	0.000	0.742	my5651_rel_native_lto.cy10_ua4
Insert response time histogram
256us	1ms	4ms	16ms	64ms	256ms	1s	4s	16s	gt	max	tag
0.000	0.000	0.000	4.842	38.807	37.060	19.291	0.000	0.000	0.000	0.763	my5651_rel_native_lto.cy10_u
0.000	0.000	0.001	6.244	36.166	40.097	17.493	0.000	0.000	0.000	0.797	my5651_rel_native_lto.cy10_ua1
0.000	0.000	0.000	4.951	37.000	38.841	19.208	0.000	0.000	0.000	0.668	my5651_rel_native_lto.cy10_ua2
0.000	0.000	0.000	1.277	35.323	53.803	9.597	0.000	0.000	0.000	0.803	my5651_rel_native_lto.cy10_ua4
Delete response time histogram
256us	1ms	4ms	16ms	64ms	256ms	1s	4s	16s	gt	max	tag
0.000	0.000	0.001	7.219	37.856	36.747	18.177	0.000	0.000	0.000	0.635	my5651_rel_native_lto.cy10_u
0.000	0.000	0.001	9.383	34.466	39.898	16.252	0.000	0.000	0.000	0.788	my5651_rel_native_lto.cy10_ua1
0.000	0.000	0.001	7.635	35.841	38.460	18.063	0.000	0.000	0.000	0.630	my5651_rel_native_lto.cy10_ua2
0.000	0.000	0.002	2.415	37.305	51.631	8.647	0.000	0.000	0.000	0.556	my5651_rel_native_lto.cy10_ua4
q500.1
- q500.1: range queries with 500 insert/s per client
- Legend for results is here.
- Each entry lists the percentage of responses that fit in that bucket (slower than max time for previous bucket, faster than min time for next bucket).
Query response time histogram
256us	1ms	4ms	16ms	64ms	256ms	1s	4s	16s	gt	max	tag
18.191	18.267	27.889	25.447	10.080	0.126	nonzero	0.000	0.000	0.000	0.289	my5651_rel_native_lto.cy10_u
17.656	18.854	27.983	25.620	9.771	0.118	nonzero	0.000	0.000	0.000	0.282	my5651_rel_native_lto.cy10_ua1
18.099	18.226	27.753	25.062	10.704	0.156	nonzero	0.000	0.000	0.000	0.360	my5651_rel_native_lto.cy10_ua2
16.595	19.961	25.738	27.705	9.918	0.083	nonzero	0.000	0.000	0.000	0.324	my5651_rel_native_lto.cy10_ua4
Insert response time histogram
256us	1ms	4ms	16ms	64ms	256ms	1s	4s	16s	gt	max	tag
0.000	0.000	0.002	0.184	32.079	50.520	17.214	0.000	0.000	0.000	0.753	my5651_rel_native_lto.cy10_u
0.000	0.000	0.001	0.208	34.058	50.209	15.523	0.000	0.000	0.000	0.717	my5651_rel_native_lto.cy10_ua1
0.000	0.000	0.001	0.128	30.988	48.354	20.530	0.000	0.000	0.000	0.679	my5651_rel_native_lto.cy10_ua2
0.000	0.000	nonzero	0.131	0.788	81.060	18.021	0.000	0.000	0.000	0.758	my5651_rel_native_lto.cy10_ua4
Delete response time histogram
256us	1ms	4ms	16ms	64ms	256ms	1s	4s	16s	gt	max	tag
0.000	0.000	0.006	0.214	33.492	50.733	15.555	0.000	0.000	0.000	0.652	my5651_rel_native_lto.cy10_u
0.000	0.000	0.001	0.256	35.551	50.364	13.828	0.000	0.000	0.000	0.731	my5651_rel_native_lto.cy10_ua1
0.000	0.000	0.002	0.162	32.436	48.584	18.815	0.000	0.000	0.000	0.650	my5651_rel_native_lto.cy10_ua2
0.000	0.000	0.001	0.183	0.817	82.578	16.421	0.000	0.000	0.000	0.761	my5651_rel_native_lto.cy10_ua4
q1000.1
- q1000.1: range queries with 1000 insert/s per client
- Legend for results is here.
- Each entry lists the percentage of responses that fit in that bucket (slower than max time for previous bucket, faster than min time for next bucket).
Query response time histogram
256us	1ms	4ms	16ms	64ms	256ms	1s	4s	16s	gt	max	tag
18.204	18.972	27.816	24.665	10.115	0.223	0.005	0.000	0.000	0.000	0.912	my5651_rel_native_lto.cy10_u
17.864	19.499	27.914	24.960	9.548	0.207	0.007	nonzero	0.000	0.000	1.716	my5651_rel_native_lto.cy10_ua1
18.126	18.889	27.736	24.319	10.664	0.261	0.005	0.000	0.000	0.000	0.980	my5651_rel_native_lto.cy10_ua2
15.826	21.049	25.214	27.457	10.384	0.069	nonzero	0.000	0.000	0.000	0.611	my5651_rel_native_lto.cy10_ua4
Insert response time histogram
256us	1ms	4ms	16ms	64ms	256ms	1s	4s	16s	gt	max	tag
0.000	0.000	0.002	0.115	33.398	46.209	20.274	0.002	0.000	0.000	1.726	my5651_rel_native_lto.cy10_u
0.000	0.000	nonzero	0.103	37.288	45.516	17.070	0.022	0.000	0.000	1.993	my5651_rel_native_lto.cy10_ua1
0.000	0.000	nonzero	0.092	32.186	44.200	23.519	0.003	0.000	0.000	1.234	my5651_rel_native_lto.cy10_ua2
0.000	0.000	nonzero	0.068	0.525	74.243	25.163	0.000	0.000	0.000	0.869	my5651_rel_native_lto.cy10_ua4
Delete response time histogram
256us	1ms	4ms	16ms	64ms	256ms	1s	4s	16s	gt	max	tag
0.000	0.000	0.002	0.124	33.836	45.965	20.072	0.001	0.000	0.000	1.343	my5651_rel_native_lto.cy10_u
0.000	0.000	nonzero	0.115	37.759	45.219	16.901	0.007	0.000	0.000	1.793	my5651_rel_native_lto.cy10_ua1
0.000	0.000	0.001	0.100	32.594	44.141	23.164	0.001	0.000	0.000	1.324	my5651_rel_native_lto.cy10_ua2
0.000	0.000	nonzero	0.078	0.547	73.677	25.697	0.000	0.000	0.000	0.829	my5651_rel_native_lto.cy10_ua4