Introduction
This is a report for the insert benchmark with 480M docs and 24 client(s). It is generated by scripts (bash, awk, sed) and Tufte might not be impressed. An overview of the insert benchmark is here and a short update is here. Below, by DBMS, I mean DBMS+version.config. An example is my8020.c10b40 where my means MySQL, 8020 is version 8.0.20 and c10b40 is the name for the configuration file.
The test server has 80 cores with hyperthreads enabled, 256G RAM and fast storage. The benchmark was run with 24 clients and there were 1 or 3 connections per client (1 for queries or inserts without rate limits, 1+1 for rate limited inserts+deletes). There are 24 tables, with a client per table. It loads 480M rows without secondary indexes, creates secondary indexes, then inserts 120M rows with a delete per insert to avoid growing the table. It then does 3 read+write tests for 3600s each that do queries as fast as possible with 100, 500 and then 1000 inserts/second/client concurrent with the queries and 1000 deletes/second to avoid growing the table. The database is cached by the OS but not by InnoDB.
The tested DBMS are:
- my5651_rel_native_lto.cy10_4g_u - InnoDB and MySQL 5.6.51, rel_native_lto build, cy10_4g_u config, compiled with CMAKE_BUILD_TYPE=Release
- my5651_rel_native_lto.cy10_4g_ua1 - InnoDB and MySQL 5.6.51, rel_native_lto build, cy10_4g_ua1 config, compiled with CMAKE_BUILD_TYPE=Release, adds innodb_use_native_aio=off
- my5651_rel_native_lto.cy10_4g_ua2 - InnoDB and MySQL 5.6.51, rel_native_lto build, cy10_4g_ua2 config, compiled with CMAKE_BUILD_TYPE=Release, adds innodb_io_capacity=20k, innodb_io_capacity_max=40k
Contents
- Summary
- l.i0: load without secondary indexes
- l.x: create secondary indexes
- l.i1: continue load after secondary indexes created
- q100.1: range queries with 100 insert/s per client
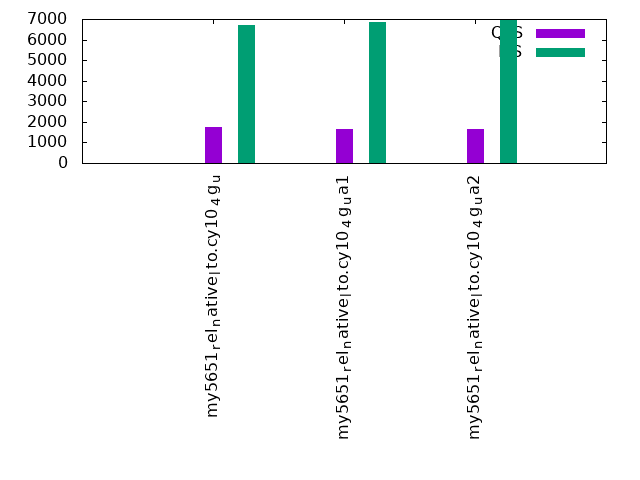
- q500.1: range queries with 500 insert/s per client
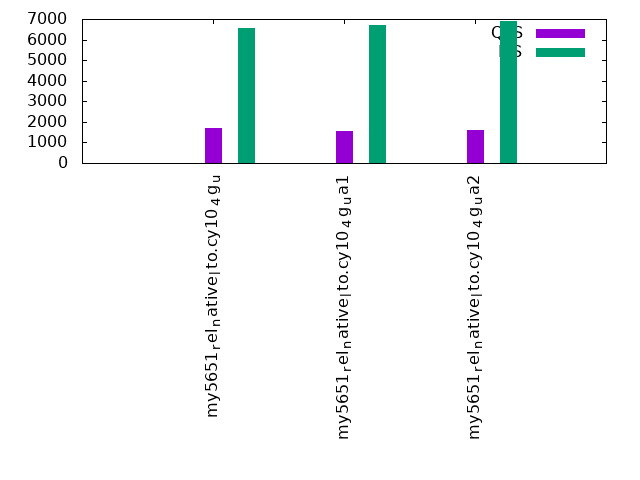
- q1000.1: range queries with 1000 insert/s per client
Summary
The numbers are inserts/s for l.i0 and l.i1, indexed docs (or rows) /s for l.x and queries/s for q*.2. The values are the average rate over the entire test for inserts (IPS) and queries (QPS). The range of values for IPS and QPS is split into 3 parts: bottom 25%, middle 50%, top 25%. Values in the bottom 25% have a red background, values in the top 25% have a green background and values in the middle have no color. A gray background is used for values that can be ignored because the DBMS did not sustain the target insert rate. Red backgrounds are not used when the minimum value is within 80% of the max value.
| dbms | l.i0 | l.x | l.i1 | q100.1 | q500.1 | q1000.1 |
|---|---|---|---|---|---|---|
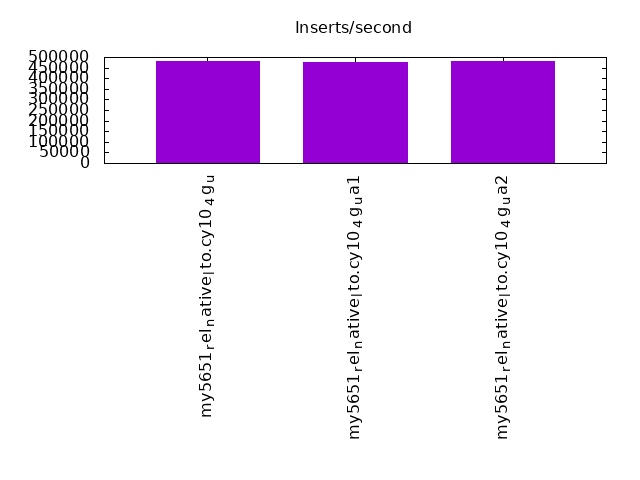
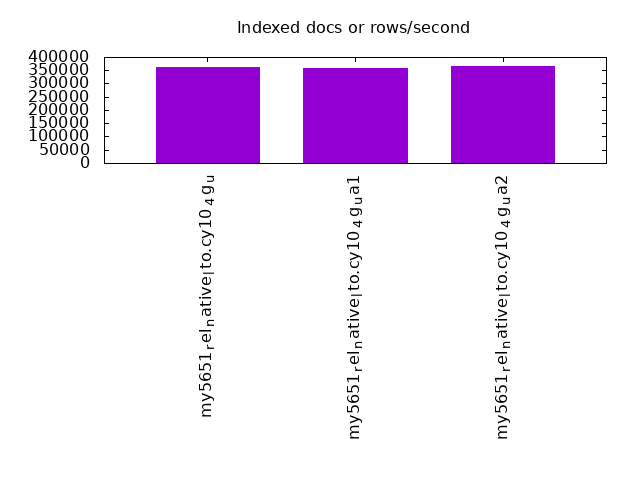
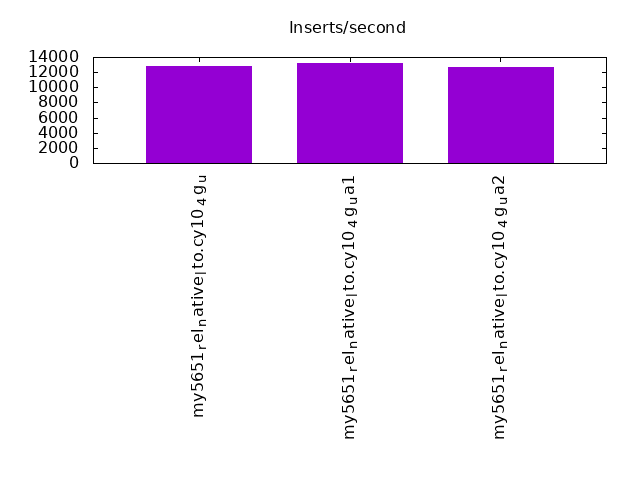
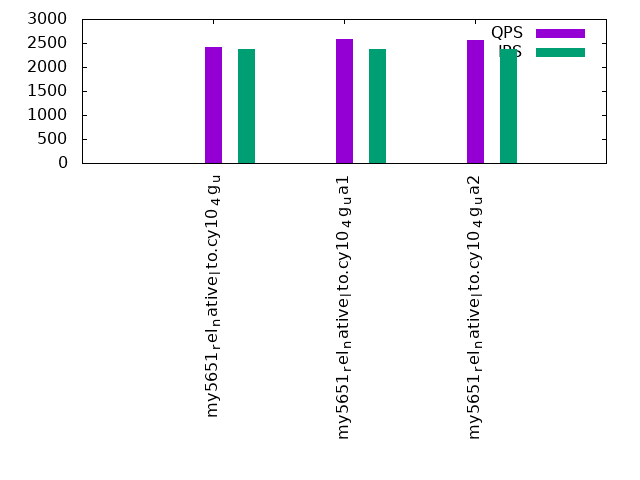
| my5651_rel_native_lto.cy10_4g_u | 480000 | 361521 | 12820 | 2422 | 1764 | 1704 |
| my5651_rel_native_lto.cy10_4g_ua1 | 476190 | 357217 | 13257 | 2581 | 1642 | 1576 |
| my5651_rel_native_lto.cy10_4g_ua2 | 482897 | 364264 | 12662 | 2553 | 1674 | 1606 |
This table has relative throughput, throughput for the DBMS relative to the DBMS in the first line, using the absolute throughput from the previous table. Values less than 0.95 have a yellow background. Values greater than 1.05 have a blue background.
| dbms | l.i0 | l.x | l.i1 | q100.1 | q500.1 | q1000.1 |
|---|---|---|---|---|---|---|
| my5651_rel_native_lto.cy10_4g_u | 1.00 | 1.00 | 1.00 | 1.00 | 1.00 | 1.00 |
| my5651_rel_native_lto.cy10_4g_ua1 | 0.99 | 0.99 | 1.03 | 1.07 | 0.93 | 0.92 |
| my5651_rel_native_lto.cy10_4g_ua2 | 1.01 | 1.01 | 0.99 | 1.05 | 0.95 | 0.94 |
This lists the average rate of inserts/s for the tests that do inserts concurrent with queries. For such tests the query rate is listed in the table above. The read+write tests are setup so that the insert rate should match the target rate every second. Cells that are not at least 95% of the target have a red background to indicate a failure to satisfy the target.
| dbms | q100.1 | q500.1 | q1000.1 |
|---|---|---|---|
| my5651_rel_native_lto.cy10_4g_u | 2378 | 6716 | 6570 |
| my5651_rel_native_lto.cy10_4g_ua1 | 2377 | 6864 | 6730 |
| my5651_rel_native_lto.cy10_4g_ua2 | 2373 | 6960 | 6895 |
| target | 2400 | 12000 | 24000 |
l.i0
l.i0: load without secondary indexes. Graphs for performance per 1-second interval are here.
Average throughput:
Insert response time histogram: each cell has the percentage of responses that take <= the time in the header and max is the max response time in seconds. For the max column values in the top 25% of the range have a red background and in the bottom 25% of the range have a green background. The red background is not used when the min value is within 80% of the max value.
| dbms | 256us | 1ms | 4ms | 16ms | 64ms | 256ms | 1s | 4s | 16s | gt | max |
|---|---|---|---|---|---|---|---|---|---|---|---|
| my5651_rel_native_lto.cy10_4g_u | 0.324 | 11.208 | 88.282 | 0.143 | 0.043 | 0.096 | |||||
| my5651_rel_native_lto.cy10_4g_ua1 | 0.322 | 10.643 | 88.839 | 0.153 | 0.043 | 0.103 | |||||
| my5651_rel_native_lto.cy10_4g_ua2 | 0.311 | 11.570 | 87.902 | 0.174 | 0.043 | 0.099 |
Performance metrics for the DBMS listed above. Some are normalized by throughput, others are not. Legend for results is here.
ips	qps	rps	rmbps	wps	wmbps	rpq	rkbpq	wpi	wkbpi	csps	cpups	cspq	cpupq	dbgb1	dbgb2	rss	maxop	p50	p99	tag
480000	0	0	0.0	1469.6	119.6	0.000	0.000	0.003	0.255	77260	38.2	0.161	64	31.8	160.3	4.7	0.096	20579	17682	480m.my5651_rel_native_lto.cy10_4g_u
476190	0	0	0.0	1485.2	111.0	0.000	0.000	0.003	0.239	74069	38.3	0.156	64	31.8	160.3	4.7	0.103	20078	17682	480m.my5651_rel_native_lto.cy10_4g_ua1
482897	0	0	0.0	1482.5	121.5	0.000	0.000	0.003	0.258	79319	38.5	0.164	64	31.8	160.3	4.7	0.099	19980	17680	480m.my5651_rel_native_lto.cy10_4g_ua2
l.x
l.x: create secondary indexes.
Average throughput:
Performance metrics for the DBMS listed above. Some are normalized by throughput, others are not. Legend for results is here.
ips	qps	rps	rmbps	wps	wmbps	rpq	rkbpq	wpi	wkbpi	csps	cpups	cspq	cpupq	dbgb1	dbgb2	rss	maxop	p50	p99	tag
361521	0	0	0.0	16847.9	617.7	0.000	0.000	0.047	1.750	97075	31.0	0.269	69	65.2	193.7	5.3	0.002	NA	NA	480m.my5651_rel_native_lto.cy10_4g_u
357217	0	0	0.0	15411.8	573.9	0.000	0.000	0.043	1.645	82249	31.2	0.230	70	65.2	193.7	5.3	0.002	NA	NA	480m.my5651_rel_native_lto.cy10_4g_ua1
364264	0	0	0.0	16065.5	591.5	0.000	0.000	0.044	1.663	95590	31.2	0.262	69	65.2	193.7	5.3	0.001	NA	NA	480m.my5651_rel_native_lto.cy10_4g_ua2
l.i1
l.i1: continue load after secondary indexes created. Graphs for performance per 1-second interval are here.
Average throughput:
Insert response time histogram: each cell has the percentage of responses that take <= the time in the header and max is the max response time in seconds. For the max column values in the top 25% of the range have a red background and in the bottom 25% of the range have a green background. The red background is not used when the min value is within 80% of the max value.
| dbms | 256us | 1ms | 4ms | 16ms | 64ms | 256ms | 1s | 4s | 16s | gt | max |
|---|---|---|---|---|---|---|---|---|---|---|---|
| my5651_rel_native_lto.cy10_4g_u | 0.005 | 0.087 | 41.021 | 54.598 | 4.289 | 0.001 | 1.356 | ||||
| my5651_rel_native_lto.cy10_4g_ua1 | 0.002 | 0.123 | 58.712 | 37.124 | 3.539 | 0.500 | 3.304 | ||||
| my5651_rel_native_lto.cy10_4g_ua2 | 0.002 | 0.075 | 42.155 | 52.570 | 5.196 | 0.001 | 1.373 |
Delete response time histogram: each cell has the percentage of responses that take <= the time in the header and max is the max response time in seconds. For the max column values in the top 25% of the range have a red background and in the bottom 25% of the range have a green background. The red background is not used when the min value is within 80% of the max value.
| dbms | 256us | 1ms | 4ms | 16ms | 64ms | 256ms | 1s | 4s | 16s | gt | max |
|---|---|---|---|---|---|---|---|---|---|---|---|
| my5651_rel_native_lto.cy10_4g_u | 0.043 | 0.925 | 43.624 | 52.349 | 3.058 | nonzero | 1.187 | ||||
| my5651_rel_native_lto.cy10_4g_ua1 | 0.043 | 0.873 | 61.464 | 34.471 | 2.720 | 0.430 | 2.998 | ||||
| my5651_rel_native_lto.cy10_4g_ua2 | 0.035 | 0.676 | 45.467 | 50.033 | 3.788 | 0.001 | 1.229 |
Performance metrics for the DBMS listed above. Some are normalized by throughput, others are not. Legend for results is here.
ips	qps	rps	rmbps	wps	wmbps	rpq	rkbpq	wpi	wkbpi	csps	cpups	cspq	cpupq	dbgb1	dbgb2	rss	maxop	p50	p99	tag
12820	0	268	1.2	38001.4	725.6	0.021	0.100	2.964	57.957	489769	47.4	38.202	2958	116.7	254.1	5.3	1.356	549	150	480m.my5651_rel_native_lto.cy10_4g_u
13257	0	171	1.0	38397.3	774.5	0.013	0.078	2.896	59.824	435573	44.0	32.857	2655	117.1	255.1	5.3	3.304	550	0	480m.my5651_rel_native_lto.cy10_4g_ua1
12662	0	222	1.3	38587.8	797.8	0.018	0.108	3.047	64.518	463079	45.6	36.572	2881	116.7	254.3	5.3	1.373	549	150	480m.my5651_rel_native_lto.cy10_4g_ua2
q100.1
q100.1: range queries with 100 insert/s per client. Graphs for performance per 1-second interval are here.
Average throughput:
Query response time histogram: each cell has the percentage of responses that take <= the time in the header and max is the max response time in seconds. For max values in the top 25% of the range have a red background and in the bottom 25% of the range have a green background. The red background is not used when the min value is within 80% of the max value.
| dbms | 256us | 1ms | 4ms | 16ms | 64ms | 256ms | 1s | 4s | 16s | gt | max |
|---|---|---|---|---|---|---|---|---|---|---|---|
| my5651_rel_native_lto.cy10_4g_u | 1.888 | 9.412 | 23.727 | 45.087 | 19.626 | 0.261 | nonzero | 0.358 | |||
| my5651_rel_native_lto.cy10_4g_ua1 | 2.193 | 9.648 | 24.905 | 45.491 | 17.536 | 0.226 | 0.001 | 0.980 | |||
| my5651_rel_native_lto.cy10_4g_ua2 | 2.151 | 8.982 | 24.888 | 46.046 | 17.714 | 0.218 | nonzero | 0.601 |
Insert response time histogram: each cell has the percentage of responses that take <= the time in the header and max is the max response time in seconds. For max values in the top 25% of the range have a red background and in the bottom 25% of the range have a green background. The red background is not used when the min value is within 80% of the max value.
| dbms | 256us | 1ms | 4ms | 16ms | 64ms | 256ms | 1s | 4s | 16s | gt | max |
|---|---|---|---|---|---|---|---|---|---|---|---|
| my5651_rel_native_lto.cy10_4g_u | 0.004 | 0.762 | 4.013 | 47.523 | 47.698 | 0.887 | |||||
| my5651_rel_native_lto.cy10_4g_ua1 | 0.034 | 2.784 | 11.507 | 54.717 | 30.953 | 0.006 | 1.598 | ||||
| my5651_rel_native_lto.cy10_4g_ua2 | 0.017 | 2.462 | 9.777 | 54.287 | 33.457 | 0.001 | 1.039 |
Delete response time histogram: each cell has the percentage of responses that take <= the time in the header and max is the max response time in seconds. For max values in the top 25% of the range have a red background and in the bottom 25% of the range have a green background. The red background is not used when the min value is within 80% of the max value.
| dbms | 256us | 1ms | 4ms | 16ms | 64ms | 256ms | 1s | 4s | 16s | gt | max |
|---|---|---|---|---|---|---|---|---|---|---|---|
| my5651_rel_native_lto.cy10_4g_u | 0.010 | 0.808 | 4.051 | 48.238 | 46.892 | 0.782 | |||||
| my5651_rel_native_lto.cy10_4g_ua1 | 0.049 | 2.902 | 11.589 | 55.209 | 30.249 | 0.002 | 1.144 | ||||
| my5651_rel_native_lto.cy10_4g_ua2 | 0.024 | 2.554 | 9.870 | 54.694 | 32.858 | 0.740 |
Performance metrics for the DBMS listed above. Some are normalized by throughput, others are not. Legend for results is here.
ips	qps	rps	rmbps	wps	wmbps	rpq	rkbpq	wpi	wkbpi	csps	cpups	cspq	cpupq	dbgb1	dbgb2	rss	maxop	p50	p99	tag
2378	2422	267	4.2	11823.2	275.9	0.110	1.760	4.972	118.820	215899	37.8	89.145	12486	117.0	254.8	5.3	0.358	96	80	480m.my5651_rel_native_lto.cy10_4g_u
2377	2581	237	3.4	15885.4	307.8	0.092	1.346	6.684	132.609	244251	36.8	94.638	11407	117.4	255.7	5.3	0.980	112	80	480m.my5651_rel_native_lto.cy10_4g_ua1
2373	2553	205	3.4	16024.4	326.2	0.080	1.360	6.753	140.757	248612	37.1	97.392	11627	117.0	254.9	5.3	0.601	112	64	480m.my5651_rel_native_lto.cy10_4g_ua2
q500.1
q500.1: range queries with 500 insert/s per client. Graphs for performance per 1-second interval are here.
Average throughput:
Query response time histogram: each cell has the percentage of responses that take <= the time in the header and max is the max response time in seconds. For max values in the top 25% of the range have a red background and in the bottom 25% of the range have a green background. The red background is not used when the min value is within 80% of the max value.
| dbms | 256us | 1ms | 4ms | 16ms | 64ms | 256ms | 1s | 4s | 16s | gt | max |
|---|---|---|---|---|---|---|---|---|---|---|---|
| my5651_rel_native_lto.cy10_4g_u | 1.207 | 6.587 | 16.890 | 44.672 | 29.642 | 1.001 | 0.001 | 0.617 | |||
| my5651_rel_native_lto.cy10_4g_ua1 | 1.145 | 6.407 | 15.991 | 43.578 | 31.346 | 1.515 | 0.017 | nonzero | 1.774 | ||
| my5651_rel_native_lto.cy10_4g_ua2 | 1.191 | 6.141 | 16.480 | 44.195 | 30.500 | 1.485 | 0.009 | nonzero | 1.315 |
Insert response time histogram: each cell has the percentage of responses that take <= the time in the header and max is the max response time in seconds. For max values in the top 25% of the range have a red background and in the bottom 25% of the range have a green background. The red background is not used when the min value is within 80% of the max value.
| dbms | 256us | 1ms | 4ms | 16ms | 64ms | 256ms | 1s | 4s | 16s | gt | max |
|---|---|---|---|---|---|---|---|---|---|---|---|
| my5651_rel_native_lto.cy10_4g_u | 0.006 | 0.088 | 4.141 | 85.950 | 9.815 | 0.842 | |||||
| my5651_rel_native_lto.cy10_4g_ua1 | 0.005 | 0.079 | 3.051 | 86.051 | 10.792 | 0.023 | 2.623 | ||||
| my5651_rel_native_lto.cy10_4g_ua2 | 0.009 | 0.102 | 3.703 | 86.308 | 9.872 | 0.005 | 1.741 |
Delete response time histogram: each cell has the percentage of responses that take <= the time in the header and max is the max response time in seconds. For max values in the top 25% of the range have a red background and in the bottom 25% of the range have a green background. The red background is not used when the min value is within 80% of the max value.
| dbms | 256us | 1ms | 4ms | 16ms | 64ms | 256ms | 1s | 4s | 16s | gt | max |
|---|---|---|---|---|---|---|---|---|---|---|---|
| my5651_rel_native_lto.cy10_4g_u | 0.011 | 0.087 | 4.251 | 86.361 | 9.290 | nonzero | 1.585 | ||||
| my5651_rel_native_lto.cy10_4g_ua1 | 0.007 | 0.079 | 3.202 | 86.507 | 10.193 | 0.012 | 2.145 | ||||
| my5651_rel_native_lto.cy10_4g_ua2 | 0.011 | 0.102 | 3.855 | 86.749 | 9.279 | 0.004 | 1.809 |
Performance metrics for the DBMS listed above. Some are normalized by throughput, others are not. Legend for results is here.
ips	qps	rps	rmbps	wps	wmbps	rpq	rkbpq	wpi	wkbpi	csps	cpups	cspq	cpupq	dbgb1	dbgb2	rss	maxop	p50	p99	tag
6716	1764	99	1.9	27162.4	471.8	0.056	1.120	4.044	71.927	491290	58.2	278.478	26392	119.4	259.8	5.3	0.617	80	48	480m.my5651_rel_native_lto.cy10_4g_u
6864	1642	233	2.8	26166.4	460.8	0.142	1.740	3.812	68.743	474027	58.1	288.601	28298	119.7	260.7	5.4	1.774	64	32	480m.my5651_rel_native_lto.cy10_4g_ua1
6960	1674	301	3.3	27133.0	478.8	0.180	2.008	3.899	70.444	498639	58.3	297.802	27855	119.4	259.9	5.3	1.315	64	48	480m.my5651_rel_native_lto.cy10_4g_ua2
q1000.1
q1000.1: range queries with 1000 insert/s per client. Graphs for performance per 1-second interval are here.
Average throughput:
Query response time histogram: each cell has the percentage of responses that take <= the time in the header and max is the max response time in seconds. For max values in the top 25% of the range have a red background and in the bottom 25% of the range have a green background. The red background is not used when the min value is within 80% of the max value.
| dbms | 256us | 1ms | 4ms | 16ms | 64ms | 256ms | 1s | 4s | 16s | gt | max |
|---|---|---|---|---|---|---|---|---|---|---|---|
| my5651_rel_native_lto.cy10_4g_u | 1.175 | 6.496 | 16.684 | 43.818 | 30.534 | 1.292 | 0.001 | 0.602 | |||
| my5651_rel_native_lto.cy10_4g_ua1 | 1.086 | 6.347 | 15.699 | 42.591 | 32.391 | 1.867 | 0.018 | nonzero | 1.766 | ||
| my5651_rel_native_lto.cy10_4g_ua2 | 1.099 | 6.070 | 16.071 | 43.231 | 31.725 | 1.795 | 0.009 | 0.879 |
Insert response time histogram: each cell has the percentage of responses that take <= the time in the header and max is the max response time in seconds. For max values in the top 25% of the range have a red background and in the bottom 25% of the range have a green background. The red background is not used when the min value is within 80% of the max value.
| dbms | 256us | 1ms | 4ms | 16ms | 64ms | 256ms | 1s | 4s | 16s | gt | max |
|---|---|---|---|---|---|---|---|---|---|---|---|
| my5651_rel_native_lto.cy10_4g_u | 0.003 | 0.040 | 4.232 | 83.873 | 11.852 | nonzero | 1.143 | ||||
| my5651_rel_native_lto.cy10_4g_ua1 | 0.003 | 0.025 | 3.052 | 84.572 | 12.333 | 0.016 | 2.044 | ||||
| my5651_rel_native_lto.cy10_4g_ua2 | 0.001 | 0.032 | 3.827 | 85.560 | 10.578 | 0.001 | 1.962 |
Delete response time histogram: each cell has the percentage of responses that take <= the time in the header and max is the max response time in seconds. For max values in the top 25% of the range have a red background and in the bottom 25% of the range have a green background. The red background is not used when the min value is within 80% of the max value.
| dbms | 256us | 1ms | 4ms | 16ms | 64ms | 256ms | 1s | 4s | 16s | gt | max |
|---|---|---|---|---|---|---|---|---|---|---|---|
| my5651_rel_native_lto.cy10_4g_u | 0.006 | 0.039 | 4.296 | 84.328 | 11.331 | nonzero | 1.003 | ||||
| my5651_rel_native_lto.cy10_4g_ua1 | 0.005 | 0.023 | 3.167 | 85.101 | 11.694 | 0.009 | 1.924 | ||||
| my5651_rel_native_lto.cy10_4g_ua2 | 0.001 | 0.034 | 3.954 | 85.993 | 10.018 | 0.001 | 1.962 |
Performance metrics for the DBMS listed above. Some are normalized by throughput, others are not. Legend for results is here.
ips	qps	rps	rmbps	wps	wmbps	rpq	rkbpq	wpi	wkbpi	csps	cpups	cspq	cpupq	dbgb1	dbgb2	rss	maxop	p50	p99	tag
6570	1704	179	0.8	26812.0	462.5	0.105	0.458	4.081	72.094	490225	58.4	287.674	27416	124.1	269.8	5.3	0.602	64	48	480m.my5651_rel_native_lto.cy10_4g_u
6730	1576	174	1.1	25935.7	454.9	0.111	0.685	3.854	69.219	477040	58.2	302.690	29543	124.5	270.7	5.4	1.766	64	32	480m.my5651_rel_native_lto.cy10_4g_ua1
6895	1606	154	0.8	26893.8	472.8	0.096	0.541	3.900	70.210	503495	58.7	313.411	29231	124.2	269.9	5.3	0.879	64	48	480m.my5651_rel_native_lto.cy10_4g_ua2
l.i0
l.i0: load without secondary indexes
Performance metrics for all DBMS, not just the ones listed above. Some are normalized by throughput, others are not. Legend for results is here.
ips	qps	rps	rmbps	wps	wmbps	rpq	rkbpq	wpi	wkbpi	csps	cpups	cspq	cpupq	dbgb1	dbgb2	rss	maxop	p50	p99	tag
480000	0	0	0.0	1469.6	119.6	0.000	0.000	0.003	0.255	77260	38.2	0.161	64	31.8	160.3	4.7	0.096	20579	17682	480m.my5651_rel_native_lto.cy10_4g_u
476190	0	0	0.0	1485.2	111.0	0.000	0.000	0.003	0.239	74069	38.3	0.156	64	31.8	160.3	4.7	0.103	20078	17682	480m.my5651_rel_native_lto.cy10_4g_ua1
482897	0	0	0.0	1482.5	121.5	0.000	0.000	0.003	0.258	79319	38.5	0.164	64	31.8	160.3	4.7	0.099	19980	17680	480m.my5651_rel_native_lto.cy10_4g_ua2
l.x
l.x: create secondary indexes
Performance metrics for all DBMS, not just the ones listed above. Some are normalized by throughput, others are not. Legend for results is here.
ips	qps	rps	rmbps	wps	wmbps	rpq	rkbpq	wpi	wkbpi	csps	cpups	cspq	cpupq	dbgb1	dbgb2	rss	maxop	p50	p99	tag
361521	0	0	0.0	16847.9	617.7	0.000	0.000	0.047	1.750	97075	31.0	0.269	69	65.2	193.7	5.3	0.002	NA	NA	480m.my5651_rel_native_lto.cy10_4g_u
357217	0	0	0.0	15411.8	573.9	0.000	0.000	0.043	1.645	82249	31.2	0.230	70	65.2	193.7	5.3	0.002	NA	NA	480m.my5651_rel_native_lto.cy10_4g_ua1
364264	0	0	0.0	16065.5	591.5	0.000	0.000	0.044	1.663	95590	31.2	0.262	69	65.2	193.7	5.3	0.001	NA	NA	480m.my5651_rel_native_lto.cy10_4g_ua2
l.i1
l.i1: continue load after secondary indexes created
Performance metrics for all DBMS, not just the ones listed above. Some are normalized by throughput, others are not. Legend for results is here.
ips	qps	rps	rmbps	wps	wmbps	rpq	rkbpq	wpi	wkbpi	csps	cpups	cspq	cpupq	dbgb1	dbgb2	rss	maxop	p50	p99	tag
12820	0	268	1.2	38001.4	725.6	0.021	0.100	2.964	57.957	489769	47.4	38.202	2958	116.7	254.1	5.3	1.356	549	150	480m.my5651_rel_native_lto.cy10_4g_u
13257	0	171	1.0	38397.3	774.5	0.013	0.078	2.896	59.824	435573	44.0	32.857	2655	117.1	255.1	5.3	3.304	550	0	480m.my5651_rel_native_lto.cy10_4g_ua1
12662	0	222	1.3	38587.8	797.8	0.018	0.108	3.047	64.518	463079	45.6	36.572	2881	116.7	254.3	5.3	1.373	549	150	480m.my5651_rel_native_lto.cy10_4g_ua2
q100.1
q100.1: range queries with 100 insert/s per client
Performance metrics for all DBMS, not just the ones listed above. Some are normalized by throughput, others are not. Legend for results is here.
ips	qps	rps	rmbps	wps	wmbps	rpq	rkbpq	wpi	wkbpi	csps	cpups	cspq	cpupq	dbgb1	dbgb2	rss	maxop	p50	p99	tag
2378	2422	267	4.2	11823.2	275.9	0.110	1.760	4.972	118.820	215899	37.8	89.145	12486	117.0	254.8	5.3	0.358	96	80	480m.my5651_rel_native_lto.cy10_4g_u
2377	2581	237	3.4	15885.4	307.8	0.092	1.346	6.684	132.609	244251	36.8	94.638	11407	117.4	255.7	5.3	0.980	112	80	480m.my5651_rel_native_lto.cy10_4g_ua1
2373	2553	205	3.4	16024.4	326.2	0.080	1.360	6.753	140.757	248612	37.1	97.392	11627	117.0	254.9	5.3	0.601	112	64	480m.my5651_rel_native_lto.cy10_4g_ua2
q500.1
q500.1: range queries with 500 insert/s per client
Performance metrics for all DBMS, not just the ones listed above. Some are normalized by throughput, others are not. Legend for results is here.
ips	qps	rps	rmbps	wps	wmbps	rpq	rkbpq	wpi	wkbpi	csps	cpups	cspq	cpupq	dbgb1	dbgb2	rss	maxop	p50	p99	tag
6716	1764	99	1.9	27162.4	471.8	0.056	1.120	4.044	71.927	491290	58.2	278.478	26392	119.4	259.8	5.3	0.617	80	48	480m.my5651_rel_native_lto.cy10_4g_u
6864	1642	233	2.8	26166.4	460.8	0.142	1.740	3.812	68.743	474027	58.1	288.601	28298	119.7	260.7	5.4	1.774	64	32	480m.my5651_rel_native_lto.cy10_4g_ua1
6960	1674	301	3.3	27133.0	478.8	0.180	2.008	3.899	70.444	498639	58.3	297.802	27855	119.4	259.9	5.3	1.315	64	48	480m.my5651_rel_native_lto.cy10_4g_ua2
q1000.1
q1000.1: range queries with 1000 insert/s per client
Performance metrics for all DBMS, not just the ones listed above. Some are normalized by throughput, others are not. Legend for results is here.
ips	qps	rps	rmbps	wps	wmbps	rpq	rkbpq	wpi	wkbpi	csps	cpups	cspq	cpupq	dbgb1	dbgb2	rss	maxop	p50	p99	tag
6570	1704	179	0.8	26812.0	462.5	0.105	0.458	4.081	72.094	490225	58.4	287.674	27416	124.1	269.8	5.3	0.602	64	48	480m.my5651_rel_native_lto.cy10_4g_u
6730	1576	174	1.1	25935.7	454.9	0.111	0.685	3.854	69.219	477040	58.2	302.690	29543	124.5	270.7	5.4	1.766	64	32	480m.my5651_rel_native_lto.cy10_4g_ua1
6895	1606	154	0.8	26893.8	472.8	0.096	0.541	3.900	70.210	503495	58.7	313.411	29231	124.2	269.9	5.3	0.879	64	48	480m.my5651_rel_native_lto.cy10_4g_ua2
l.i0
- l.i0: load without secondary indexes
- Legend for results is here.
- Each entry lists the percentage of responses that fit in that bucket (slower than max time for previous bucket, faster than min time for next bucket).
Insert response time histogram
256us	1ms	4ms	16ms	64ms	256ms	1s	4s	16s	gt	max	tag
0.000	0.324	11.208	88.282	0.143	0.043	0.000	0.000	0.000	0.000	0.096	my5651_rel_native_lto.cy10_4g_u
0.000	0.322	10.643	88.839	0.153	0.043	0.000	0.000	0.000	0.000	0.103	my5651_rel_native_lto.cy10_4g_ua1
0.000	0.311	11.570	87.902	0.174	0.043	0.000	0.000	0.000	0.000	0.099	my5651_rel_native_lto.cy10_4g_ua2
l.x
- l.x: create secondary indexes
- Legend for results is here.
- Each entry lists the percentage of responses that fit in that bucket (slower than max time for previous bucket, faster than min time for next bucket).
TODO - determine whether there is data for create index response time
l.i1
- l.i1: continue load after secondary indexes created
- Legend for results is here.
- Each entry lists the percentage of responses that fit in that bucket (slower than max time for previous bucket, faster than min time for next bucket).
Insert response time histogram
256us	1ms	4ms	16ms	64ms	256ms	1s	4s	16s	gt	max	tag
0.000	0.000	0.005	0.087	41.021	54.598	4.289	0.001	0.000	0.000	1.356	my5651_rel_native_lto.cy10_4g_u
0.000	0.000	0.002	0.123	58.712	37.124	3.539	0.500	0.000	0.000	3.304	my5651_rel_native_lto.cy10_4g_ua1
0.000	0.000	0.002	0.075	42.155	52.570	5.196	0.001	0.000	0.000	1.373	my5651_rel_native_lto.cy10_4g_ua2
Delete response time histogram
256us	1ms	4ms	16ms	64ms	256ms	1s	4s	16s	gt	max	tag
0.000	0.000	0.043	0.925	43.624	52.349	3.058	nonzero	0.000	0.000	1.187	my5651_rel_native_lto.cy10_4g_u
0.000	0.000	0.043	0.873	61.464	34.471	2.720	0.430	0.000	0.000	2.998	my5651_rel_native_lto.cy10_4g_ua1
0.000	0.000	0.035	0.676	45.467	50.033	3.788	0.001	0.000	0.000	1.229	my5651_rel_native_lto.cy10_4g_ua2
q100.1
- q100.1: range queries with 100 insert/s per client
- Legend for results is here.
- Each entry lists the percentage of responses that fit in that bucket (slower than max time for previous bucket, faster than min time for next bucket).
Query response time histogram
256us	1ms	4ms	16ms	64ms	256ms	1s	4s	16s	gt	max	tag
1.888	9.412	23.727	45.087	19.626	0.261	nonzero	0.000	0.000	0.000	0.358	my5651_rel_native_lto.cy10_4g_u
2.193	9.648	24.905	45.491	17.536	0.226	0.001	0.000	0.000	0.000	0.980	my5651_rel_native_lto.cy10_4g_ua1
2.151	8.982	24.888	46.046	17.714	0.218	nonzero	0.000	0.000	0.000	0.601	my5651_rel_native_lto.cy10_4g_ua2
Insert response time histogram
256us	1ms	4ms	16ms	64ms	256ms	1s	4s	16s	gt	max	tag
0.000	0.000	0.004	0.762	4.013	47.523	47.698	0.000	0.000	0.000	0.887	my5651_rel_native_lto.cy10_4g_u
0.000	0.000	0.034	2.784	11.507	54.717	30.953	0.006	0.000	0.000	1.598	my5651_rel_native_lto.cy10_4g_ua1
0.000	0.000	0.017	2.462	9.777	54.287	33.457	0.001	0.000	0.000	1.039	my5651_rel_native_lto.cy10_4g_ua2
Delete response time histogram
256us	1ms	4ms	16ms	64ms	256ms	1s	4s	16s	gt	max	tag
0.000	0.000	0.010	0.808	4.051	48.238	46.892	0.000	0.000	0.000	0.782	my5651_rel_native_lto.cy10_4g_u
0.000	0.000	0.049	2.902	11.589	55.209	30.249	0.002	0.000	0.000	1.144	my5651_rel_native_lto.cy10_4g_ua1
0.000	0.000	0.024	2.554	9.870	54.694	32.858	0.000	0.000	0.000	0.740	my5651_rel_native_lto.cy10_4g_ua2
q500.1
- q500.1: range queries with 500 insert/s per client
- Legend for results is here.
- Each entry lists the percentage of responses that fit in that bucket (slower than max time for previous bucket, faster than min time for next bucket).
Query response time histogram
256us	1ms	4ms	16ms	64ms	256ms	1s	4s	16s	gt	max	tag
1.207	6.587	16.890	44.672	29.642	1.001	0.001	0.000	0.000	0.000	0.617	my5651_rel_native_lto.cy10_4g_u
1.145	6.407	15.991	43.578	31.346	1.515	0.017	nonzero	0.000	0.000	1.774	my5651_rel_native_lto.cy10_4g_ua1
1.191	6.141	16.480	44.195	30.500	1.485	0.009	nonzero	0.000	0.000	1.315	my5651_rel_native_lto.cy10_4g_ua2
Insert response time histogram
256us	1ms	4ms	16ms	64ms	256ms	1s	4s	16s	gt	max	tag
0.000	0.000	0.006	0.088	4.141	85.950	9.815	0.000	0.000	0.000	0.842	my5651_rel_native_lto.cy10_4g_u
0.000	0.000	0.005	0.079	3.051	86.051	10.792	0.023	0.000	0.000	2.623	my5651_rel_native_lto.cy10_4g_ua1
0.000	0.000	0.009	0.102	3.703	86.308	9.872	0.005	0.000	0.000	1.741	my5651_rel_native_lto.cy10_4g_ua2
Delete response time histogram
256us	1ms	4ms	16ms	64ms	256ms	1s	4s	16s	gt	max	tag
0.000	0.000	0.011	0.087	4.251	86.361	9.290	nonzero	0.000	0.000	1.585	my5651_rel_native_lto.cy10_4g_u
0.000	0.000	0.007	0.079	3.202	86.507	10.193	0.012	0.000	0.000	2.145	my5651_rel_native_lto.cy10_4g_ua1
0.000	0.000	0.011	0.102	3.855	86.749	9.279	0.004	0.000	0.000	1.809	my5651_rel_native_lto.cy10_4g_ua2
q1000.1
- q1000.1: range queries with 1000 insert/s per client
- Legend for results is here.
- Each entry lists the percentage of responses that fit in that bucket (slower than max time for previous bucket, faster than min time for next bucket).
Query response time histogram
256us	1ms	4ms	16ms	64ms	256ms	1s	4s	16s	gt	max	tag
1.175	6.496	16.684	43.818	30.534	1.292	0.001	0.000	0.000	0.000	0.602	my5651_rel_native_lto.cy10_4g_u
1.086	6.347	15.699	42.591	32.391	1.867	0.018	nonzero	0.000	0.000	1.766	my5651_rel_native_lto.cy10_4g_ua1
1.099	6.070	16.071	43.231	31.725	1.795	0.009	0.000	0.000	0.000	0.879	my5651_rel_native_lto.cy10_4g_ua2
Insert response time histogram
256us	1ms	4ms	16ms	64ms	256ms	1s	4s	16s	gt	max	tag
0.000	0.000	0.003	0.040	4.232	83.873	11.852	nonzero	0.000	0.000	1.143	my5651_rel_native_lto.cy10_4g_u
0.000	0.000	0.003	0.025	3.052	84.572	12.333	0.016	0.000	0.000	2.044	my5651_rel_native_lto.cy10_4g_ua1
0.000	0.000	0.001	0.032	3.827	85.560	10.578	0.001	0.000	0.000	1.962	my5651_rel_native_lto.cy10_4g_ua2
Delete response time histogram
256us	1ms	4ms	16ms	64ms	256ms	1s	4s	16s	gt	max	tag
0.000	0.000	0.006	0.039	4.296	84.328	11.331	nonzero	0.000	0.000	1.003	my5651_rel_native_lto.cy10_4g_u
0.000	0.000	0.005	0.023	3.167	85.101	11.694	0.009	0.000	0.000	1.924	my5651_rel_native_lto.cy10_4g_ua1
0.000	0.000	0.001	0.034	3.954	85.993	10.018	0.001	0.000	0.000	1.962	my5651_rel_native_lto.cy10_4g_ua2