Introduction
This is a report for the insert benchmark with 480M docs and 24 client(s). It is generated by scripts (bash, awk, sed) and Tufte might not be impressed. An overview of the insert benchmark is here and a short update is here. Below, by DBMS, I mean DBMS+version.config. An example is my8020.c10b40 where my means MySQL, 8020 is version 8.0.20 and c10b40 is the name for the configuration file.
The test server has 80 cores with hyperthreads enabled, 256G RAM and fast storage. The benchmark was run with 24 clients and there were 1 or 3 connections per client (1 for queries or inserts without rate limits, 1+1 for rate limited inserts+deletes). There are 24 tables, with a client per table. It loads 480M rows without secondary indexes, creates secondary indexes, then inserts 120M rows with a delete per insert to avoid growing the table. It then does 3 read+write tests for 3600s each that do queries as fast as possible with 100, 500 and then 1000 inserts/second/client concurrent with the queries and 1000 deletes/second to avoid growing the table. The database is cached by the OS but not by InnoDB.
The tested DBMS are:
- my5651_rel_native_lto.cy10_4g_u - InnoDB and MySQL 5.6.51, rel_native_lto build, cy10_4g_u config, compiled with CMAKE_BUILD_TYPE=Release
- my5740_rel_native_lto.cy10_4g_u - InnoDB and MySQL 5.7.40, rel_native_lto build, cy10_4g_u config, compiled with CMAKE_BUILD_TYPE=Release, base config
- my8033_rel_native_lto.cy10_4g_u - InnoDB and MySQL 8.0.33, rel_native_lto build, cy10_4g_u config, compiled with CMAKE_BUILD_TYPE=Release, base config
Contents
- Summary
- l.i0: load without secondary indexes
- l.x: create secondary indexes
- l.i1: continue load after secondary indexes created
- q100.1: range queries with 100 insert/s per client
- q500.1: range queries with 500 insert/s per client
- q1000.1: range queries with 1000 insert/s per client
Summary
The numbers are inserts/s for l.i0 and l.i1, indexed docs (or rows) /s for l.x and queries/s for q*.2. The values are the average rate over the entire test for inserts (IPS) and queries (QPS). The range of values for IPS and QPS is split into 3 parts: bottom 25%, middle 50%, top 25%. Values in the bottom 25% have a red background, values in the top 25% have a green background and values in the middle have no color. A gray background is used for values that can be ignored because the DBMS did not sustain the target insert rate. Red backgrounds are not used when the minimum value is within 80% of the max value.
| dbms | l.i0 | l.x | l.i1 | q100.1 | q500.1 | q1000.1 |
|---|---|---|---|---|---|---|
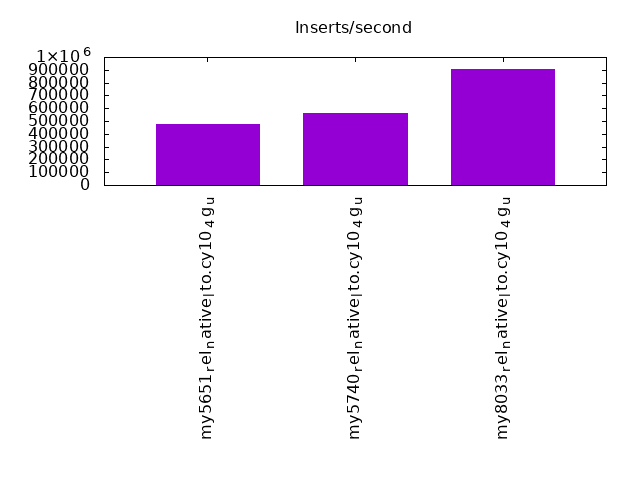
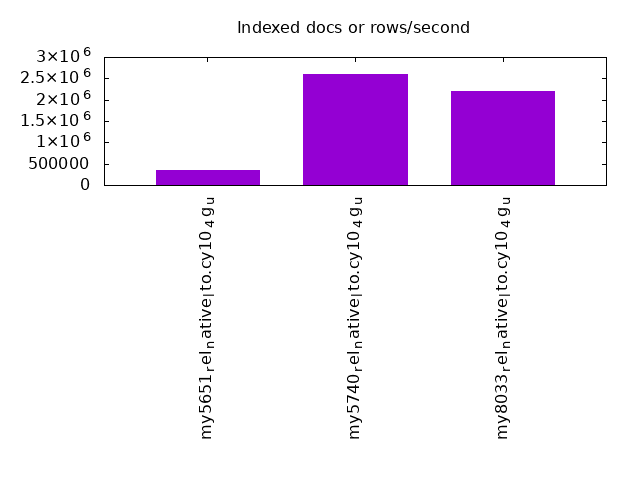
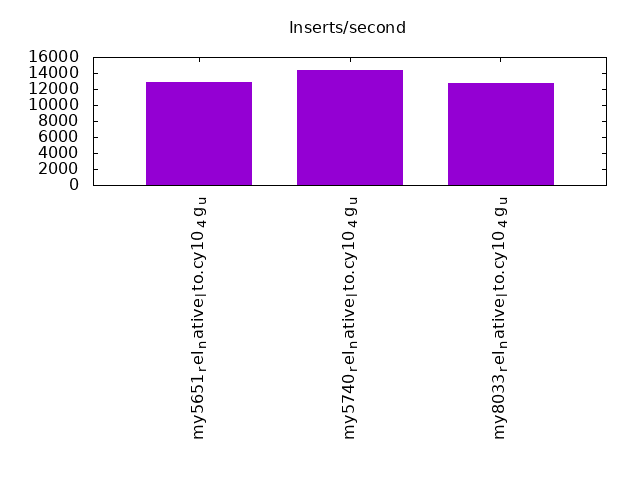
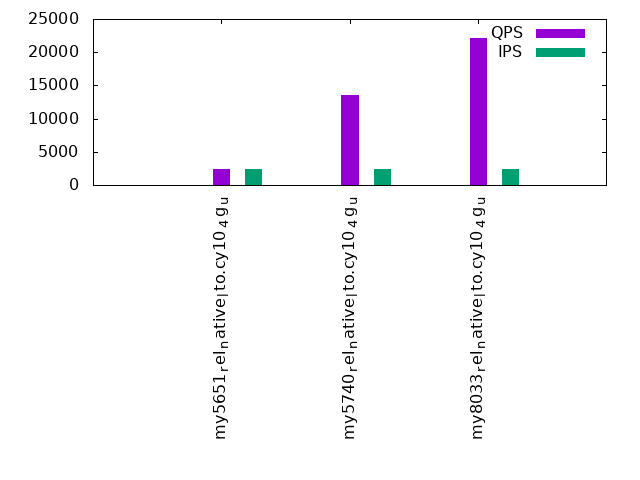
| my5651_rel_native_lto.cy10_4g_u | 480000 | 361521 | 12820 | 2422 | 1764 | 1704 |
| my5740_rel_native_lto.cy10_4g_u | 565371 | 2595135 | 14332 | 13544 | 5825 | 3725 |
| my8033_rel_native_lto.cy10_4g_u | 909091 | 2212442 | 12784 | 22098 | 5399 | 5250 |
This table has relative throughput, throughput for the DBMS relative to the DBMS in the first line, using the absolute throughput from the previous table. Values less than 0.95 have a yellow background. Values greater than 1.05 have a blue background.
| dbms | l.i0 | l.x | l.i1 | q100.1 | q500.1 | q1000.1 |
|---|---|---|---|---|---|---|
| my5651_rel_native_lto.cy10_4g_u | 1.00 | 1.00 | 1.00 | 1.00 | 1.00 | 1.00 |
| my5740_rel_native_lto.cy10_4g_u | 1.18 | 7.18 | 1.12 | 5.59 | 3.30 | 2.19 |
| my8033_rel_native_lto.cy10_4g_u | 1.89 | 6.12 | 1.00 | 9.12 | 3.06 | 3.08 |
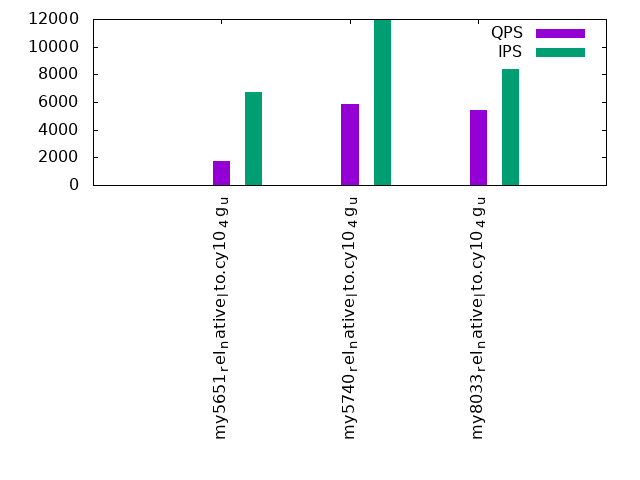
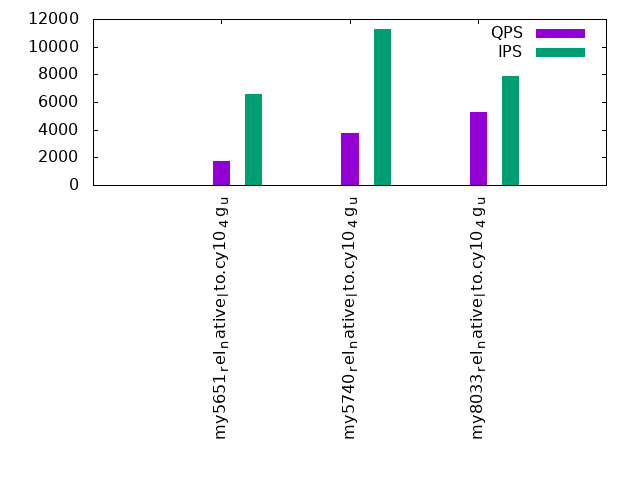
This lists the average rate of inserts/s for the tests that do inserts concurrent with queries. For such tests the query rate is listed in the table above. The read+write tests are setup so that the insert rate should match the target rate every second. Cells that are not at least 95% of the target have a red background to indicate a failure to satisfy the target.
| dbms | q100.1 | q500.1 | q1000.1 |
|---|---|---|---|
| my5651_rel_native_lto.cy10_4g_u | 2378 | 6716 | 6570 |
| my5740_rel_native_lto.cy10_4g_u | 2380 | 11901 | 11262 |
| my8033_rel_native_lto.cy10_4g_u | 2381 | 8414 | 7870 |
| target | 2400 | 12000 | 24000 |
l.i0
l.i0: load without secondary indexes. Graphs for performance per 1-second interval are here.
Average throughput:
Insert response time histogram: each cell has the percentage of responses that take <= the time in the header and max is the max response time in seconds. For the max column values in the top 25% of the range have a red background and in the bottom 25% of the range have a green background. The red background is not used when the min value is within 80% of the max value.
| dbms | 256us | 1ms | 4ms | 16ms | 64ms | 256ms | 1s | 4s | 16s | gt | max |
|---|---|---|---|---|---|---|---|---|---|---|---|
| my5651_rel_native_lto.cy10_4g_u | 0.324 | 11.208 | 88.282 | 0.143 | 0.043 | 0.096 | |||||
| my5740_rel_native_lto.cy10_4g_u | 0.193 | 47.744 | 52.015 | 0.005 | 0.043 | 0.090 | |||||
| my8033_rel_native_lto.cy10_4g_u | 99.776 | 0.176 | 0.005 | 0.043 | 0.120 |
Performance metrics for the DBMS listed above. Some are normalized by throughput, others are not. Legend for results is here.
ips	qps	rps	rmbps	wps	wmbps	rpq	rkbpq	wpi	wkbpi	csps	cpups	cspq	cpupq	dbgb1	dbgb2	rss	maxop	p50	p99	tag
480000	0	0	0.0	1469.6	119.6	0.000	0.000	0.003	0.255	77260	38.2	0.161	64	31.8	160.3	4.7	0.096	20579	17682	480m.my5651_rel_native_lto.cy10_4g_u
565371	0	0	0.0	1849.8	142.1	0.000	0.000	0.003	0.257	90151	40.1	0.159	57	31.8	160.3	4.5	0.090	24176	21678	480m.my5740_rel_native_lto.cy10_4g_u
909091	0	0	0.0	3586.3	239.3	0.000	0.000	0.004	0.270	216462	51.3	0.238	45	31.7	160.3	4.8	0.120	39960	34562	480m.my8033_rel_native_lto.cy10_4g_u
l.x
l.x: create secondary indexes.
Average throughput:
Performance metrics for the DBMS listed above. Some are normalized by throughput, others are not. Legend for results is here.
ips	qps	rps	rmbps	wps	wmbps	rpq	rkbpq	wpi	wkbpi	csps	cpups	cspq	cpupq	dbgb1	dbgb2	rss	maxop	p50	p99	tag
361521	0	0	0.0	16847.9	617.7	0.000	0.000	0.047	1.750	97075	31.0	0.269	69	65.2	193.7	5.3	0.002	NA	NA	480m.my5651_rel_native_lto.cy10_4g_u
2595135	0	1	0.1	23225.7	1987.2	0.000	0.000	0.009	0.784	124631	27.0	0.048	8	70.8	199.3	5.1	0.002	NA	NA	480m.my5740_rel_native_lto.cy10_4g_u
2212442	0	11956	579.9	36888.7	1616.5	0.005	0.268	0.017	0.748	206986	79.5	0.094	29	70.6	199.2	4.8	0.006	NA	NA	480m.my8033_rel_native_lto.cy10_4g_u
l.i1
l.i1: continue load after secondary indexes created. Graphs for performance per 1-second interval are here.
Average throughput:
Insert response time histogram: each cell has the percentage of responses that take <= the time in the header and max is the max response time in seconds. For the max column values in the top 25% of the range have a red background and in the bottom 25% of the range have a green background. The red background is not used when the min value is within 80% of the max value.
| dbms | 256us | 1ms | 4ms | 16ms | 64ms | 256ms | 1s | 4s | 16s | gt | max |
|---|---|---|---|---|---|---|---|---|---|---|---|
| my5651_rel_native_lto.cy10_4g_u | 0.005 | 0.087 | 41.021 | 54.598 | 4.289 | 0.001 | 1.356 | ||||
| my5740_rel_native_lto.cy10_4g_u | nonzero | 0.831 | 63.862 | 30.031 | 5.138 | 0.136 | 0.001 | 6.573 | |||
| my8033_rel_native_lto.cy10_4g_u | 0.005 | 5.192 | 54.899 | 35.526 | 4.174 | 0.146 | 0.058 | 9.031 |
Delete response time histogram: each cell has the percentage of responses that take <= the time in the header and max is the max response time in seconds. For the max column values in the top 25% of the range have a red background and in the bottom 25% of the range have a green background. The red background is not used when the min value is within 80% of the max value.
| dbms | 256us | 1ms | 4ms | 16ms | 64ms | 256ms | 1s | 4s | 16s | gt | max |
|---|---|---|---|---|---|---|---|---|---|---|---|
| my5651_rel_native_lto.cy10_4g_u | 0.043 | 0.925 | 43.624 | 52.349 | 3.058 | nonzero | 1.187 | ||||
| my5740_rel_native_lto.cy10_4g_u | 0.048 | 2.622 | 66.272 | 27.144 | 3.788 | 0.126 | 0.001 | 6.532 | |||
| my8033_rel_native_lto.cy10_4g_u | 0.071 | 7.147 | 56.324 | 32.697 | 3.562 | 0.147 | 0.052 | 8.925 |
Performance metrics for the DBMS listed above. Some are normalized by throughput, others are not. Legend for results is here.
ips	qps	rps	rmbps	wps	wmbps	rpq	rkbpq	wpi	wkbpi	csps	cpups	cspq	cpupq	dbgb1	dbgb2	rss	maxop	p50	p99	tag
12820	0	268	1.2	38001.4	725.6	0.021	0.100	2.964	57.957	489769	47.4	38.202	2958	116.7	254.1	5.3	1.356	549	150	480m.my5651_rel_native_lto.cy10_4g_u
14332	0	7	0.5	29005.2	775.8	0.000	0.036	2.024	55.432	375300	36.7	26.187	2049	117.5	256.0	5.1	6.573	549	0	480m.my5740_rel_native_lto.cy10_4g_u
12784	0	39	0.7	27681.0	803.1	0.003	0.053	2.165	64.331	554175	36.1	43.350	2259	117.4	256.2	4.8	9.031	0	0	480m.my8033_rel_native_lto.cy10_4g_u
q100.1
q100.1: range queries with 100 insert/s per client. Graphs for performance per 1-second interval are here.
Average throughput:
Query response time histogram: each cell has the percentage of responses that take <= the time in the header and max is the max response time in seconds. For max values in the top 25% of the range have a red background and in the bottom 25% of the range have a green background. The red background is not used when the min value is within 80% of the max value.
| dbms | 256us | 1ms | 4ms | 16ms | 64ms | 256ms | 1s | 4s | 16s | gt | max |
|---|---|---|---|---|---|---|---|---|---|---|---|
| my5651_rel_native_lto.cy10_4g_u | 1.888 | 9.412 | 23.727 | 45.087 | 19.626 | 0.261 | nonzero | 0.358 | |||
| my5740_rel_native_lto.cy10_4g_u | 2.914 | 33.316 | 56.957 | 6.767 | 0.046 | nonzero | 0.203 | ||||
| my8033_rel_native_lto.cy10_4g_u | 1.394 | 56.861 | 40.574 | 1.164 | 0.007 | nonzero | nonzero | 0.526 |
Insert response time histogram: each cell has the percentage of responses that take <= the time in the header and max is the max response time in seconds. For max values in the top 25% of the range have a red background and in the bottom 25% of the range have a green background. The red background is not used when the min value is within 80% of the max value.
| dbms | 256us | 1ms | 4ms | 16ms | 64ms | 256ms | 1s | 4s | 16s | gt | max |
|---|---|---|---|---|---|---|---|---|---|---|---|
| my5651_rel_native_lto.cy10_4g_u | 0.004 | 0.762 | 4.013 | 47.523 | 47.698 | 0.887 | |||||
| my5740_rel_native_lto.cy10_4g_u | 0.204 | 96.130 | 3.624 | 0.042 | 0.213 | ||||||
| my8033_rel_native_lto.cy10_4g_u | 0.140 | 76.136 | 23.698 | 0.025 | 0.001 | 0.331 |
Delete response time histogram: each cell has the percentage of responses that take <= the time in the header and max is the max response time in seconds. For max values in the top 25% of the range have a red background and in the bottom 25% of the range have a green background. The red background is not used when the min value is within 80% of the max value.
| dbms | 256us | 1ms | 4ms | 16ms | 64ms | 256ms | 1s | 4s | 16s | gt | max |
|---|---|---|---|---|---|---|---|---|---|---|---|
| my5651_rel_native_lto.cy10_4g_u | 0.010 | 0.808 | 4.051 | 48.238 | 46.892 | 0.782 | |||||
| my5740_rel_native_lto.cy10_4g_u | 0.299 | 96.501 | 3.159 | 0.041 | 0.215 | ||||||
| my8033_rel_native_lto.cy10_4g_u | 0.303 | 78.554 | 21.122 | 0.020 | 0.001 | 0.391 |
Performance metrics for the DBMS listed above. Some are normalized by throughput, others are not. Legend for results is here.
ips	qps	rps	rmbps	wps	wmbps	rpq	rkbpq	wpi	wkbpi	csps	cpups	cspq	cpupq	dbgb1	dbgb2	rss	maxop	p50	p99	tag
2378	2422	267	4.2	11823.2	275.9	0.110	1.760	4.972	118.820	215899	37.8	89.145	12486	117.0	254.8	5.3	0.358	96	80	480m.my5651_rel_native_lto.cy10_4g_u
2380	13544	56	1.2	58856.4	1069.1	0.004	0.090	24.729	459.968	677403	32.5	50.015	1920	117.5	256.0	5.1	0.203	559	176	480m.my5740_rel_native_lto.cy10_4g_u
2381	22098	67	1.3	58524.8	1120.0	0.003	0.060	24.582	481.733	651404	35.7	29.478	1292	117.4	256.2	4.8	0.526	911	767	480m.my8033_rel_native_lto.cy10_4g_u
q500.1
q500.1: range queries with 500 insert/s per client. Graphs for performance per 1-second interval are here.
Average throughput:
Query response time histogram: each cell has the percentage of responses that take <= the time in the header and max is the max response time in seconds. For max values in the top 25% of the range have a red background and in the bottom 25% of the range have a green background. The red background is not used when the min value is within 80% of the max value.
| dbms | 256us | 1ms | 4ms | 16ms | 64ms | 256ms | 1s | 4s | 16s | gt | max |
|---|---|---|---|---|---|---|---|---|---|---|---|
| my5651_rel_native_lto.cy10_4g_u | 1.207 | 6.587 | 16.890 | 44.672 | 29.642 | 1.001 | 0.001 | 0.617 | |||
| my5740_rel_native_lto.cy10_4g_u | 2.920 | 16.347 | 48.904 | 29.273 | 2.445 | 0.086 | 0.025 | 0.992 | |||
| my8033_rel_native_lto.cy10_4g_u | 1.035 | 32.842 | 41.683 | 19.831 | 4.292 | 0.240 | 0.076 | nonzero | 1.821 |
Insert response time histogram: each cell has the percentage of responses that take <= the time in the header and max is the max response time in seconds. For max values in the top 25% of the range have a red background and in the bottom 25% of the range have a green background. The red background is not used when the min value is within 80% of the max value.
| dbms | 256us | 1ms | 4ms | 16ms | 64ms | 256ms | 1s | 4s | 16s | gt | max |
|---|---|---|---|---|---|---|---|---|---|---|---|
| my5651_rel_native_lto.cy10_4g_u | 0.006 | 0.088 | 4.141 | 85.950 | 9.815 | 0.842 | |||||
| my5740_rel_native_lto.cy10_4g_u | 0.003 | 5.001 | 81.075 | 12.661 | 1.256 | 0.004 | 1.606 | ||||
| my8033_rel_native_lto.cy10_4g_u | 0.008 | 0.870 | 25.973 | 62.623 | 10.386 | 0.141 | 2.562 |
Delete response time histogram: each cell has the percentage of responses that take <= the time in the header and max is the max response time in seconds. For max values in the top 25% of the range have a red background and in the bottom 25% of the range have a green background. The red background is not used when the min value is within 80% of the max value.
| dbms | 256us | 1ms | 4ms | 16ms | 64ms | 256ms | 1s | 4s | 16s | gt | max |
|---|---|---|---|---|---|---|---|---|---|---|---|
| my5651_rel_native_lto.cy10_4g_u | 0.011 | 0.087 | 4.251 | 86.361 | 9.290 | nonzero | 1.585 | ||||
| my5740_rel_native_lto.cy10_4g_u | 0.006 | 5.585 | 81.093 | 12.281 | 1.032 | 0.003 | 1.552 | ||||
| my8033_rel_native_lto.cy10_4g_u | 0.015 | 0.902 | 26.436 | 62.529 | 10.009 | 0.108 | 3.191 |
Performance metrics for the DBMS listed above. Some are normalized by throughput, others are not. Legend for results is here.
ips	qps	rps	rmbps	wps	wmbps	rpq	rkbpq	wpi	wkbpi	csps	cpups	cspq	cpupq	dbgb1	dbgb2	rss	maxop	p50	p99	tag
6716	1764	99	1.9	27162.4	471.8	0.056	1.120	4.044	71.927	491290	58.2	278.478	26392	119.4	259.8	5.3	0.617	80	48	480m.my5651_rel_native_lto.cy10_4g_u
11901	5825	313	6.1	48821.2	971.7	0.054	1.066	4.102	83.609	557492	48.0	95.710	6593	117.8	256.6	5.2	0.992	256	128	480m.my5740_rel_native_lto.cy10_4g_u
8414	5399	227	4.4	30637.5	784.8	0.042	0.839	3.641	95.509	521663	49.4	96.620	7320	117.6	258.6	4.8	1.821	240	112	480m.my8033_rel_native_lto.cy10_4g_u
q1000.1
q1000.1: range queries with 1000 insert/s per client. Graphs for performance per 1-second interval are here.
Average throughput:
Query response time histogram: each cell has the percentage of responses that take <= the time in the header and max is the max response time in seconds. For max values in the top 25% of the range have a red background and in the bottom 25% of the range have a green background. The red background is not used when the min value is within 80% of the max value.
| dbms | 256us | 1ms | 4ms | 16ms | 64ms | 256ms | 1s | 4s | 16s | gt | max |
|---|---|---|---|---|---|---|---|---|---|---|---|
| my5651_rel_native_lto.cy10_4g_u | 1.175 | 6.496 | 16.684 | 43.818 | 30.534 | 1.292 | 0.001 | 0.602 | |||
| my5740_rel_native_lto.cy10_4g_u | 1.550 | 19.169 | 40.870 | 29.823 | 8.097 | 0.405 | 0.085 | nonzero | 1.748 | ||
| my8033_rel_native_lto.cy10_4g_u | 0.584 | 32.257 | 41.038 | 21.143 | 4.682 | 0.228 | 0.064 | 0.003 | 2.760 |
Insert response time histogram: each cell has the percentage of responses that take <= the time in the header and max is the max response time in seconds. For max values in the top 25% of the range have a red background and in the bottom 25% of the range have a green background. The red background is not used when the min value is within 80% of the max value.
| dbms | 256us | 1ms | 4ms | 16ms | 64ms | 256ms | 1s | 4s | 16s | gt | max |
|---|---|---|---|---|---|---|---|---|---|---|---|
| my5651_rel_native_lto.cy10_4g_u | 0.003 | 0.040 | 4.232 | 83.873 | 11.852 | nonzero | 1.143 | ||||
| my5740_rel_native_lto.cy10_4g_u | nonzero | 0.427 | 40.456 | 52.901 | 6.163 | 0.053 | 2.123 | ||||
| my8033_rel_native_lto.cy10_4g_u | nonzero | 0.234 | 20.804 | 66.553 | 12.093 | 0.315 | 3.994 |
Delete response time histogram: each cell has the percentage of responses that take <= the time in the header and max is the max response time in seconds. For max values in the top 25% of the range have a red background and in the bottom 25% of the range have a green background. The red background is not used when the min value is within 80% of the max value.
| dbms | 256us | 1ms | 4ms | 16ms | 64ms | 256ms | 1s | 4s | 16s | gt | max |
|---|---|---|---|---|---|---|---|---|---|---|---|
| my5651_rel_native_lto.cy10_4g_u | 0.006 | 0.039 | 4.296 | 84.328 | 11.331 | nonzero | 1.003 | ||||
| my5740_rel_native_lto.cy10_4g_u | 0.001 | 0.439 | 41.628 | 52.488 | 5.412 | 0.031 | 2.002 | ||||
| my8033_rel_native_lto.cy10_4g_u | 0.001 | 0.258 | 21.202 | 66.590 | 11.732 | 0.216 | 2.884 |
Performance metrics for the DBMS listed above. Some are normalized by throughput, others are not. Legend for results is here.
ips	qps	rps	rmbps	wps	wmbps	rpq	rkbpq	wpi	wkbpi	csps	cpups	cspq	cpupq	dbgb1	dbgb2	rss	maxop	p50	p99	tag
6570	1704	179	0.8	26812.0	462.5	0.105	0.458	4.081	72.094	490225	58.4	287.674	27416	124.1	269.8	5.3	0.602	64	48	480m.my5651_rel_native_lto.cy10_4g_u
11262	3725	6	0.1	33847.5	763.7	0.001	0.030	3.006	69.445	463692	54.2	124.485	11641	122.9	267.6	5.2	1.748	160	48	480m.my5740_rel_native_lto.cy10_4g_u
7870	5250	3	0.1	30202.3	775.4	0.001	0.020	3.838	100.885	514295	50.1	97.967	7635	122.0	269.0	4.8	2.760	224	80	480m.my8033_rel_native_lto.cy10_4g_u
l.i0
l.i0: load without secondary indexes
Performance metrics for all DBMS, not just the ones listed above. Some are normalized by throughput, others are not. Legend for results is here.
ips	qps	rps	rmbps	wps	wmbps	rpq	rkbpq	wpi	wkbpi	csps	cpups	cspq	cpupq	dbgb1	dbgb2	rss	maxop	p50	p99	tag
480000	0	0	0.0	1469.6	119.6	0.000	0.000	0.003	0.255	77260	38.2	0.161	64	31.8	160.3	4.7	0.096	20579	17682	480m.my5651_rel_native_lto.cy10_4g_u
565371	0	0	0.0	1849.8	142.1	0.000	0.000	0.003	0.257	90151	40.1	0.159	57	31.8	160.3	4.5	0.090	24176	21678	480m.my5740_rel_native_lto.cy10_4g_u
909091	0	0	0.0	3586.3	239.3	0.000	0.000	0.004	0.270	216462	51.3	0.238	45	31.7	160.3	4.8	0.120	39960	34562	480m.my8033_rel_native_lto.cy10_4g_u
l.x
l.x: create secondary indexes
Performance metrics for all DBMS, not just the ones listed above. Some are normalized by throughput, others are not. Legend for results is here.
ips	qps	rps	rmbps	wps	wmbps	rpq	rkbpq	wpi	wkbpi	csps	cpups	cspq	cpupq	dbgb1	dbgb2	rss	maxop	p50	p99	tag
361521	0	0	0.0	16847.9	617.7	0.000	0.000	0.047	1.750	97075	31.0	0.269	69	65.2	193.7	5.3	0.002	NA	NA	480m.my5651_rel_native_lto.cy10_4g_u
2595135	0	1	0.1	23225.7	1987.2	0.000	0.000	0.009	0.784	124631	27.0	0.048	8	70.8	199.3	5.1	0.002	NA	NA	480m.my5740_rel_native_lto.cy10_4g_u
2212442	0	11956	579.9	36888.7	1616.5	0.005	0.268	0.017	0.748	206986	79.5	0.094	29	70.6	199.2	4.8	0.006	NA	NA	480m.my8033_rel_native_lto.cy10_4g_u
l.i1
l.i1: continue load after secondary indexes created
Performance metrics for all DBMS, not just the ones listed above. Some are normalized by throughput, others are not. Legend for results is here.
ips	qps	rps	rmbps	wps	wmbps	rpq	rkbpq	wpi	wkbpi	csps	cpups	cspq	cpupq	dbgb1	dbgb2	rss	maxop	p50	p99	tag
12820	0	268	1.2	38001.4	725.6	0.021	0.100	2.964	57.957	489769	47.4	38.202	2958	116.7	254.1	5.3	1.356	549	150	480m.my5651_rel_native_lto.cy10_4g_u
14332	0	7	0.5	29005.2	775.8	0.000	0.036	2.024	55.432	375300	36.7	26.187	2049	117.5	256.0	5.1	6.573	549	0	480m.my5740_rel_native_lto.cy10_4g_u
12784	0	39	0.7	27681.0	803.1	0.003	0.053	2.165	64.331	554175	36.1	43.350	2259	117.4	256.2	4.8	9.031	0	0	480m.my8033_rel_native_lto.cy10_4g_u
q100.1
q100.1: range queries with 100 insert/s per client
Performance metrics for all DBMS, not just the ones listed above. Some are normalized by throughput, others are not. Legend for results is here.
ips	qps	rps	rmbps	wps	wmbps	rpq	rkbpq	wpi	wkbpi	csps	cpups	cspq	cpupq	dbgb1	dbgb2	rss	maxop	p50	p99	tag
2378	2422	267	4.2	11823.2	275.9	0.110	1.760	4.972	118.820	215899	37.8	89.145	12486	117.0	254.8	5.3	0.358	96	80	480m.my5651_rel_native_lto.cy10_4g_u
2380	13544	56	1.2	58856.4	1069.1	0.004	0.090	24.729	459.968	677403	32.5	50.015	1920	117.5	256.0	5.1	0.203	559	176	480m.my5740_rel_native_lto.cy10_4g_u
2381	22098	67	1.3	58524.8	1120.0	0.003	0.060	24.582	481.733	651404	35.7	29.478	1292	117.4	256.2	4.8	0.526	911	767	480m.my8033_rel_native_lto.cy10_4g_u
q500.1
q500.1: range queries with 500 insert/s per client
Performance metrics for all DBMS, not just the ones listed above. Some are normalized by throughput, others are not. Legend for results is here.
ips	qps	rps	rmbps	wps	wmbps	rpq	rkbpq	wpi	wkbpi	csps	cpups	cspq	cpupq	dbgb1	dbgb2	rss	maxop	p50	p99	tag
6716	1764	99	1.9	27162.4	471.8	0.056	1.120	4.044	71.927	491290	58.2	278.478	26392	119.4	259.8	5.3	0.617	80	48	480m.my5651_rel_native_lto.cy10_4g_u
11901	5825	313	6.1	48821.2	971.7	0.054	1.066	4.102	83.609	557492	48.0	95.710	6593	117.8	256.6	5.2	0.992	256	128	480m.my5740_rel_native_lto.cy10_4g_u
8414	5399	227	4.4	30637.5	784.8	0.042	0.839	3.641	95.509	521663	49.4	96.620	7320	117.6	258.6	4.8	1.821	240	112	480m.my8033_rel_native_lto.cy10_4g_u
q1000.1
q1000.1: range queries with 1000 insert/s per client
Performance metrics for all DBMS, not just the ones listed above. Some are normalized by throughput, others are not. Legend for results is here.
ips	qps	rps	rmbps	wps	wmbps	rpq	rkbpq	wpi	wkbpi	csps	cpups	cspq	cpupq	dbgb1	dbgb2	rss	maxop	p50	p99	tag
6570	1704	179	0.8	26812.0	462.5	0.105	0.458	4.081	72.094	490225	58.4	287.674	27416	124.1	269.8	5.3	0.602	64	48	480m.my5651_rel_native_lto.cy10_4g_u
11262	3725	6	0.1	33847.5	763.7	0.001	0.030	3.006	69.445	463692	54.2	124.485	11641	122.9	267.6	5.2	1.748	160	48	480m.my5740_rel_native_lto.cy10_4g_u
7870	5250	3	0.1	30202.3	775.4	0.001	0.020	3.838	100.885	514295	50.1	97.967	7635	122.0	269.0	4.8	2.760	224	80	480m.my8033_rel_native_lto.cy10_4g_u
l.i0
- l.i0: load without secondary indexes
- Legend for results is here.
- Each entry lists the percentage of responses that fit in that bucket (slower than max time for previous bucket, faster than min time for next bucket).
Insert response time histogram
256us	1ms	4ms	16ms	64ms	256ms	1s	4s	16s	gt	max	tag
0.000	0.324	11.208	88.282	0.143	0.043	0.000	0.000	0.000	0.000	0.096	my5651_rel_native_lto.cy10_4g_u
0.000	0.193	47.744	52.015	0.005	0.043	0.000	0.000	0.000	0.000	0.090	my5740_rel_native_lto.cy10_4g_u
0.000	0.000	99.776	0.176	0.005	0.043	0.000	0.000	0.000	0.000	0.120	my8033_rel_native_lto.cy10_4g_u
l.x
- l.x: create secondary indexes
- Legend for results is here.
- Each entry lists the percentage of responses that fit in that bucket (slower than max time for previous bucket, faster than min time for next bucket).
TODO - determine whether there is data for create index response time
l.i1
- l.i1: continue load after secondary indexes created
- Legend for results is here.
- Each entry lists the percentage of responses that fit in that bucket (slower than max time for previous bucket, faster than min time for next bucket).
Insert response time histogram
256us	1ms	4ms	16ms	64ms	256ms	1s	4s	16s	gt	max	tag
0.000	0.000	0.005	0.087	41.021	54.598	4.289	0.001	0.000	0.000	1.356	my5651_rel_native_lto.cy10_4g_u
0.000	0.000	nonzero	0.831	63.862	30.031	5.138	0.136	0.001	0.000	6.573	my5740_rel_native_lto.cy10_4g_u
0.000	0.000	0.005	5.192	54.899	35.526	4.174	0.146	0.058	0.000	9.031	my8033_rel_native_lto.cy10_4g_u
Delete response time histogram
256us	1ms	4ms	16ms	64ms	256ms	1s	4s	16s	gt	max	tag
0.000	0.000	0.043	0.925	43.624	52.349	3.058	nonzero	0.000	0.000	1.187	my5651_rel_native_lto.cy10_4g_u
0.000	0.000	0.048	2.622	66.272	27.144	3.788	0.126	0.001	0.000	6.532	my5740_rel_native_lto.cy10_4g_u
0.000	0.000	0.071	7.147	56.324	32.697	3.562	0.147	0.052	0.000	8.925	my8033_rel_native_lto.cy10_4g_u
q100.1
- q100.1: range queries with 100 insert/s per client
- Legend for results is here.
- Each entry lists the percentage of responses that fit in that bucket (slower than max time for previous bucket, faster than min time for next bucket).
Query response time histogram
256us	1ms	4ms	16ms	64ms	256ms	1s	4s	16s	gt	max	tag
1.888	9.412	23.727	45.087	19.626	0.261	nonzero	0.000	0.000	0.000	0.358	my5651_rel_native_lto.cy10_4g_u
2.914	33.316	56.957	6.767	0.046	nonzero	0.000	0.000	0.000	0.000	0.203	my5740_rel_native_lto.cy10_4g_u
1.394	56.861	40.574	1.164	0.007	nonzero	nonzero	0.000	0.000	0.000	0.526	my8033_rel_native_lto.cy10_4g_u
Insert response time histogram
256us	1ms	4ms	16ms	64ms	256ms	1s	4s	16s	gt	max	tag
0.000	0.000	0.004	0.762	4.013	47.523	47.698	0.000	0.000	0.000	0.887	my5651_rel_native_lto.cy10_4g_u
0.000	0.000	0.204	96.130	3.624	0.042	0.000	0.000	0.000	0.000	0.213	my5740_rel_native_lto.cy10_4g_u
0.000	0.000	0.140	76.136	23.698	0.025	0.001	0.000	0.000	0.000	0.331	my8033_rel_native_lto.cy10_4g_u
Delete response time histogram
256us	1ms	4ms	16ms	64ms	256ms	1s	4s	16s	gt	max	tag
0.000	0.000	0.010	0.808	4.051	48.238	46.892	0.000	0.000	0.000	0.782	my5651_rel_native_lto.cy10_4g_u
0.000	0.000	0.299	96.501	3.159	0.041	0.000	0.000	0.000	0.000	0.215	my5740_rel_native_lto.cy10_4g_u
0.000	0.000	0.303	78.554	21.122	0.020	0.001	0.000	0.000	0.000	0.391	my8033_rel_native_lto.cy10_4g_u
q500.1
- q500.1: range queries with 500 insert/s per client
- Legend for results is here.
- Each entry lists the percentage of responses that fit in that bucket (slower than max time for previous bucket, faster than min time for next bucket).
Query response time histogram
256us	1ms	4ms	16ms	64ms	256ms	1s	4s	16s	gt	max	tag
1.207	6.587	16.890	44.672	29.642	1.001	0.001	0.000	0.000	0.000	0.617	my5651_rel_native_lto.cy10_4g_u
2.920	16.347	48.904	29.273	2.445	0.086	0.025	0.000	0.000	0.000	0.992	my5740_rel_native_lto.cy10_4g_u
1.035	32.842	41.683	19.831	4.292	0.240	0.076	nonzero	0.000	0.000	1.821	my8033_rel_native_lto.cy10_4g_u
Insert response time histogram
256us	1ms	4ms	16ms	64ms	256ms	1s	4s	16s	gt	max	tag
0.000	0.000	0.006	0.088	4.141	85.950	9.815	0.000	0.000	0.000	0.842	my5651_rel_native_lto.cy10_4g_u
0.000	0.000	0.003	5.001	81.075	12.661	1.256	0.004	0.000	0.000	1.606	my5740_rel_native_lto.cy10_4g_u
0.000	0.000	0.008	0.870	25.973	62.623	10.386	0.141	0.000	0.000	2.562	my8033_rel_native_lto.cy10_4g_u
Delete response time histogram
256us	1ms	4ms	16ms	64ms	256ms	1s	4s	16s	gt	max	tag
0.000	0.000	0.011	0.087	4.251	86.361	9.290	nonzero	0.000	0.000	1.585	my5651_rel_native_lto.cy10_4g_u
0.000	0.000	0.006	5.585	81.093	12.281	1.032	0.003	0.000	0.000	1.552	my5740_rel_native_lto.cy10_4g_u
0.000	0.000	0.015	0.902	26.436	62.529	10.009	0.108	0.000	0.000	3.191	my8033_rel_native_lto.cy10_4g_u
q1000.1
- q1000.1: range queries with 1000 insert/s per client
- Legend for results is here.
- Each entry lists the percentage of responses that fit in that bucket (slower than max time for previous bucket, faster than min time for next bucket).
Query response time histogram
256us	1ms	4ms	16ms	64ms	256ms	1s	4s	16s	gt	max	tag
1.175	6.496	16.684	43.818	30.534	1.292	0.001	0.000	0.000	0.000	0.602	my5651_rel_native_lto.cy10_4g_u
1.550	19.169	40.870	29.823	8.097	0.405	0.085	nonzero	0.000	0.000	1.748	my5740_rel_native_lto.cy10_4g_u
0.584	32.257	41.038	21.143	4.682	0.228	0.064	0.003	0.000	0.000	2.760	my8033_rel_native_lto.cy10_4g_u
Insert response time histogram
256us	1ms	4ms	16ms	64ms	256ms	1s	4s	16s	gt	max	tag
0.000	0.000	0.003	0.040	4.232	83.873	11.852	nonzero	0.000	0.000	1.143	my5651_rel_native_lto.cy10_4g_u
0.000	0.000	nonzero	0.427	40.456	52.901	6.163	0.053	0.000	0.000	2.123	my5740_rel_native_lto.cy10_4g_u
0.000	0.000	nonzero	0.234	20.804	66.553	12.093	0.315	0.000	0.000	3.994	my8033_rel_native_lto.cy10_4g_u
Delete response time histogram
256us	1ms	4ms	16ms	64ms	256ms	1s	4s	16s	gt	max	tag
0.000	0.000	0.006	0.039	4.296	84.328	11.331	nonzero	0.000	0.000	1.003	my5651_rel_native_lto.cy10_4g_u
0.000	0.000	0.001	0.439	41.628	52.488	5.412	0.031	0.000	0.000	2.002	my5740_rel_native_lto.cy10_4g_u
0.000	0.000	0.001	0.258	21.202	66.590	11.732	0.216	0.000	0.000	2.884	my8033_rel_native_lto.cy10_4g_u