Introduction
This is a report for the insert benchmark with 12000M docs and 24 client(s). It is generated by scripts (bash, awk, sed) and Tufte might not be impressed. An overview of the insert benchmark is here and a short update is here. Below, by DBMS, I mean DBMS+version.config. An example is my8020.c10b40 where my means MySQL, 8020 is version 8.0.20 and c10b40 is the name for the configuration file.
The test server has 80 cores with hyperthreads enabled, 256G RAM and fast storage. The benchmark was run with 24 client and there were 1 or 3 connections per client (1 for queries or inserts without rate limits, 1+1 for rate limited inserts+deletes). There are 24 tables, with a client per table. It loads 12000M rows without secondary indexes, creates secondary indexes, then inserts 1200M rows with a delete per insert to avoid growing the table. It then does 3 read+write tests for 3600s each that do queries as fast as possible with 100, 500 and then 1000 inserts/second/client concurrent with the queries and 1000 deletes/second to avoid growing the table. The database is larger than memory
The tested DBMS are:
- fbmy8028_ef5b9b101_jun23_hack.cy9c_u - MyRocks and FB MySQL 8.0.28 from June 2023 at git hash ef5b9b101 with the y9c_u config
- fbmy8028_ef5b9b101_jun23_hack.cy9c1_u - MyRocks and FB MySQL 8.0.28 from June 2023 at git hash ef5b9b101 with the y9c1_u config, adds rocksdb_use_hyper_clock_cache=ON
- fbmy8028_ef5b9b101_jun23_hack.cy9c2_u - MyRocks and FB MySQL 8.0.28 from June 2023 at git hash ef5b9b101 with the y9c2_u config, adds rocksdb_block_cache_numshardbits=4
- fbmy8028_ef5b9b101_jun23_hack.cy9c3_u - MyRocks and FB MySQL 8.0.28 from June 2023 at git hash ef5b9b101 with the y9c3_u config, disables intra-L0 compaction via a hack
- fbmy8028_ef5b9b101_jun23_hack.cy9c4_u - MyRocks and FB MySQL 8.0.28 from June 2023 at git hash ef5b9b101 with the y9c4_u config, reduces level0_slowdown_writes_trigger from 20 to 8 and level0_stop_writes_trigger from 36 to 12
- fbmy8028_ef5b9b101_jun23_hack.cy9c5_u - MyRocks and FB MySQL 8.0.28 from June 2023 at git hash ef5b9b101 with the y9c5_u config, enables subcompactions via rocksdb_max_subcompactions=4
- fbmy8028_ef5b9b101_jun23_hack.cy9c6_u - MyRocks and FB MySQL 8.0.28 from June 2023 at git hash ef5b9b101 with the y9c6_u config, combines c1, c2, c5
- fbmy8028_ef5b9b101_jun23_hack.cy9c7_u - MyRocks and FB MySQL 8.0.28 from June 2023 at git hash ef5b9b101 with the y9c7_u config, combines c1, c5
Contents
- Summary
- l.i0: load without secondary indexes
- l.x: create secondary indexes
- l.i1: continue load after secondary indexes created
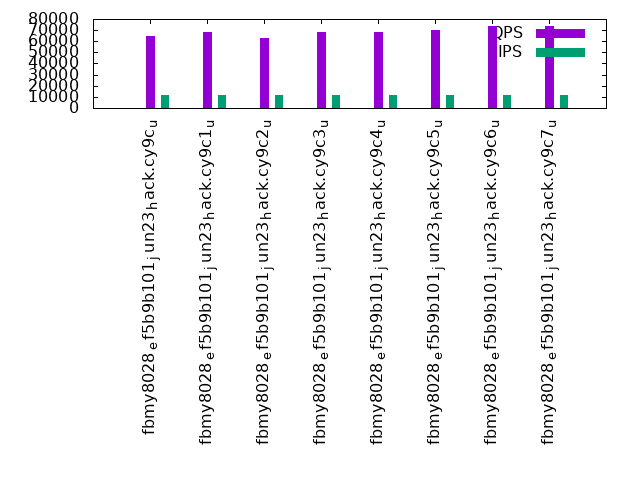
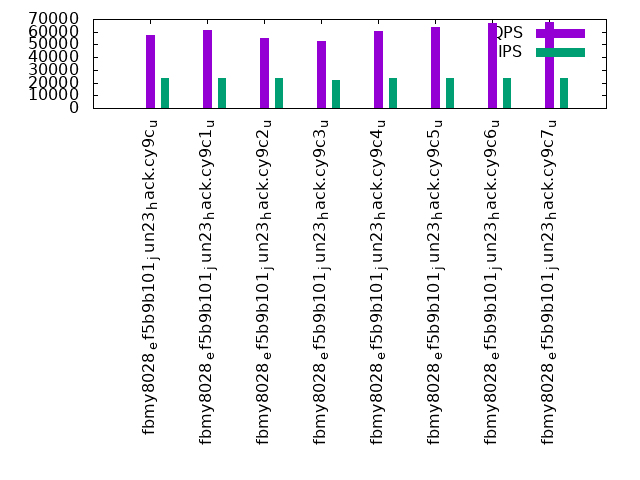
- q100.1: range queries with 100 insert/s per client
- q500.1: range queries with 500 insert/s per client
- q1000.1: range queries with 1000 insert/s per client
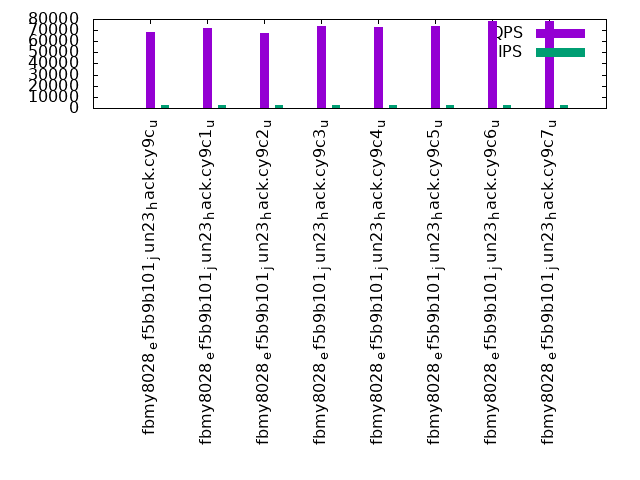
Summary
The numbers are inserts/s for l.i0 and l.i1, indexed docs (or rows) /s for l.x and queries/s for q*.2. The values are the average rate over the entire test for inserts (IPS) and queries (QPS). The range of values for IPS and QPS is split into 3 parts: bottom 25%, middle 50%, top 25%. Values in the bottom 25% have a red background, values in the top 25% have a green background and values in the middle have no color. A gray background is used for values that can be ignored because the DBMS did not sustain the target insert rate. Red backgrounds are not used when the minimum value is within 80% of the max value.
| dbms | l.i0 | l.x | l.i1 | q100.1 | q500.1 | q1000.1 |
|---|---|---|---|---|---|---|
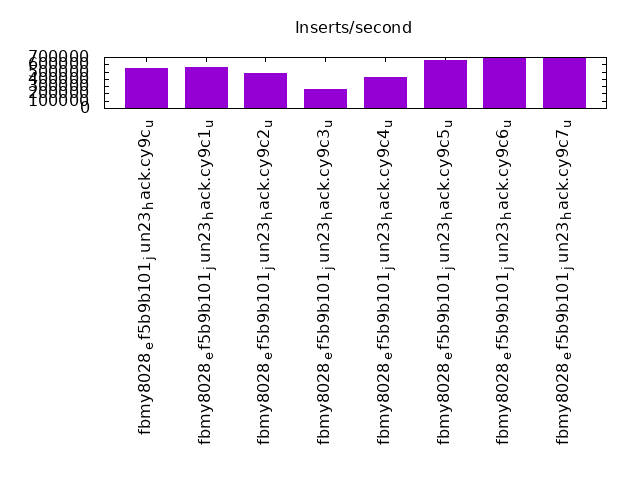
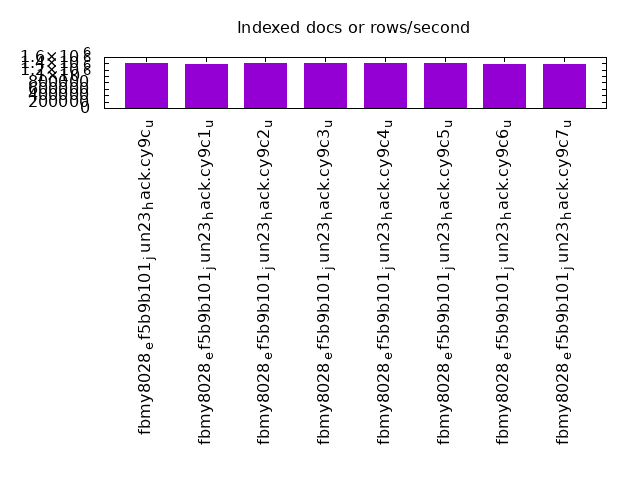
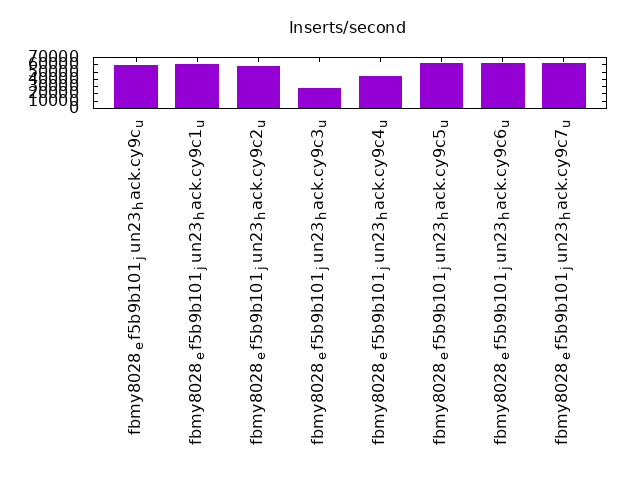
| fbmy8028_ef5b9b101_jun23_hack.cy9c_u | 542594 | 1404013 | 59291 | 68068 | 64585 | 57182 |
| fbmy8028_ef5b9b101_jun23_hack.cy9c1_u | 565904 | 1391477 | 60024 | 72145 | 68639 | 61609 |
| fbmy8028_ef5b9b101_jun23_hack.cy9c2_u | 480000 | 1402700 | 57471 | 67017 | 63342 | 55301 |
| fbmy8028_ef5b9b101_jun23_hack.cy9c3_u | 262916 | 1409620 | 26989 | 73308 | 68064 | 52809 |
| fbmy8028_ef5b9b101_jun23_hack.cy9c4_u | 431934 | 1401553 | 43356 | 73090 | 68150 | 60866 |
| fbmy8028_ef5b9b101_jun23_hack.cy9c5_u | 656347 | 1397961 | 61843 | 73840 | 69845 | 63865 |
| fbmy8028_ef5b9b101_jun23_hack.cy9c6_u | 694565 | 1385373 | 62183 | 78482 | 73566 | 67126 |
| fbmy8028_ef5b9b101_jun23_hack.cy9c7_u | 695572 | 1369093 | 62215 | 78516 | 73612 | 67722 |
This table has relative throughput, throughput for the DBMS relative to the DBMS in the first line, using the absolute throughput from the previous table. Values less than 0.95 have a yellow background. Values greater than 1.05 have a blue background.
| dbms | l.i0 | l.x | l.i1 | q100.1 | q500.1 | q1000.1 |
|---|---|---|---|---|---|---|
| fbmy8028_ef5b9b101_jun23_hack.cy9c_u | 1.00 | 1.00 | 1.00 | 1.00 | 1.00 | 1.00 |
| fbmy8028_ef5b9b101_jun23_hack.cy9c1_u | 1.04 | 0.99 | 1.01 | 1.06 | 1.06 | 1.08 |
| fbmy8028_ef5b9b101_jun23_hack.cy9c2_u | 0.88 | 1.00 | 0.97 | 0.98 | 0.98 | 0.97 |
| fbmy8028_ef5b9b101_jun23_hack.cy9c3_u | 0.48 | 1.00 | 0.46 | 1.08 | 1.05 | 0.92 |
| fbmy8028_ef5b9b101_jun23_hack.cy9c4_u | 0.80 | 1.00 | 0.73 | 1.07 | 1.06 | 1.06 |
| fbmy8028_ef5b9b101_jun23_hack.cy9c5_u | 1.21 | 1.00 | 1.04 | 1.08 | 1.08 | 1.12 |
| fbmy8028_ef5b9b101_jun23_hack.cy9c6_u | 1.28 | 0.99 | 1.05 | 1.15 | 1.14 | 1.17 |
| fbmy8028_ef5b9b101_jun23_hack.cy9c7_u | 1.28 | 0.98 | 1.05 | 1.15 | 1.14 | 1.18 |
This lists the average rate of inserts/s for the tests that do inserts concurrent with queries. For such tests the query rate is listed in the table above. The read+write tests are setup so that the insert rate should match the target rate every second. Cells that are not at least 95% of the target have a red background to indicate a failure to satisfy the target.
| dbms | q100.1 | q500.1 | q1000.1 |
|---|---|---|---|
| fbmy8028_ef5b9b101_jun23_hack.cy9c_u | 2381 | 11907 | 23828 |
| fbmy8028_ef5b9b101_jun23_hack.cy9c1_u | 2381 | 11907 | 23828 |
| fbmy8028_ef5b9b101_jun23_hack.cy9c2_u | 2381 | 11907 | 23828 |
| fbmy8028_ef5b9b101_jun23_hack.cy9c3_u | 2376 | 11881 | 22069 |
| fbmy8028_ef5b9b101_jun23_hack.cy9c4_u | 2374 | 11862 | 23613 |
| fbmy8028_ef5b9b101_jun23_hack.cy9c5_u | 2377 | 11881 | 23749 |
| fbmy8028_ef5b9b101_jun23_hack.cy9c6_u | 2376 | 11875 | 23743 |
| fbmy8028_ef5b9b101_jun23_hack.cy9c7_u | 2376 | 11878 | 23756 |
| target | 2400 | 12000 | 24000 |
l.i0
l.i0: load without secondary indexes. Graphs for performance per 1-second interval are here.
Average throughput:
Insert response time histogram: each cell has the percentage of responses that take <= the time in the header and max is the max response time in seconds. For the max column values in the top 25% of the range have a red background and in the bottom 25% of the range have a green background. The red background is not used when the min value is within 80% of the max value.
| dbms | 256us | 1ms | 4ms | 16ms | 64ms | 256ms | 1s | 4s | 16s | gt | max |
|---|---|---|---|---|---|---|---|---|---|---|---|
| fbmy8028_ef5b9b101_jun23_hack.cy9c_u | 46.529 | 53.421 | 0.007 | 0.042 | nonzero | 0.339 | |||||
| fbmy8028_ef5b9b101_jun23_hack.cy9c1_u | 79.387 | 19.620 | 0.665 | 0.317 | 0.010 | 0.746 | |||||
| fbmy8028_ef5b9b101_jun23_hack.cy9c2_u | 30.556 | 69.395 | 0.007 | 0.041 | nonzero | 0.273 | |||||
| fbmy8028_ef5b9b101_jun23_hack.cy9c3_u | 78.894 | 14.216 | 2.289 | 4.599 | 0.002 | 0.414 | |||||
| fbmy8028_ef5b9b101_jun23_hack.cy9c4_u | 59.658 | 35.706 | 4.585 | 0.051 | nonzero | 0.284 | |||||
| fbmy8028_ef5b9b101_jun23_hack.cy9c5_u | 78.968 | 20.982 | 0.009 | 0.041 | nonzero | 0.264 | |||||
| fbmy8028_ef5b9b101_jun23_hack.cy9c6_u | 86.467 | 13.481 | 0.009 | 0.043 | 0.250 | ||||||
| fbmy8028_ef5b9b101_jun23_hack.cy9c7_u | 86.304 | 13.644 | 0.007 | 0.044 | nonzero | 0.275 |
Performance metrics for the DBMS listed above. Some are normalized by throughput, others are not. Legend for results is here.
ips	qps	rps	rmbps	wps	wmbps	rpq	rkbpq	wpi	wkbpi	csps	cpups	cspq	cpupq	dbgb1	dbgb2	rss	maxop	p50	p99	tag
542594	0	10	0.4	1876.6	119.4	0.000	0.001	0.003	0.225	363766	38.9	0.670	57	375.8	376.3	93.8	0.339	23574	13987	12000m.fbmy8028_ef5b9b101_jun23_hack.cy9c_u
565904	0	1	0.0	2099.5	136.7	0.000	0.000	0.004	0.247	107479	37.3	0.190	53	376.2	378.1	104.8	0.746	27272	400	12000m.fbmy8028_ef5b9b101_jun23_hack.cy9c1_u
480000	0	6	0.2	1626.0	103.5	0.000	0.000	0.003	0.221	431328	35.4	0.899	59	374.8	375.6	90.8	0.273	21079	10889	12000m.fbmy8028_ef5b9b101_jun23_hack.cy9c2_u
262916	0	5	0.2	1097.3	68.8	0.000	0.001	0.004	0.268	63004	17.7	0.240	54	374.9	375.3	118.8	0.414	1599	499	12000m.fbmy8028_ef5b9b101_jun23_hack.cy9c3_u
431934	0	12	0.4	1454.9	92.2	0.000	0.001	0.003	0.219	218353	28.4	0.506	53	375.0	375.9	89.8	0.284	20779	2497	12000m.fbmy8028_ef5b9b101_jun23_hack.cy9c4_u
656347	0	5	0.2	2309.0	148.2	0.000	0.000	0.004	0.231	210764	41.2	0.321	50	376.1	377.9	97.5	0.264	27572	21082	12000m.fbmy8028_ef5b9b101_jun23_hack.cy9c5_u
694565	0	11	0.4	2416.4	156.0	0.000	0.001	0.003	0.230	132319	40.8	0.191	47	376.3	377.9	98.3	0.250	29271	24476	12000m.fbmy8028_ef5b9b101_jun23_hack.cy9c6_u
695572	0	12	0.4	2409.9	156.9	0.000	0.001	0.003	0.231	132417	40.8	0.190	47	376.4	378.0	97.9	0.275	29071	24376	12000m.fbmy8028_ef5b9b101_jun23_hack.cy9c7_u
l.x
l.x: create secondary indexes.
Average throughput:
Performance metrics for the DBMS listed above. Some are normalized by throughput, others are not. Legend for results is here.
ips	qps	rps	rmbps	wps	wmbps	rpq	rkbpq	wpi	wkbpi	csps	cpups	cspq	cpupq	dbgb1	dbgb2	rss	maxop	p50	p99	tag
1404013	0	2574	146.8	1733.6	102.8	0.002	0.107	0.001	0.075	30896	29.8	0.022	17	771.3	771.8	185.3	0.003	NA	NA	12000m.fbmy8028_ef5b9b101_jun23_hack.cy9c_u
1391477	0	2716	163.4	1733.0	101.5	0.002	0.120	0.001	0.075	30408	29.8	0.022	17	772.0	773.8	191.3	0.003	NA	NA	12000m.fbmy8028_ef5b9b101_jun23_hack.cy9c1_u
1402700	0	2564	146.4	1734.5	99.4	0.002	0.107	0.001	0.073	31494	29.9	0.022	17	770.4	771.2	185.9	0.004	NA	NA	12000m.fbmy8028_ef5b9b101_jun23_hack.cy9c2_u
1409620	0	2580	146.9	1755.0	105.9	0.002	0.107	0.001	0.077	30365	29.9	0.022	17	771.8	772.2	183.3	0.003	NA	NA	12000m.fbmy8028_ef5b9b101_jun23_hack.cy9c3_u
1401553	0	2569	145.8	1737.5	100.4	0.002	0.107	0.001	0.073	30887	29.8	0.022	17	770.7	771.6	186.5	0.007	NA	NA	12000m.fbmy8028_ef5b9b101_jun23_hack.cy9c4_u
1397961	0	2569	145.7	1744.5	102.6	0.002	0.107	0.001	0.075	30185	29.6	0.022	17	771.7	773.5	188.0	0.004	NA	NA	12000m.fbmy8028_ef5b9b101_jun23_hack.cy9c5_u
1385373	0	2721	161.1	1725.8	100.0	0.002	0.119	0.001	0.074	32433	29.9	0.023	17	772.0	773.6	191.3	0.004	NA	NA	12000m.fbmy8028_ef5b9b101_jun23_hack.cy9c6_u
1369093	0	2670	158.0	1706.9	98.2	0.002	0.118	0.001	0.073	31226	29.5	0.023	17	772.0	773.6	191.3	0.007	NA	NA	12000m.fbmy8028_ef5b9b101_jun23_hack.cy9c7_u
l.i1
l.i1: continue load after secondary indexes created. Graphs for performance per 1-second interval are here.
Average throughput:
Insert response time histogram: each cell has the percentage of responses that take <= the time in the header and max is the max response time in seconds. For the max column values in the top 25% of the range have a red background and in the bottom 25% of the range have a green background. The red background is not used when the min value is within 80% of the max value.
| dbms | 256us | 1ms | 4ms | 16ms | 64ms | 256ms | 1s | 4s | 16s | gt | max |
|---|---|---|---|---|---|---|---|---|---|---|---|
| fbmy8028_ef5b9b101_jun23_hack.cy9c_u | 0.026 | 17.099 | 82.285 | 0.485 | 0.104 | 0.001 | 1.169 | ||||
| fbmy8028_ef5b9b101_jun23_hack.cy9c1_u | 0.029 | 20.371 | 79.001 | 0.452 | 0.145 | 0.002 | 1.516 | ||||
| fbmy8028_ef5b9b101_jun23_hack.cy9c2_u | 0.030 | 15.196 | 84.013 | 0.605 | 0.156 | nonzero | 1.120 | ||||
| fbmy8028_ef5b9b101_jun23_hack.cy9c3_u | 0.029 | 14.678 | 71.485 | 10.580 | 3.226 | 0.001 | 1.149 | ||||
| fbmy8028_ef5b9b101_jun23_hack.cy9c4_u | 0.015 | 15.212 | 78.193 | 6.506 | 0.064 | 0.008 | 0.001 | 9.545 | |||
| fbmy8028_ef5b9b101_jun23_hack.cy9c5_u | 0.026 | 17.647 | 82.310 | 0.016 | 0.184 | ||||||
| fbmy8028_ef5b9b101_jun23_hack.cy9c6_u | 0.028 | 18.258 | 81.699 | 0.015 | 0.155 | ||||||
| fbmy8028_ef5b9b101_jun23_hack.cy9c7_u | 0.028 | 18.402 | 81.556 | 0.015 | 0.207 |
Delete response time histogram: each cell has the percentage of responses that take <= the time in the header and max is the max response time in seconds. For the max column values in the top 25% of the range have a red background and in the bottom 25% of the range have a green background. The red background is not used when the min value is within 80% of the max value.
| dbms | 256us | 1ms | 4ms | 16ms | 64ms | 256ms | 1s | 4s | 16s | gt | max |
|---|---|---|---|---|---|---|---|---|---|---|---|
| fbmy8028_ef5b9b101_jun23_hack.cy9c_u | 0.027 | 16.768 | 82.613 | 0.487 | 0.105 | 0.001 | 1.169 | ||||
| fbmy8028_ef5b9b101_jun23_hack.cy9c1_u | 0.030 | 19.806 | 79.562 | 0.455 | 0.145 | 0.002 | 1.516 | ||||
| fbmy8028_ef5b9b101_jun23_hack.cy9c2_u | 0.030 | 15.044 | 84.162 | 0.607 | 0.156 | nonzero | 1.120 | ||||
| fbmy8028_ef5b9b101_jun23_hack.cy9c3_u | 0.029 | 14.098 | 72.059 | 10.586 | 3.227 | 0.001 | 1.149 | ||||
| fbmy8028_ef5b9b101_jun23_hack.cy9c4_u | 0.015 | 14.929 | 78.465 | 6.517 | 0.064 | 0.009 | 0.001 | 9.545 | |||
| fbmy8028_ef5b9b101_jun23_hack.cy9c5_u | 0.027 | 17.146 | 82.809 | 0.017 | 0.245 | ||||||
| fbmy8028_ef5b9b101_jun23_hack.cy9c6_u | 0.029 | 17.665 | 82.290 | 0.016 | 0.156 | ||||||
| fbmy8028_ef5b9b101_jun23_hack.cy9c7_u | 0.028 | 17.713 | 82.243 | 0.016 | 0.208 |
Performance metrics for the DBMS listed above. Some are normalized by throughput, others are not. Legend for results is here.
ips	qps	rps	rmbps	wps	wmbps	rpq	rkbpq	wpi	wkbpi	csps	cpups	cspq	cpupq	dbgb1	dbgb2	rss	maxop	p50	p99	tag
59291	0	646	14.6	1611.9	101.0	0.011	0.253	0.027	1.745	160810	19.2	2.712	259	851.1	852.4	180.1	1.169	2597	150	12000m.fbmy8028_ef5b9b101_jun23_hack.cy9c_u
60024	0	677	17.8	1648.8	103.3	0.011	0.304	0.027	1.761	75379	17.4	1.256	232	844.2	845.2	185.7	1.516	2647	100	12000m.fbmy8028_ef5b9b101_jun23_hack.cy9c1_u
57471	0	620	14.1	1540.3	98.0	0.011	0.251	0.027	1.746	243540	20.1	4.238	280	849.5	851.2	180.5	1.120	2597	100	12000m.fbmy8028_ef5b9b101_jun23_hack.cy9c2_u
26989	0	341	6.9	832.3	49.8	0.013	0.262	0.031	1.888	51680	9.2	1.915	273	846.6	847.8	178.4	1.149	500	50	12000m.fbmy8028_ef5b9b101_jun23_hack.cy9c3_u
43356	0	570	11.7	1303.5	75.2	0.013	0.276	0.030	1.776	106159	14.0	2.449	258	844.6	846.3	180.6	9.545	2197	100	12000m.fbmy8028_ef5b9b101_jun23_hack.cy9c4_u
61843	0	768	15.7	1848.6	107.8	0.012	0.259	0.030	1.784	118145	19.0	1.910	246	843.4	844.2	182.1	0.184	2597	1998	12000m.fbmy8028_ef5b9b101_jun23_hack.cy9c5_u
62183	0	778	18.0	1857.8	105.7	0.013	0.297	0.030	1.741	79118	18.1	1.272	233	844.8	845.5	185.5	0.155	2598	1998	12000m.fbmy8028_ef5b9b101_jun23_hack.cy9c6_u
62215	0	798	18.3	1862.9	107.6	0.013	0.301	0.030	1.772	79203	18.2	1.273	234	845.7	846.4	185.4	0.207	2647	1948	12000m.fbmy8028_ef5b9b101_jun23_hack.cy9c7_u
q100.1
q100.1: range queries with 100 insert/s per client. Graphs for performance per 1-second interval are here.
Average throughput:
Query response time histogram: each cell has the percentage of responses that take <= the time in the header and max is the max response time in seconds. For max values in the top 25% of the range have a red background and in the bottom 25% of the range have a green background. The red background is not used when the min value is within 80% of the max value.
| dbms | 256us | 1ms | 4ms | 16ms | 64ms | 256ms | 1s | 4s | 16s | gt | max |
|---|---|---|---|---|---|---|---|---|---|---|---|
| fbmy8028_ef5b9b101_jun23_hack.cy9c_u | 29.762 | 69.665 | 0.567 | 0.005 | nonzero | 0.001 | nonzero | 0.257 | |||
| fbmy8028_ef5b9b101_jun23_hack.cy9c1_u | 40.338 | 59.215 | 0.442 | 0.005 | nonzero | nonzero | 0.093 | ||||
| fbmy8028_ef5b9b101_jun23_hack.cy9c2_u | 26.909 | 72.512 | 0.573 | 0.005 | nonzero | nonzero | nonzero | 0.304 | |||
| fbmy8028_ef5b9b101_jun23_hack.cy9c3_u | 28.035 | 71.886 | 0.070 | 0.004 | 0.005 | nonzero | 0.082 | ||||
| fbmy8028_ef5b9b101_jun23_hack.cy9c4_u | 28.465 | 71.472 | 0.053 | 0.002 | 0.007 | 0.001 | 0.083 | ||||
| fbmy8028_ef5b9b101_jun23_hack.cy9c5_u | 29.108 | 70.796 | 0.087 | 0.007 | 0.002 | nonzero | 0.073 | ||||
| fbmy8028_ef5b9b101_jun23_hack.cy9c6_u | 39.865 | 60.035 | 0.092 | 0.007 | 0.001 | 0.046 | |||||
| fbmy8028_ef5b9b101_jun23_hack.cy9c7_u | 39.582 | 60.329 | 0.081 | 0.007 | 0.001 | 0.024 |
Insert response time histogram: each cell has the percentage of responses that take <= the time in the header and max is the max response time in seconds. For max values in the top 25% of the range have a red background and in the bottom 25% of the range have a green background. The red background is not used when the min value is within 80% of the max value.
| dbms | 256us | 1ms | 4ms | 16ms | 64ms | 256ms | 1s | 4s | 16s | gt | max |
|---|---|---|---|---|---|---|---|---|---|---|---|
| fbmy8028_ef5b9b101_jun23_hack.cy9c_u | 99.078 | 0.919 | 0.003 | 0.001 | 0.080 | ||||||
| fbmy8028_ef5b9b101_jun23_hack.cy9c1_u | 99.793 | 0.205 | 0.001 | 0.018 | |||||||
| fbmy8028_ef5b9b101_jun23_hack.cy9c2_u | 99.802 | 0.171 | 0.006 | 0.017 | 0.003 | 0.301 | |||||
| fbmy8028_ef5b9b101_jun23_hack.cy9c3_u | 99.677 | 0.238 | 0.085 | 0.049 | |||||||
| fbmy8028_ef5b9b101_jun23_hack.cy9c4_u | 99.678 | 0.201 | 0.120 | 0.001 | 0.078 | ||||||
| fbmy8028_ef5b9b101_jun23_hack.cy9c5_u | 99.733 | 0.237 | 0.031 | 0.047 | |||||||
| fbmy8028_ef5b9b101_jun23_hack.cy9c6_u | 99.770 | 0.202 | 0.028 | 0.025 | |||||||
| fbmy8028_ef5b9b101_jun23_hack.cy9c7_u | 99.734 | 0.227 | 0.038 | 0.021 |
Delete response time histogram: each cell has the percentage of responses that take <= the time in the header and max is the max response time in seconds. For max values in the top 25% of the range have a red background and in the bottom 25% of the range have a green background. The red background is not used when the min value is within 80% of the max value.
| dbms | 256us | 1ms | 4ms | 16ms | 64ms | 256ms | 1s | 4s | 16s | gt | max |
|---|---|---|---|---|---|---|---|---|---|---|---|
| fbmy8028_ef5b9b101_jun23_hack.cy9c_u | 99.359 | 0.634 | 0.006 | 0.001 | 0.081 | ||||||
| fbmy8028_ef5b9b101_jun23_hack.cy9c1_u | 99.861 | 0.138 | 0.001 | 0.025 | |||||||
| fbmy8028_ef5b9b101_jun23_hack.cy9c2_u | 99.828 | 0.127 | 0.011 | 0.032 | 0.002 | 0.305 | |||||
| fbmy8028_ef5b9b101_jun23_hack.cy9c3_u | 99.656 | 0.248 | 0.094 | 0.003 | 0.080 | ||||||
| fbmy8028_ef5b9b101_jun23_hack.cy9c4_u | 99.646 | 0.217 | 0.134 | 0.002 | 0.081 | ||||||
| fbmy8028_ef5b9b101_jun23_hack.cy9c5_u | 99.743 | 0.222 | 0.035 | 0.047 | |||||||
| fbmy8028_ef5b9b101_jun23_hack.cy9c6_u | 99.762 | 0.210 | 0.028 | 0.028 | |||||||
| fbmy8028_ef5b9b101_jun23_hack.cy9c7_u | 99.741 | 0.223 | 0.036 | 0.021 |
Performance metrics for the DBMS listed above. Some are normalized by throughput, others are not. Legend for results is here.
ips	qps	rps	rmbps	wps	wmbps	rpq	rkbpq	wpi	wkbpi	csps	cpups	cspq	cpupq	dbgb1	dbgb2	rss	maxop	p50	p99	tag
2381	68068	4873	46.3	153.2	8.8	0.072	0.696	0.064	3.768	289164	31.8	4.248	374	841.6	842.8	184.7	0.257	3133	1886	12000m.fbmy8028_ef5b9b101_jun23_hack.cy9c_u
2381	72145	4458	42.6	149.5	8.3	0.062	0.604	0.063	3.590	304606	31.9	4.222	354	841.7	842.4	186.5	0.093	3182	1918	12000m.fbmy8028_ef5b9b101_jun23_hack.cy9c1_u
2381	67017	4918	46.6	154.8	8.6	0.073	0.713	0.065	3.680	286762	31.8	4.279	380	841.7	843.2	184.7	0.304	3021	1855	12000m.fbmy8028_ef5b9b101_jun23_hack.cy9c2_u
2376	73308	2686	25.8	114.4	6.2	0.037	0.360	0.048	2.665	306675	31.9	4.183	348	841.2	842.3	182.6	0.082	3100	2126	12000m.fbmy8028_ef5b9b101_jun23_hack.cy9c3_u
2374	73090	2761	26.0	98.9	5.2	0.038	0.365	0.042	2.260	306235	31.8	4.190	348	840.6	842.2	183.3	0.083	3054	2046	12000m.fbmy8028_ef5b9b101_jun23_hack.cy9c4_u
2377	73840	2708	25.8	111.5	6.0	0.037	0.358	0.047	2.601	308701	32.0	4.181	347	839.3	839.9	182.8	0.073	3181	1998	12000m.fbmy8028_ef5b9b101_jun23_hack.cy9c5_u
2376	78482	2857	27.1	113.1	5.6	0.036	0.353	0.048	2.431	326504	31.8	4.160	324	840.6	841.1	185.6	0.046	3388	2206	12000m.fbmy8028_ef5b9b101_jun23_hack.cy9c6_u
2376	78516	2728	26.3	112.0	5.8	0.035	0.344	0.047	2.487	326601	31.9	4.160	325	840.6	841.1	185.6	0.024	3276	2046	12000m.fbmy8028_ef5b9b101_jun23_hack.cy9c7_u
q500.1
q500.1: range queries with 500 insert/s per client. Graphs for performance per 1-second interval are here.
Average throughput:
Query response time histogram: each cell has the percentage of responses that take <= the time in the header and max is the max response time in seconds. For max values in the top 25% of the range have a red background and in the bottom 25% of the range have a green background. The red background is not used when the min value is within 80% of the max value.
| dbms | 256us | 1ms | 4ms | 16ms | 64ms | 256ms | 1s | 4s | 16s | gt | max |
|---|---|---|---|---|---|---|---|---|---|---|---|
| fbmy8028_ef5b9b101_jun23_hack.cy9c_u | 16.460 | 83.499 | 0.024 | 0.016 | nonzero | 0.061 | |||||
| fbmy8028_ef5b9b101_jun23_hack.cy9c1_u | 27.503 | 72.458 | 0.022 | 0.018 | nonzero | 0.049 | |||||
| fbmy8028_ef5b9b101_jun23_hack.cy9c2_u | 12.884 | 87.075 | 0.025 | 0.016 | nonzero | 0.047 | |||||
| fbmy8028_ef5b9b101_jun23_hack.cy9c3_u | 16.421 | 83.509 | 0.038 | 0.010 | 0.022 | 0.051 | |||||
| fbmy8028_ef5b9b101_jun23_hack.cy9c4_u | 18.312 | 81.615 | 0.033 | 0.012 | 0.028 | nonzero | 0.106 | ||||
| fbmy8028_ef5b9b101_jun23_hack.cy9c5_u | 20.601 | 79.323 | 0.043 | 0.025 | 0.008 | 0.048 | |||||
| fbmy8028_ef5b9b101_jun23_hack.cy9c6_u | 29.227 | 70.703 | 0.040 | 0.023 | 0.007 | 0.045 | |||||
| fbmy8028_ef5b9b101_jun23_hack.cy9c7_u | 29.175 | 70.751 | 0.041 | 0.023 | 0.009 | 0.038 |
Insert response time histogram: each cell has the percentage of responses that take <= the time in the header and max is the max response time in seconds. For max values in the top 25% of the range have a red background and in the bottom 25% of the range have a green background. The red background is not used when the min value is within 80% of the max value.
| dbms | 256us | 1ms | 4ms | 16ms | 64ms | 256ms | 1s | 4s | 16s | gt | max |
|---|---|---|---|---|---|---|---|---|---|---|---|
| fbmy8028_ef5b9b101_jun23_hack.cy9c_u | 50.965 | 48.988 | 0.047 | 0.037 | |||||||
| fbmy8028_ef5b9b101_jun23_hack.cy9c1_u | 44.485 | 55.477 | 0.037 | 0.001 | 0.093 | ||||||
| fbmy8028_ef5b9b101_jun23_hack.cy9c2_u | 31.115 | 67.797 | 1.087 | 0.036 | |||||||
| fbmy8028_ef5b9b101_jun23_hack.cy9c3_u | 97.085 | 2.699 | 0.216 | 0.052 | |||||||
| fbmy8028_ef5b9b101_jun23_hack.cy9c4_u | 99.360 | 0.396 | 0.241 | 0.003 | 0.100 | ||||||
| fbmy8028_ef5b9b101_jun23_hack.cy9c5_u | 95.902 | 3.934 | 0.164 | 0.032 | |||||||
| fbmy8028_ef5b9b101_jun23_hack.cy9c6_u | 99.612 | 0.281 | 0.106 | 0.030 | |||||||
| fbmy8028_ef5b9b101_jun23_hack.cy9c7_u | 98.056 | 1.786 | 0.158 | 0.041 |
Delete response time histogram: each cell has the percentage of responses that take <= the time in the header and max is the max response time in seconds. For max values in the top 25% of the range have a red background and in the bottom 25% of the range have a green background. The red background is not used when the min value is within 80% of the max value.
| dbms | 256us | 1ms | 4ms | 16ms | 64ms | 256ms | 1s | 4s | 16s | gt | max |
|---|---|---|---|---|---|---|---|---|---|---|---|
| fbmy8028_ef5b9b101_jun23_hack.cy9c_u | 53.705 | 46.245 | 0.049 | nonzero | 0.074 | ||||||
| fbmy8028_ef5b9b101_jun23_hack.cy9c1_u | 47.411 | 52.549 | 0.039 | 0.001 | 0.093 | ||||||
| fbmy8028_ef5b9b101_jun23_hack.cy9c2_u | 33.168 | 65.782 | 1.050 | 0.063 | |||||||
| fbmy8028_ef5b9b101_jun23_hack.cy9c3_u | 96.852 | 2.921 | 0.227 | 0.052 | |||||||
| fbmy8028_ef5b9b101_jun23_hack.cy9c4_u | 99.301 | 0.444 | 0.253 | 0.002 | 0.102 | ||||||
| fbmy8028_ef5b9b101_jun23_hack.cy9c5_u | 95.922 | 3.915 | 0.163 | 0.033 | |||||||
| fbmy8028_ef5b9b101_jun23_hack.cy9c6_u | 99.614 | 0.277 | 0.108 | 0.032 | |||||||
| fbmy8028_ef5b9b101_jun23_hack.cy9c7_u | 98.146 | 1.689 | 0.165 | 0.041 |
Performance metrics for the DBMS listed above. Some are normalized by throughput, others are not. Legend for results is here.
ips	qps	rps	rmbps	wps	wmbps	rpq	rkbpq	wpi	wkbpi	csps	cpups	cspq	cpupq	dbgb1	dbgb2	rss	maxop	p50	p99	tag
11907	64585	1661	21.3	428.3	24.2	0.026	0.338	0.036	2.077	275265	34.4	4.262	426	842.6	843.0	186.6	0.061	2878	2525	12000m.fbmy8028_ef5b9b101_jun23_hack.cy9c_u
11907	68639	1501	20.6	427.1	23.6	0.022	0.307	0.036	2.027	290322	34.2	4.230	399	842.5	844.6	188.6	0.049	3053	2669	12000m.fbmy8028_ef5b9b101_jun23_hack.cy9c1_u
11907	63342	1496	19.9	425.0	23.1	0.024	0.322	0.036	1.990	275113	34.5	4.343	436	843.8	844.5	186.7	0.047	2797	2446	12000m.fbmy8028_ef5b9b101_jun23_hack.cy9c2_u
11881	68064	403	9.8	402.7	21.9	0.006	0.148	0.034	1.884	287792	34.1	4.228	401	842.6	842.9	186.0	0.051	2877	2174	12000m.fbmy8028_ef5b9b101_jun23_hack.cy9c3_u
11862	68150	375	10.3	431.5	23.2	0.006	0.155	0.036	2.006	287877	34.0	4.224	399	841.4	842.3	186.2	0.106	2861	2078	12000m.fbmy8028_ef5b9b101_jun23_hack.cy9c4_u
11881	69845	350	8.4	390.2	21.4	0.005	0.124	0.033	1.848	294383	34.0	4.215	389	842.0	843.9	186.0	0.048	2989	2222	12000m.fbmy8028_ef5b9b101_jun23_hack.cy9c5_u
11875	73566	452	10.1	417.7	22.1	0.006	0.141	0.035	1.910	308436	34.2	4.193	372	841.6	843.4	188.1	0.045	3165	2318	12000m.fbmy8028_ef5b9b101_jun23_hack.cy9c6_u
11878	73612	429	10.0	407.1	22.4	0.006	0.139	0.034	1.935	308845	34.1	4.196	371	842.0	843.8	188.4	0.038	3069	2270	12000m.fbmy8028_ef5b9b101_jun23_hack.cy9c7_u
q1000.1
q1000.1: range queries with 1000 insert/s per client. Graphs for performance per 1-second interval are here.
Average throughput:
Query response time histogram: each cell has the percentage of responses that take <= the time in the header and max is the max response time in seconds. For max values in the top 25% of the range have a red background and in the bottom 25% of the range have a green background. The red background is not used when the min value is within 80% of the max value.
| dbms | 256us | 1ms | 4ms | 16ms | 64ms | 256ms | 1s | 4s | 16s | gt | max |
|---|---|---|---|---|---|---|---|---|---|---|---|
| fbmy8028_ef5b9b101_jun23_hack.cy9c_u | 3.414 | 96.432 | 0.116 | 0.038 | nonzero | nonzero | 0.135 | ||||
| fbmy8028_ef5b9b101_jun23_hack.cy9c1_u | 11.559 | 88.329 | 0.072 | 0.040 | nonzero | nonzero | 0.109 | ||||
| fbmy8028_ef5b9b101_jun23_hack.cy9c2_u | 1.837 | 97.923 | 0.199 | 0.040 | nonzero | nonzero | 0.069 | ||||
| fbmy8028_ef5b9b101_jun23_hack.cy9c3_u | 0.204 | 99.675 | 0.069 | 0.013 | 0.040 | nonzero | 0.084 | ||||
| fbmy8028_ef5b9b101_jun23_hack.cy9c4_u | 6.151 | 93.740 | 0.036 | 0.029 | 0.043 | 0.001 | 0.120 | ||||
| fbmy8028_ef5b9b101_jun23_hack.cy9c5_u | 10.172 | 89.739 | 0.050 | 0.014 | 0.025 | nonzero | 0.068 | ||||
| fbmy8028_ef5b9b101_jun23_hack.cy9c6_u | 17.163 | 82.751 | 0.049 | 0.014 | 0.023 | nonzero | 0.070 | ||||
| fbmy8028_ef5b9b101_jun23_hack.cy9c7_u | 18.357 | 81.560 | 0.045 | 0.011 | 0.027 | nonzero | 0.097 |
Insert response time histogram: each cell has the percentage of responses that take <= the time in the header and max is the max response time in seconds. For max values in the top 25% of the range have a red background and in the bottom 25% of the range have a green background. The red background is not used when the min value is within 80% of the max value.
| dbms | 256us | 1ms | 4ms | 16ms | 64ms | 256ms | 1s | 4s | 16s | gt | max |
|---|---|---|---|---|---|---|---|---|---|---|---|
| fbmy8028_ef5b9b101_jun23_hack.cy9c_u | 4.425 | 26.591 | 68.985 | 0.061 | |||||||
| fbmy8028_ef5b9b101_jun23_hack.cy9c1_u | 6.733 | 42.209 | 51.057 | 0.001 | 0.080 | ||||||
| fbmy8028_ef5b9b101_jun23_hack.cy9c2_u | 4.679 | 21.764 | 73.554 | 0.003 | 0.101 | ||||||
| fbmy8028_ef5b9b101_jun23_hack.cy9c3_u | 23.068 | 36.724 | 35.111 | 4.895 | 0.202 | 0.379 | |||||
| fbmy8028_ef5b9b101_jun23_hack.cy9c4_u | 23.444 | 59.068 | 16.851 | 0.617 | 0.013 | 0.007 | 1.854 | ||||
| fbmy8028_ef5b9b101_jun23_hack.cy9c5_u | 23.382 | 75.981 | 0.635 | 0.002 | 0.076 | ||||||
| fbmy8028_ef5b9b101_jun23_hack.cy9c6_u | 14.495 | 80.315 | 5.188 | 0.002 | 0.091 | ||||||
| fbmy8028_ef5b9b101_jun23_hack.cy9c7_u | 27.100 | 71.411 | 1.484 | 0.006 | 0.112 |
Delete response time histogram: each cell has the percentage of responses that take <= the time in the header and max is the max response time in seconds. For max values in the top 25% of the range have a red background and in the bottom 25% of the range have a green background. The red background is not used when the min value is within 80% of the max value.
| dbms | 256us | 1ms | 4ms | 16ms | 64ms | 256ms | 1s | 4s | 16s | gt | max |
|---|---|---|---|---|---|---|---|---|---|---|---|
| fbmy8028_ef5b9b101_jun23_hack.cy9c_u | 4.539 | 26.483 | 68.978 | nonzero | 0.123 | ||||||
| fbmy8028_ef5b9b101_jun23_hack.cy9c1_u | 6.840 | 42.092 | 51.066 | 0.002 | 0.132 | ||||||
| fbmy8028_ef5b9b101_jun23_hack.cy9c2_u | 4.781 | 21.734 | 73.482 | 0.003 | 0.189 | ||||||
| fbmy8028_ef5b9b101_jun23_hack.cy9c3_u | 22.492 | 37.154 | 35.254 | 4.898 | 0.201 | 0.379 | |||||
| fbmy8028_ef5b9b101_jun23_hack.cy9c4_u | 22.948 | 59.466 | 16.947 | 0.619 | 0.013 | 0.007 | 2.053 | ||||
| fbmy8028_ef5b9b101_jun23_hack.cy9c5_u | 23.186 | 76.168 | 0.644 | 0.002 | 0.076 | ||||||
| fbmy8028_ef5b9b101_jun23_hack.cy9c6_u | 14.214 | 80.574 | 5.209 | 0.003 | 0.091 | ||||||
| fbmy8028_ef5b9b101_jun23_hack.cy9c7_u | 26.655 | 71.841 | 1.497 | 0.006 | 0.112 |
Performance metrics for the DBMS listed above. Some are normalized by throughput, others are not. Legend for results is here.
ips	qps	rps	rmbps	wps	wmbps	rpq	rkbpq	wpi	wkbpi	csps	cpups	cspq	cpupq	dbgb1	dbgb2	rss	maxop	p50	p99	tag
23828	57182	2680	36.9	832.9	48.5	0.047	0.661	0.035	2.085	270808	38.7	4.736	541	844.0	844.9	187.5	0.135	2478	2142	12000m.fbmy8028_ef5b9b101_jun23_hack.cy9c_u
23828	61609	2514	36.8	832.0	41.6	0.041	0.612	0.035	1.787	276036	38.1	4.480	495	844.6	845.1	189.1	0.109	2717	2318	12000m.fbmy8028_ef5b9b101_jun23_hack.cy9c1_u
23828	55301	2519	36.9	835.4	40.8	0.046	0.683	0.035	1.753	290231	39.2	5.248	567	844.5	845.8	187.5	0.069	2414	2078	12000m.fbmy8028_ef5b9b101_jun23_hack.cy9c2_u
22069	52809	597	13.2	753.4	40.1	0.011	0.257	0.034	1.862	242518	37.6	4.592	570	843.9	844.8	187.4	0.084	2206	1423	12000m.fbmy8028_ef5b9b101_jun23_hack.cy9c3_u
23613	60866	580	14.3	811.0	42.7	0.010	0.240	0.034	1.853	275919	37.3	4.533	490	844.1	845.4	187.2	0.120	2573	1518	12000m.fbmy8028_ef5b9b101_jun23_hack.cy9c4_u
23749	63865	619	13.9	805.2	43.8	0.010	0.223	0.034	1.888	283443	37.5	4.438	470	843.0	843.5	187.1	0.068	2701	1774	12000m.fbmy8028_ef5b9b101_jun23_hack.cy9c5_u
23743	67126	734	15.0	795.5	40.7	0.011	0.229	0.034	1.754	295396	37.5	4.401	447	845.1	845.3	189.0	0.070	2845	1982	12000m.fbmy8028_ef5b9b101_jun23_hack.cy9c6_u
23756	67722	738	15.9	814.2	43.2	0.011	0.241	0.034	1.862	297252	37.4	4.389	442	843.1	843.4	189.2	0.097	2845	1918	12000m.fbmy8028_ef5b9b101_jun23_hack.cy9c7_u
l.i0
l.i0: load without secondary indexes
Performance metrics for all DBMS, not just the ones listed above. Some are normalized by throughput, others are not. Legend for results is here.
ips	qps	rps	rmbps	wps	wmbps	rpq	rkbpq	wpi	wkbpi	csps	cpups	cspq	cpupq	dbgb1	dbgb2	rss	maxop	p50	p99	tag
542594	0	10	0.4	1876.6	119.4	0.000	0.001	0.003	0.225	363766	38.9	0.670	57	375.8	376.3	93.8	0.339	23574	13987	12000m.fbmy8028_ef5b9b101_jun23_hack.cy9c_u
565904	0	1	0.0	2099.5	136.7	0.000	0.000	0.004	0.247	107479	37.3	0.190	53	376.2	378.1	104.8	0.746	27272	400	12000m.fbmy8028_ef5b9b101_jun23_hack.cy9c1_u
480000	0	6	0.2	1626.0	103.5	0.000	0.000	0.003	0.221	431328	35.4	0.899	59	374.8	375.6	90.8	0.273	21079	10889	12000m.fbmy8028_ef5b9b101_jun23_hack.cy9c2_u
262916	0	5	0.2	1097.3	68.8	0.000	0.001	0.004	0.268	63004	17.7	0.240	54	374.9	375.3	118.8	0.414	1599	499	12000m.fbmy8028_ef5b9b101_jun23_hack.cy9c3_u
431934	0	12	0.4	1454.9	92.2	0.000	0.001	0.003	0.219	218353	28.4	0.506	53	375.0	375.9	89.8	0.284	20779	2497	12000m.fbmy8028_ef5b9b101_jun23_hack.cy9c4_u
656347	0	5	0.2	2309.0	148.2	0.000	0.000	0.004	0.231	210764	41.2	0.321	50	376.1	377.9	97.5	0.264	27572	21082	12000m.fbmy8028_ef5b9b101_jun23_hack.cy9c5_u
694565	0	11	0.4	2416.4	156.0	0.000	0.001	0.003	0.230	132319	40.8	0.191	47	376.3	377.9	98.3	0.250	29271	24476	12000m.fbmy8028_ef5b9b101_jun23_hack.cy9c6_u
695572	0	12	0.4	2409.9	156.9	0.000	0.001	0.003	0.231	132417	40.8	0.190	47	376.4	378.0	97.9	0.275	29071	24376	12000m.fbmy8028_ef5b9b101_jun23_hack.cy9c7_u
l.x
l.x: create secondary indexes
Performance metrics for all DBMS, not just the ones listed above. Some are normalized by throughput, others are not. Legend for results is here.
ips	qps	rps	rmbps	wps	wmbps	rpq	rkbpq	wpi	wkbpi	csps	cpups	cspq	cpupq	dbgb1	dbgb2	rss	maxop	p50	p99	tag
1404013	0	2574	146.8	1733.6	102.8	0.002	0.107	0.001	0.075	30896	29.8	0.022	17	771.3	771.8	185.3	0.003	NA	NA	12000m.fbmy8028_ef5b9b101_jun23_hack.cy9c_u
1391477	0	2716	163.4	1733.0	101.5	0.002	0.120	0.001	0.075	30408	29.8	0.022	17	772.0	773.8	191.3	0.003	NA	NA	12000m.fbmy8028_ef5b9b101_jun23_hack.cy9c1_u
1402700	0	2564	146.4	1734.5	99.4	0.002	0.107	0.001	0.073	31494	29.9	0.022	17	770.4	771.2	185.9	0.004	NA	NA	12000m.fbmy8028_ef5b9b101_jun23_hack.cy9c2_u
1409620	0	2580	146.9	1755.0	105.9	0.002	0.107	0.001	0.077	30365	29.9	0.022	17	771.8	772.2	183.3	0.003	NA	NA	12000m.fbmy8028_ef5b9b101_jun23_hack.cy9c3_u
1401553	0	2569	145.8	1737.5	100.4	0.002	0.107	0.001	0.073	30887	29.8	0.022	17	770.7	771.6	186.5	0.007	NA	NA	12000m.fbmy8028_ef5b9b101_jun23_hack.cy9c4_u
1397961	0	2569	145.7	1744.5	102.6	0.002	0.107	0.001	0.075	30185	29.6	0.022	17	771.7	773.5	188.0	0.004	NA	NA	12000m.fbmy8028_ef5b9b101_jun23_hack.cy9c5_u
1385373	0	2721	161.1	1725.8	100.0	0.002	0.119	0.001	0.074	32433	29.9	0.023	17	772.0	773.6	191.3	0.004	NA	NA	12000m.fbmy8028_ef5b9b101_jun23_hack.cy9c6_u
1369093	0	2670	158.0	1706.9	98.2	0.002	0.118	0.001	0.073	31226	29.5	0.023	17	772.0	773.6	191.3	0.007	NA	NA	12000m.fbmy8028_ef5b9b101_jun23_hack.cy9c7_u
l.i1
l.i1: continue load after secondary indexes created
Performance metrics for all DBMS, not just the ones listed above. Some are normalized by throughput, others are not. Legend for results is here.
ips	qps	rps	rmbps	wps	wmbps	rpq	rkbpq	wpi	wkbpi	csps	cpups	cspq	cpupq	dbgb1	dbgb2	rss	maxop	p50	p99	tag
59291	0	646	14.6	1611.9	101.0	0.011	0.253	0.027	1.745	160810	19.2	2.712	259	851.1	852.4	180.1	1.169	2597	150	12000m.fbmy8028_ef5b9b101_jun23_hack.cy9c_u
60024	0	677	17.8	1648.8	103.3	0.011	0.304	0.027	1.761	75379	17.4	1.256	232	844.2	845.2	185.7	1.516	2647	100	12000m.fbmy8028_ef5b9b101_jun23_hack.cy9c1_u
57471	0	620	14.1	1540.3	98.0	0.011	0.251	0.027	1.746	243540	20.1	4.238	280	849.5	851.2	180.5	1.120	2597	100	12000m.fbmy8028_ef5b9b101_jun23_hack.cy9c2_u
26989	0	341	6.9	832.3	49.8	0.013	0.262	0.031	1.888	51680	9.2	1.915	273	846.6	847.8	178.4	1.149	500	50	12000m.fbmy8028_ef5b9b101_jun23_hack.cy9c3_u
43356	0	570	11.7	1303.5	75.2	0.013	0.276	0.030	1.776	106159	14.0	2.449	258	844.6	846.3	180.6	9.545	2197	100	12000m.fbmy8028_ef5b9b101_jun23_hack.cy9c4_u
61843	0	768	15.7	1848.6	107.8	0.012	0.259	0.030	1.784	118145	19.0	1.910	246	843.4	844.2	182.1	0.184	2597	1998	12000m.fbmy8028_ef5b9b101_jun23_hack.cy9c5_u
62183	0	778	18.0	1857.8	105.7	0.013	0.297	0.030	1.741	79118	18.1	1.272	233	844.8	845.5	185.5	0.155	2598	1998	12000m.fbmy8028_ef5b9b101_jun23_hack.cy9c6_u
62215	0	798	18.3	1862.9	107.6	0.013	0.301	0.030	1.772	79203	18.2	1.273	234	845.7	846.4	185.4	0.207	2647	1948	12000m.fbmy8028_ef5b9b101_jun23_hack.cy9c7_u
q100.1
q100.1: range queries with 100 insert/s per client
Performance metrics for all DBMS, not just the ones listed above. Some are normalized by throughput, others are not. Legend for results is here.
ips	qps	rps	rmbps	wps	wmbps	rpq	rkbpq	wpi	wkbpi	csps	cpups	cspq	cpupq	dbgb1	dbgb2	rss	maxop	p50	p99	tag
2381	68068	4873	46.3	153.2	8.8	0.072	0.696	0.064	3.768	289164	31.8	4.248	374	841.6	842.8	184.7	0.257	3133	1886	12000m.fbmy8028_ef5b9b101_jun23_hack.cy9c_u
2381	72145	4458	42.6	149.5	8.3	0.062	0.604	0.063	3.590	304606	31.9	4.222	354	841.7	842.4	186.5	0.093	3182	1918	12000m.fbmy8028_ef5b9b101_jun23_hack.cy9c1_u
2381	67017	4918	46.6	154.8	8.6	0.073	0.713	0.065	3.680	286762	31.8	4.279	380	841.7	843.2	184.7	0.304	3021	1855	12000m.fbmy8028_ef5b9b101_jun23_hack.cy9c2_u
2376	73308	2686	25.8	114.4	6.2	0.037	0.360	0.048	2.665	306675	31.9	4.183	348	841.2	842.3	182.6	0.082	3100	2126	12000m.fbmy8028_ef5b9b101_jun23_hack.cy9c3_u
2374	73090	2761	26.0	98.9	5.2	0.038	0.365	0.042	2.260	306235	31.8	4.190	348	840.6	842.2	183.3	0.083	3054	2046	12000m.fbmy8028_ef5b9b101_jun23_hack.cy9c4_u
2377	73840	2708	25.8	111.5	6.0	0.037	0.358	0.047	2.601	308701	32.0	4.181	347	839.3	839.9	182.8	0.073	3181	1998	12000m.fbmy8028_ef5b9b101_jun23_hack.cy9c5_u
2376	78482	2857	27.1	113.1	5.6	0.036	0.353	0.048	2.431	326504	31.8	4.160	324	840.6	841.1	185.6	0.046	3388	2206	12000m.fbmy8028_ef5b9b101_jun23_hack.cy9c6_u
2376	78516	2728	26.3	112.0	5.8	0.035	0.344	0.047	2.487	326601	31.9	4.160	325	840.6	841.1	185.6	0.024	3276	2046	12000m.fbmy8028_ef5b9b101_jun23_hack.cy9c7_u
q500.1
q500.1: range queries with 500 insert/s per client
Performance metrics for all DBMS, not just the ones listed above. Some are normalized by throughput, others are not. Legend for results is here.
ips	qps	rps	rmbps	wps	wmbps	rpq	rkbpq	wpi	wkbpi	csps	cpups	cspq	cpupq	dbgb1	dbgb2	rss	maxop	p50	p99	tag
11907	64585	1661	21.3	428.3	24.2	0.026	0.338	0.036	2.077	275265	34.4	4.262	426	842.6	843.0	186.6	0.061	2878	2525	12000m.fbmy8028_ef5b9b101_jun23_hack.cy9c_u
11907	68639	1501	20.6	427.1	23.6	0.022	0.307	0.036	2.027	290322	34.2	4.230	399	842.5	844.6	188.6	0.049	3053	2669	12000m.fbmy8028_ef5b9b101_jun23_hack.cy9c1_u
11907	63342	1496	19.9	425.0	23.1	0.024	0.322	0.036	1.990	275113	34.5	4.343	436	843.8	844.5	186.7	0.047	2797	2446	12000m.fbmy8028_ef5b9b101_jun23_hack.cy9c2_u
11881	68064	403	9.8	402.7	21.9	0.006	0.148	0.034	1.884	287792	34.1	4.228	401	842.6	842.9	186.0	0.051	2877	2174	12000m.fbmy8028_ef5b9b101_jun23_hack.cy9c3_u
11862	68150	375	10.3	431.5	23.2	0.006	0.155	0.036	2.006	287877	34.0	4.224	399	841.4	842.3	186.2	0.106	2861	2078	12000m.fbmy8028_ef5b9b101_jun23_hack.cy9c4_u
11881	69845	350	8.4	390.2	21.4	0.005	0.124	0.033	1.848	294383	34.0	4.215	389	842.0	843.9	186.0	0.048	2989	2222	12000m.fbmy8028_ef5b9b101_jun23_hack.cy9c5_u
11875	73566	452	10.1	417.7	22.1	0.006	0.141	0.035	1.910	308436	34.2	4.193	372	841.6	843.4	188.1	0.045	3165	2318	12000m.fbmy8028_ef5b9b101_jun23_hack.cy9c6_u
11878	73612	429	10.0	407.1	22.4	0.006	0.139	0.034	1.935	308845	34.1	4.196	371	842.0	843.8	188.4	0.038	3069	2270	12000m.fbmy8028_ef5b9b101_jun23_hack.cy9c7_u
q1000.1
q1000.1: range queries with 1000 insert/s per client
Performance metrics for all DBMS, not just the ones listed above. Some are normalized by throughput, others are not. Legend for results is here.
ips	qps	rps	rmbps	wps	wmbps	rpq	rkbpq	wpi	wkbpi	csps	cpups	cspq	cpupq	dbgb1	dbgb2	rss	maxop	p50	p99	tag
23828	57182	2680	36.9	832.9	48.5	0.047	0.661	0.035	2.085	270808	38.7	4.736	541	844.0	844.9	187.5	0.135	2478	2142	12000m.fbmy8028_ef5b9b101_jun23_hack.cy9c_u
23828	61609	2514	36.8	832.0	41.6	0.041	0.612	0.035	1.787	276036	38.1	4.480	495	844.6	845.1	189.1	0.109	2717	2318	12000m.fbmy8028_ef5b9b101_jun23_hack.cy9c1_u
23828	55301	2519	36.9	835.4	40.8	0.046	0.683	0.035	1.753	290231	39.2	5.248	567	844.5	845.8	187.5	0.069	2414	2078	12000m.fbmy8028_ef5b9b101_jun23_hack.cy9c2_u
22069	52809	597	13.2	753.4	40.1	0.011	0.257	0.034	1.862	242518	37.6	4.592	570	843.9	844.8	187.4	0.084	2206	1423	12000m.fbmy8028_ef5b9b101_jun23_hack.cy9c3_u
23613	60866	580	14.3	811.0	42.7	0.010	0.240	0.034	1.853	275919	37.3	4.533	490	844.1	845.4	187.2	0.120	2573	1518	12000m.fbmy8028_ef5b9b101_jun23_hack.cy9c4_u
23749	63865	619	13.9	805.2	43.8	0.010	0.223	0.034	1.888	283443	37.5	4.438	470	843.0	843.5	187.1	0.068	2701	1774	12000m.fbmy8028_ef5b9b101_jun23_hack.cy9c5_u
23743	67126	734	15.0	795.5	40.7	0.011	0.229	0.034	1.754	295396	37.5	4.401	447	845.1	845.3	189.0	0.070	2845	1982	12000m.fbmy8028_ef5b9b101_jun23_hack.cy9c6_u
23756	67722	738	15.9	814.2	43.2	0.011	0.241	0.034	1.862	297252	37.4	4.389	442	843.1	843.4	189.2	0.097	2845	1918	12000m.fbmy8028_ef5b9b101_jun23_hack.cy9c7_u
l.i0
- l.i0: load without secondary indexes
- Legend for results is here.
- Each entry lists the percentage of responses that fit in that bucket (slower than max time for previous bucket, faster than min time for next bucket).
Insert response time histogram
256us	1ms	4ms	16ms	64ms	256ms	1s	4s	16s	gt	max	tag
0.000	0.000	46.529	53.421	0.007	0.042	nonzero	0.000	0.000	0.000	0.339	fbmy8028_ef5b9b101_jun23_hack.cy9c_u
0.000	0.000	79.387	19.620	0.665	0.317	0.010	0.000	0.000	0.000	0.746	fbmy8028_ef5b9b101_jun23_hack.cy9c1_u
0.000	0.000	30.556	69.395	0.007	0.041	nonzero	0.000	0.000	0.000	0.273	fbmy8028_ef5b9b101_jun23_hack.cy9c2_u
0.000	0.000	78.894	14.216	2.289	4.599	0.002	0.000	0.000	0.000	0.414	fbmy8028_ef5b9b101_jun23_hack.cy9c3_u
0.000	0.000	59.658	35.706	4.585	0.051	nonzero	0.000	0.000	0.000	0.284	fbmy8028_ef5b9b101_jun23_hack.cy9c4_u
0.000	0.000	78.968	20.982	0.009	0.041	nonzero	0.000	0.000	0.000	0.264	fbmy8028_ef5b9b101_jun23_hack.cy9c5_u
0.000	0.000	86.467	13.481	0.009	0.043	0.000	0.000	0.000	0.000	0.250	fbmy8028_ef5b9b101_jun23_hack.cy9c6_u
0.000	0.000	86.304	13.644	0.007	0.044	nonzero	0.000	0.000	0.000	0.275	fbmy8028_ef5b9b101_jun23_hack.cy9c7_u
l.x
- l.x: create secondary indexes
- Legend for results is here.
- Each entry lists the percentage of responses that fit in that bucket (slower than max time for previous bucket, faster than min time for next bucket).
TODO - determine whether there is data for create index response time
l.i1
- l.i1: continue load after secondary indexes created
- Legend for results is here.
- Each entry lists the percentage of responses that fit in that bucket (slower than max time for previous bucket, faster than min time for next bucket).
Insert response time histogram
256us	1ms	4ms	16ms	64ms	256ms	1s	4s	16s	gt	max	tag
0.000	0.000	0.026	17.099	82.285	0.485	0.104	0.001	0.000	0.000	1.169	fbmy8028_ef5b9b101_jun23_hack.cy9c_u
0.000	0.000	0.029	20.371	79.001	0.452	0.145	0.002	0.000	0.000	1.516	fbmy8028_ef5b9b101_jun23_hack.cy9c1_u
0.000	0.000	0.030	15.196	84.013	0.605	0.156	nonzero	0.000	0.000	1.120	fbmy8028_ef5b9b101_jun23_hack.cy9c2_u
0.000	0.000	0.029	14.678	71.485	10.580	3.226	0.001	0.000	0.000	1.149	fbmy8028_ef5b9b101_jun23_hack.cy9c3_u
0.000	0.000	0.015	15.212	78.193	6.506	0.064	0.008	0.001	0.000	9.545	fbmy8028_ef5b9b101_jun23_hack.cy9c4_u
0.000	0.000	0.026	17.647	82.310	0.016	0.000	0.000	0.000	0.000	0.184	fbmy8028_ef5b9b101_jun23_hack.cy9c5_u
0.000	0.000	0.028	18.258	81.699	0.015	0.000	0.000	0.000	0.000	0.155	fbmy8028_ef5b9b101_jun23_hack.cy9c6_u
0.000	0.000	0.028	18.402	81.556	0.015	0.000	0.000	0.000	0.000	0.207	fbmy8028_ef5b9b101_jun23_hack.cy9c7_u
Delete response time histogram
256us	1ms	4ms	16ms	64ms	256ms	1s	4s	16s	gt	max	tag
0.000	0.000	0.027	16.768	82.613	0.487	0.105	0.001	0.000	0.000	1.169	fbmy8028_ef5b9b101_jun23_hack.cy9c_u
0.000	0.000	0.030	19.806	79.562	0.455	0.145	0.002	0.000	0.000	1.516	fbmy8028_ef5b9b101_jun23_hack.cy9c1_u
0.000	0.000	0.030	15.044	84.162	0.607	0.156	nonzero	0.000	0.000	1.120	fbmy8028_ef5b9b101_jun23_hack.cy9c2_u
0.000	0.000	0.029	14.098	72.059	10.586	3.227	0.001	0.000	0.000	1.149	fbmy8028_ef5b9b101_jun23_hack.cy9c3_u
0.000	0.000	0.015	14.929	78.465	6.517	0.064	0.009	0.001	0.000	9.545	fbmy8028_ef5b9b101_jun23_hack.cy9c4_u
0.000	0.000	0.027	17.146	82.809	0.017	0.000	0.000	0.000	0.000	0.245	fbmy8028_ef5b9b101_jun23_hack.cy9c5_u
0.000	0.000	0.029	17.665	82.290	0.016	0.000	0.000	0.000	0.000	0.156	fbmy8028_ef5b9b101_jun23_hack.cy9c6_u
0.000	0.000	0.028	17.713	82.243	0.016	0.000	0.000	0.000	0.000	0.208	fbmy8028_ef5b9b101_jun23_hack.cy9c7_u
q100.1
- q100.1: range queries with 100 insert/s per client
- Legend for results is here.
- Each entry lists the percentage of responses that fit in that bucket (slower than max time for previous bucket, faster than min time for next bucket).
Query response time histogram
256us	1ms	4ms	16ms	64ms	256ms	1s	4s	16s	gt	max	tag
29.762	69.665	0.567	0.005	nonzero	0.001	nonzero	0.000	0.000	0.000	0.257	fbmy8028_ef5b9b101_jun23_hack.cy9c_u
40.338	59.215	0.442	0.005	nonzero	nonzero	0.000	0.000	0.000	0.000	0.093	fbmy8028_ef5b9b101_jun23_hack.cy9c1_u
26.909	72.512	0.573	0.005	nonzero	nonzero	nonzero	0.000	0.000	0.000	0.304	fbmy8028_ef5b9b101_jun23_hack.cy9c2_u
28.035	71.886	0.070	0.004	0.005	nonzero	0.000	0.000	0.000	0.000	0.082	fbmy8028_ef5b9b101_jun23_hack.cy9c3_u
28.465	71.472	0.053	0.002	0.007	0.001	0.000	0.000	0.000	0.000	0.083	fbmy8028_ef5b9b101_jun23_hack.cy9c4_u
29.108	70.796	0.087	0.007	0.002	nonzero	0.000	0.000	0.000	0.000	0.073	fbmy8028_ef5b9b101_jun23_hack.cy9c5_u
39.865	60.035	0.092	0.007	0.001	0.000	0.000	0.000	0.000	0.000	0.046	fbmy8028_ef5b9b101_jun23_hack.cy9c6_u
39.582	60.329	0.081	0.007	0.001	0.000	0.000	0.000	0.000	0.000	0.024	fbmy8028_ef5b9b101_jun23_hack.cy9c7_u
Insert response time histogram
256us	1ms	4ms	16ms	64ms	256ms	1s	4s	16s	gt	max	tag
0.000	0.000	99.078	0.919	0.003	0.001	0.000	0.000	0.000	0.000	0.080	fbmy8028_ef5b9b101_jun23_hack.cy9c_u
0.000	0.000	99.793	0.205	0.001	0.000	0.000	0.000	0.000	0.000	0.018	fbmy8028_ef5b9b101_jun23_hack.cy9c1_u
0.000	0.000	99.802	0.171	0.006	0.017	0.003	0.000	0.000	0.000	0.301	fbmy8028_ef5b9b101_jun23_hack.cy9c2_u
0.000	0.000	99.677	0.238	0.085	0.000	0.000	0.000	0.000	0.000	0.049	fbmy8028_ef5b9b101_jun23_hack.cy9c3_u
0.000	0.000	99.678	0.201	0.120	0.001	0.000	0.000	0.000	0.000	0.078	fbmy8028_ef5b9b101_jun23_hack.cy9c4_u
0.000	0.000	99.733	0.237	0.031	0.000	0.000	0.000	0.000	0.000	0.047	fbmy8028_ef5b9b101_jun23_hack.cy9c5_u
0.000	0.000	99.770	0.202	0.028	0.000	0.000	0.000	0.000	0.000	0.025	fbmy8028_ef5b9b101_jun23_hack.cy9c6_u
0.000	0.000	99.734	0.227	0.038	0.000	0.000	0.000	0.000	0.000	0.021	fbmy8028_ef5b9b101_jun23_hack.cy9c7_u
Delete response time histogram
256us	1ms	4ms	16ms	64ms	256ms	1s	4s	16s	gt	max	tag
0.000	0.000	99.359	0.634	0.006	0.001	0.000	0.000	0.000	0.000	0.081	fbmy8028_ef5b9b101_jun23_hack.cy9c_u
0.000	0.000	99.861	0.138	0.001	0.000	0.000	0.000	0.000	0.000	0.025	fbmy8028_ef5b9b101_jun23_hack.cy9c1_u
0.000	0.000	99.828	0.127	0.011	0.032	0.002	0.000	0.000	0.000	0.305	fbmy8028_ef5b9b101_jun23_hack.cy9c2_u
0.000	0.000	99.656	0.248	0.094	0.003	0.000	0.000	0.000	0.000	0.080	fbmy8028_ef5b9b101_jun23_hack.cy9c3_u
0.000	0.000	99.646	0.217	0.134	0.002	0.000	0.000	0.000	0.000	0.081	fbmy8028_ef5b9b101_jun23_hack.cy9c4_u
0.000	0.000	99.743	0.222	0.035	0.000	0.000	0.000	0.000	0.000	0.047	fbmy8028_ef5b9b101_jun23_hack.cy9c5_u
0.000	0.000	99.762	0.210	0.028	0.000	0.000	0.000	0.000	0.000	0.028	fbmy8028_ef5b9b101_jun23_hack.cy9c6_u
0.000	0.000	99.741	0.223	0.036	0.000	0.000	0.000	0.000	0.000	0.021	fbmy8028_ef5b9b101_jun23_hack.cy9c7_u
q500.1
- q500.1: range queries with 500 insert/s per client
- Legend for results is here.
- Each entry lists the percentage of responses that fit in that bucket (slower than max time for previous bucket, faster than min time for next bucket).
Query response time histogram
256us	1ms	4ms	16ms	64ms	256ms	1s	4s	16s	gt	max	tag
16.460	83.499	0.024	0.016	nonzero	0.000	0.000	0.000	0.000	0.000	0.061	fbmy8028_ef5b9b101_jun23_hack.cy9c_u
27.503	72.458	0.022	0.018	nonzero	0.000	0.000	0.000	0.000	0.000	0.049	fbmy8028_ef5b9b101_jun23_hack.cy9c1_u
12.884	87.075	0.025	0.016	nonzero	0.000	0.000	0.000	0.000	0.000	0.047	fbmy8028_ef5b9b101_jun23_hack.cy9c2_u
16.421	83.509	0.038	0.010	0.022	0.000	0.000	0.000	0.000	0.000	0.051	fbmy8028_ef5b9b101_jun23_hack.cy9c3_u
18.312	81.615	0.033	0.012	0.028	nonzero	0.000	0.000	0.000	0.000	0.106	fbmy8028_ef5b9b101_jun23_hack.cy9c4_u
20.601	79.323	0.043	0.025	0.008	0.000	0.000	0.000	0.000	0.000	0.048	fbmy8028_ef5b9b101_jun23_hack.cy9c5_u
29.227	70.703	0.040	0.023	0.007	0.000	0.000	0.000	0.000	0.000	0.045	fbmy8028_ef5b9b101_jun23_hack.cy9c6_u
29.175	70.751	0.041	0.023	0.009	0.000	0.000	0.000	0.000	0.000	0.038	fbmy8028_ef5b9b101_jun23_hack.cy9c7_u
Insert response time histogram
256us	1ms	4ms	16ms	64ms	256ms	1s	4s	16s	gt	max	tag
0.000	0.000	50.965	48.988	0.047	0.000	0.000	0.000	0.000	0.000	0.037	fbmy8028_ef5b9b101_jun23_hack.cy9c_u
0.000	0.000	44.485	55.477	0.037	0.001	0.000	0.000	0.000	0.000	0.093	fbmy8028_ef5b9b101_jun23_hack.cy9c1_u
0.000	0.000	31.115	67.797	1.087	0.000	0.000	0.000	0.000	0.000	0.036	fbmy8028_ef5b9b101_jun23_hack.cy9c2_u
0.000	0.000	97.085	2.699	0.216	0.000	0.000	0.000	0.000	0.000	0.052	fbmy8028_ef5b9b101_jun23_hack.cy9c3_u
0.000	0.000	99.360	0.396	0.241	0.003	0.000	0.000	0.000	0.000	0.100	fbmy8028_ef5b9b101_jun23_hack.cy9c4_u
0.000	0.000	95.902	3.934	0.164	0.000	0.000	0.000	0.000	0.000	0.032	fbmy8028_ef5b9b101_jun23_hack.cy9c5_u
0.000	0.000	99.612	0.281	0.106	0.000	0.000	0.000	0.000	0.000	0.030	fbmy8028_ef5b9b101_jun23_hack.cy9c6_u
0.000	0.000	98.056	1.786	0.158	0.000	0.000	0.000	0.000	0.000	0.041	fbmy8028_ef5b9b101_jun23_hack.cy9c7_u
Delete response time histogram
256us	1ms	4ms	16ms	64ms	256ms	1s	4s	16s	gt	max	tag
0.000	0.000	53.705	46.245	0.049	nonzero	0.000	0.000	0.000	0.000	0.074	fbmy8028_ef5b9b101_jun23_hack.cy9c_u
0.000	0.000	47.411	52.549	0.039	0.001	0.000	0.000	0.000	0.000	0.093	fbmy8028_ef5b9b101_jun23_hack.cy9c1_u
0.000	0.000	33.168	65.782	1.050	0.000	0.000	0.000	0.000	0.000	0.063	fbmy8028_ef5b9b101_jun23_hack.cy9c2_u
0.000	0.000	96.852	2.921	0.227	0.000	0.000	0.000	0.000	0.000	0.052	fbmy8028_ef5b9b101_jun23_hack.cy9c3_u
0.000	0.000	99.301	0.444	0.253	0.002	0.000	0.000	0.000	0.000	0.102	fbmy8028_ef5b9b101_jun23_hack.cy9c4_u
0.000	0.000	95.922	3.915	0.163	0.000	0.000	0.000	0.000	0.000	0.033	fbmy8028_ef5b9b101_jun23_hack.cy9c5_u
0.000	0.000	99.614	0.277	0.108	0.000	0.000	0.000	0.000	0.000	0.032	fbmy8028_ef5b9b101_jun23_hack.cy9c6_u
0.000	0.000	98.146	1.689	0.165	0.000	0.000	0.000	0.000	0.000	0.041	fbmy8028_ef5b9b101_jun23_hack.cy9c7_u
q1000.1
- q1000.1: range queries with 1000 insert/s per client
- Legend for results is here.
- Each entry lists the percentage of responses that fit in that bucket (slower than max time for previous bucket, faster than min time for next bucket).
Query response time histogram
256us	1ms	4ms	16ms	64ms	256ms	1s	4s	16s	gt	max	tag
3.414	96.432	0.116	0.038	nonzero	nonzero	0.000	0.000	0.000	0.000	0.135	fbmy8028_ef5b9b101_jun23_hack.cy9c_u
11.559	88.329	0.072	0.040	nonzero	nonzero	0.000	0.000	0.000	0.000	0.109	fbmy8028_ef5b9b101_jun23_hack.cy9c1_u
1.837	97.923	0.199	0.040	nonzero	nonzero	0.000	0.000	0.000	0.000	0.069	fbmy8028_ef5b9b101_jun23_hack.cy9c2_u
0.204	99.675	0.069	0.013	0.040	nonzero	0.000	0.000	0.000	0.000	0.084	fbmy8028_ef5b9b101_jun23_hack.cy9c3_u
6.151	93.740	0.036	0.029	0.043	0.001	0.000	0.000	0.000	0.000	0.120	fbmy8028_ef5b9b101_jun23_hack.cy9c4_u
10.172	89.739	0.050	0.014	0.025	nonzero	0.000	0.000	0.000	0.000	0.068	fbmy8028_ef5b9b101_jun23_hack.cy9c5_u
17.163	82.751	0.049	0.014	0.023	nonzero	0.000	0.000	0.000	0.000	0.070	fbmy8028_ef5b9b101_jun23_hack.cy9c6_u
18.357	81.560	0.045	0.011	0.027	nonzero	0.000	0.000	0.000	0.000	0.097	fbmy8028_ef5b9b101_jun23_hack.cy9c7_u
Insert response time histogram
256us	1ms	4ms	16ms	64ms	256ms	1s	4s	16s	gt	max	tag
0.000	0.000	4.425	26.591	68.985	0.000	0.000	0.000	0.000	0.000	0.061	fbmy8028_ef5b9b101_jun23_hack.cy9c_u
0.000	0.000	6.733	42.209	51.057	0.001	0.000	0.000	0.000	0.000	0.080	fbmy8028_ef5b9b101_jun23_hack.cy9c1_u
0.000	0.000	4.679	21.764	73.554	0.003	0.000	0.000	0.000	0.000	0.101	fbmy8028_ef5b9b101_jun23_hack.cy9c2_u
0.000	0.000	23.068	36.724	35.111	4.895	0.202	0.000	0.000	0.000	0.379	fbmy8028_ef5b9b101_jun23_hack.cy9c3_u
0.000	0.000	23.444	59.068	16.851	0.617	0.013	0.007	0.000	0.000	1.854	fbmy8028_ef5b9b101_jun23_hack.cy9c4_u
0.000	0.000	23.382	75.981	0.635	0.002	0.000	0.000	0.000	0.000	0.076	fbmy8028_ef5b9b101_jun23_hack.cy9c5_u
0.000	0.000	14.495	80.315	5.188	0.002	0.000	0.000	0.000	0.000	0.091	fbmy8028_ef5b9b101_jun23_hack.cy9c6_u
0.000	0.000	27.100	71.411	1.484	0.006	0.000	0.000	0.000	0.000	0.112	fbmy8028_ef5b9b101_jun23_hack.cy9c7_u
Delete response time histogram
256us	1ms	4ms	16ms	64ms	256ms	1s	4s	16s	gt	max	tag
0.000	0.000	4.539	26.483	68.978	nonzero	0.000	0.000	0.000	0.000	0.123	fbmy8028_ef5b9b101_jun23_hack.cy9c_u
0.000	0.000	6.840	42.092	51.066	0.002	0.000	0.000	0.000	0.000	0.132	fbmy8028_ef5b9b101_jun23_hack.cy9c1_u
0.000	0.000	4.781	21.734	73.482	0.003	0.000	0.000	0.000	0.000	0.189	fbmy8028_ef5b9b101_jun23_hack.cy9c2_u
0.000	0.000	22.492	37.154	35.254	4.898	0.201	0.000	0.000	0.000	0.379	fbmy8028_ef5b9b101_jun23_hack.cy9c3_u
0.000	0.000	22.948	59.466	16.947	0.619	0.013	0.007	0.000	0.000	2.053	fbmy8028_ef5b9b101_jun23_hack.cy9c4_u
0.000	0.000	23.186	76.168	0.644	0.002	0.000	0.000	0.000	0.000	0.076	fbmy8028_ef5b9b101_jun23_hack.cy9c5_u
0.000	0.000	14.214	80.574	5.209	0.003	0.000	0.000	0.000	0.000	0.091	fbmy8028_ef5b9b101_jun23_hack.cy9c6_u
0.000	0.000	26.655	71.841	1.497	0.006	0.000	0.000	0.000	0.000	0.112	fbmy8028_ef5b9b101_jun23_hack.cy9c7_u