Introduction
This is a report for the insert benchmark with 480M docs and 24 client(s). It is generated by scripts (bash, awk, sed) and Tufte might not be impressed. An overview of the insert benchmark is here and a short update is here. Below, by DBMS, I mean DBMS+version.config. An example is my8020.c10b40 where my means MySQL, 8020 is version 8.0.20 and c10b40 is the name for the configuration file.
The test server has 80 cores with hyperthreads enabled, 256G RAM and fast storage. The benchmark was run with 24 client and there were 1 or 3 connections per client (1 for queries or inserts without rate limits, 1+1 for rate limited inserts+deletes). There are 24 tables, with a client per table. It loads 480M rows without secondary indexes, creates secondary indexes, then inserts 1200M rows with a delete per insert to avoid growing the table. It then does 3 read+write tests for 3600s each that do queries as fast as possible with 100, 500 and then 1000 inserts/second/client concurrent with the queries and 1000 deletes/second to avoid growing the table. The database is cached by RocksDB
The tested DBMS are:
- fbmy8028_ef5b9b101_jun23_hack.cy9c_u - MyRocks and FB MySQL 8.0.28 from June 2023 at git hash ef5b9b101 with the y9c_u config
- fbmy8028_ef5b9b101_jun23_hack.cy9c1_u - MyRocks and FB MySQL 8.0.28 from June 2023 at git hash ef5b9b101 with the y9c1_u config, adds rocksdb_use_hyper_clock_cache=ON
- fbmy8028_ef5b9b101_jun23_hack.cy9c2_u - MyRocks and FB MySQL 8.0.28 from June 2023 at git hash ef5b9b101 with the y9c2_u config, adds rocksdb_block_cache_numshardbits=4
- fbmy8028_ef5b9b101_jun23_hack.cy9c3_u - MyRocks and FB MySQL 8.0.28 from June 2023 at git hash ef5b9b101 with the y9c3_u config, disables intra-L0 compaction via a hack
- fbmy8028_ef5b9b101_jun23_hack.cy9c4_u - MyRocks and FB MySQL 8.0.28 from June 2023 at git hash ef5b9b101 with the y9c4_u config, reduces level0_slowdown_writes_trigger from 20 to 8 and level0_stop_writes_trigger from 36 to 12
- fbmy8028_ef5b9b101_jun23_hack.cy9c5_u - MyRocks and FB MySQL 8.0.28 from June 2023 at git hash ef5b9b101 with the y9c5_u config, enables subcompactions via rocksdb_max_subcompactions=4
- fbmy8028_ef5b9b101_jun23_hack.cy9c6_u - MyRocks and FB MySQL 8.0.28 from June 2023 at git hash ef5b9b101 with the y9c6_u config, combines c1, c2, c5
- fbmy8028_ef5b9b101_jun23_hack.cy9c7_u - MyRocks and FB MySQL 8.0.28 from June 2023 at git hash ef5b9b101 with the y9c7_u config, combines c1, c5
Contents
- Summary
- l.i0: load without secondary indexes
- l.x: create secondary indexes
- l.i1: continue load after secondary indexes created
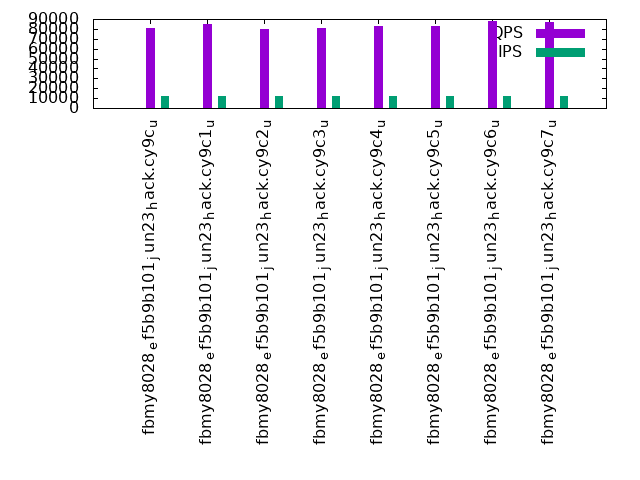
- q100.1: range queries with 100 insert/s per client
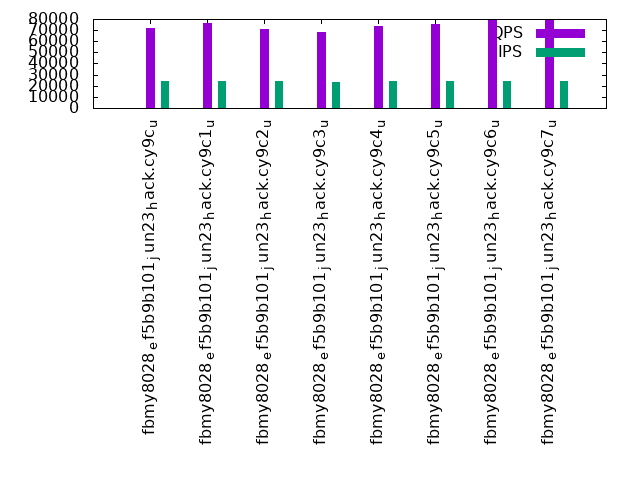
- q500.1: range queries with 500 insert/s per client
- q1000.1: range queries with 1000 insert/s per client
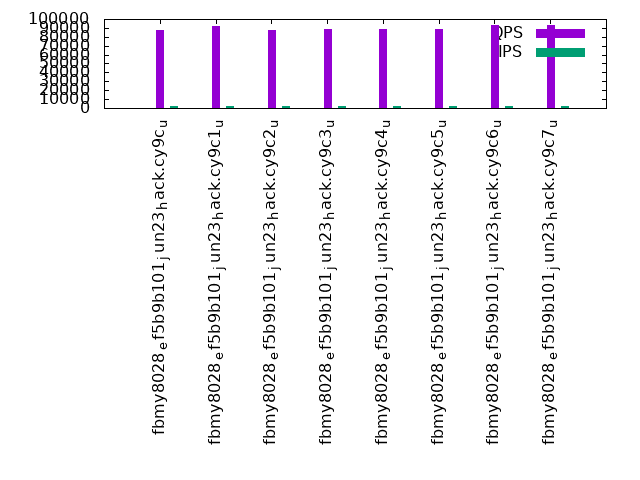
Summary
The numbers are inserts/s for l.i0 and l.i1, indexed docs (or rows) /s for l.x and queries/s for q*.2. The values are the average rate over the entire test for inserts (IPS) and queries (QPS). The range of values for IPS and QPS is split into 3 parts: bottom 25%, middle 50%, top 25%. Values in the bottom 25% have a red background, values in the top 25% have a green background and values in the middle have no color. A gray background is used for values that can be ignored because the DBMS did not sustain the target insert rate. Red backgrounds are not used when the minimum value is within 80% of the max value.
| dbms | l.i0 | l.x | l.i1 | q100.1 | q500.1 | q1000.1 |
|---|---|---|---|---|---|---|
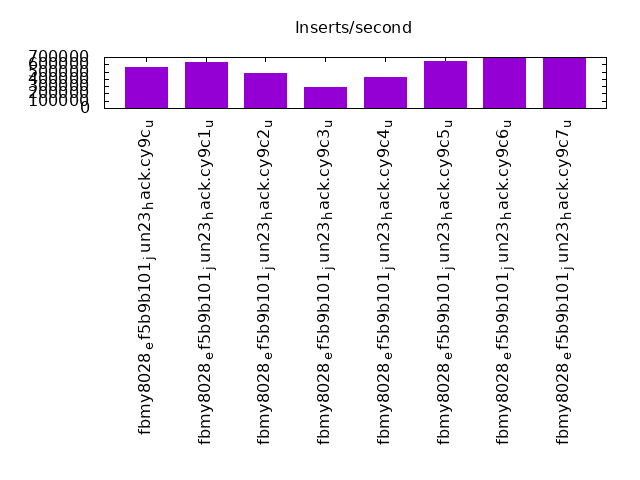
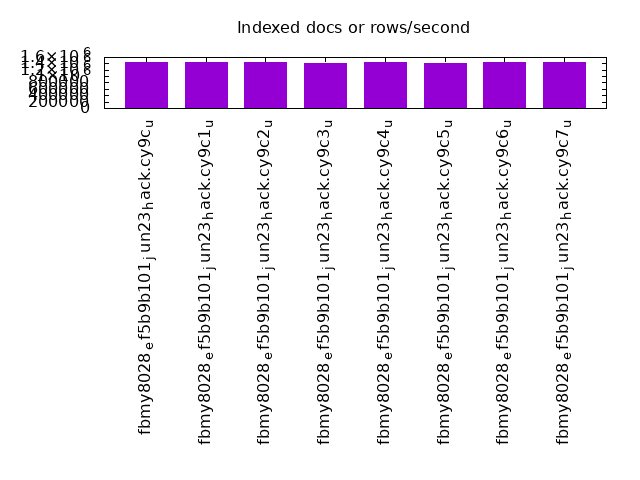
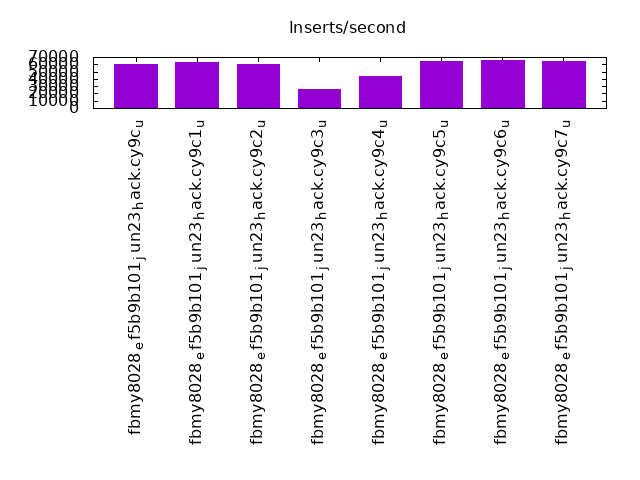
| fbmy8028_ef5b9b101_jun23_hack.cy9c_u | 562720 | 1433134 | 60432 | 87738 | 80814 | 72124 |
| fbmy8028_ef5b9b101_jun23_hack.cy9c1_u | 634082 | 1454848 | 63125 | 92313 | 85024 | 76070 |
| fbmy8028_ef5b9b101_jun23_hack.cy9c2_u | 478088 | 1446084 | 60003 | 87252 | 80274 | 71008 |
| fbmy8028_ef5b9b101_jun23_hack.cy9c3_u | 289505 | 1416224 | 25858 | 88772 | 81070 | 68222 |
| fbmy8028_ef5b9b101_jun23_hack.cy9c4_u | 429722 | 1454848 | 43727 | 88831 | 83100 | 73609 |
| fbmy8028_ef5b9b101_jun23_hack.cy9c5_u | 645161 | 1424629 | 64568 | 88507 | 82601 | 75721 |
| fbmy8028_ef5b9b101_jun23_hack.cy9c6_u | 687679 | 1450453 | 65865 | 93052 | 87568 | 79422 |
| fbmy8028_ef5b9b101_jun23_hack.cy9c7_u | 686695 | 1441742 | 64669 | 93160 | 87427 | 79647 |
This table has relative throughput, throughput for the DBMS relative to the DBMS in the first line, using the absolute throughput from the previous table. Values less than 0.95 have a yellow background. Values greater than 1.05 have a blue background.
| dbms | l.i0 | l.x | l.i1 | q100.1 | q500.1 | q1000.1 |
|---|---|---|---|---|---|---|
| fbmy8028_ef5b9b101_jun23_hack.cy9c_u | 1.00 | 1.00 | 1.00 | 1.00 | 1.00 | 1.00 |
| fbmy8028_ef5b9b101_jun23_hack.cy9c1_u | 1.13 | 1.02 | 1.04 | 1.05 | 1.05 | 1.05 |
| fbmy8028_ef5b9b101_jun23_hack.cy9c2_u | 0.85 | 1.01 | 0.99 | 0.99 | 0.99 | 0.98 |
| fbmy8028_ef5b9b101_jun23_hack.cy9c3_u | 0.51 | 0.99 | 0.43 | 1.01 | 1.00 | 0.95 |
| fbmy8028_ef5b9b101_jun23_hack.cy9c4_u | 0.76 | 1.02 | 0.72 | 1.01 | 1.03 | 1.02 |
| fbmy8028_ef5b9b101_jun23_hack.cy9c5_u | 1.15 | 0.99 | 1.07 | 1.01 | 1.02 | 1.05 |
| fbmy8028_ef5b9b101_jun23_hack.cy9c6_u | 1.22 | 1.01 | 1.09 | 1.06 | 1.08 | 1.10 |
| fbmy8028_ef5b9b101_jun23_hack.cy9c7_u | 1.22 | 1.01 | 1.07 | 1.06 | 1.08 | 1.10 |
This lists the average rate of inserts/s for the tests that do inserts concurrent with queries. For such tests the query rate is listed in the table above. The read+write tests are setup so that the insert rate should match the target rate every second. Cells that are not at least 95% of the target have a red background to indicate a failure to satisfy the target.
| dbms | q100.1 | q500.1 | q1000.1 |
|---|---|---|---|
| fbmy8028_ef5b9b101_jun23_hack.cy9c_u | 2381 | 11907 | 23828 |
| fbmy8028_ef5b9b101_jun23_hack.cy9c1_u | 2381 | 11907 | 23828 |
| fbmy8028_ef5b9b101_jun23_hack.cy9c2_u | 2381 | 11907 | 23828 |
| fbmy8028_ef5b9b101_jun23_hack.cy9c3_u | 2382 | 11911 | 23613 |
| fbmy8028_ef5b9b101_jun23_hack.cy9c4_u | 2381 | 11907 | 23834 |
| fbmy8028_ef5b9b101_jun23_hack.cy9c5_u | 2381 | 11911 | 23828 |
| fbmy8028_ef5b9b101_jun23_hack.cy9c6_u | 2381 | 11907 | 23834 |
| fbmy8028_ef5b9b101_jun23_hack.cy9c7_u | 2381 | 11907 | 23828 |
| target | 2400 | 12000 | 24000 |
l.i0
l.i0: load without secondary indexes. Graphs for performance per 1-second interval are here.
Average throughput:
Insert response time histogram: each cell has the percentage of responses that take <= the time in the header and max is the max response time in seconds. For the max column values in the top 25% of the range have a red background and in the bottom 25% of the range have a green background. The red background is not used when the min value is within 80% of the max value.
| dbms | 256us | 1ms | 4ms | 16ms | 64ms | 256ms | 1s | 4s | 16s | gt | max |
|---|---|---|---|---|---|---|---|---|---|---|---|
| fbmy8028_ef5b9b101_jun23_hack.cy9c_u | 56.777 | 43.180 | 0.002 | 0.042 | 0.109 | ||||||
| fbmy8028_ef5b9b101_jun23_hack.cy9c1_u | 82.698 | 17.174 | 0.085 | 0.043 | 0.173 | ||||||
| fbmy8028_ef5b9b101_jun23_hack.cy9c2_u | 35.105 | 64.850 | 0.002 | 0.042 | 0.171 | ||||||
| fbmy8028_ef5b9b101_jun23_hack.cy9c3_u | 81.045 | 12.564 | 2.635 | 3.756 | nonzero | 0.301 | |||||
| fbmy8028_ef5b9b101_jun23_hack.cy9c4_u | 59.490 | 36.810 | 3.657 | 0.043 | 0.225 | ||||||
| fbmy8028_ef5b9b101_jun23_hack.cy9c5_u | 80.034 | 19.922 | 0.001 | 0.043 | 0.172 | ||||||
| fbmy8028_ef5b9b101_jun23_hack.cy9c6_u | 88.749 | 11.207 | nonzero | 0.043 | 0.099 | ||||||
| fbmy8028_ef5b9b101_jun23_hack.cy9c7_u | 88.594 | 11.362 | 0.001 | 0.043 | 0.115 |
Performance metrics for the DBMS listed above. Some are normalized by throughput, others are not. Legend for results is here.
ips	qps	rps	rmbps	wps	wmbps	rpq	rkbpq	wpi	wkbpi	csps	cpups	cspq	cpupq	dbgb1	dbgb2	rss	maxop	p50	p99	tag
562720	0	0	0.0	1807.6	121.2	0.000	0.000	0.003	0.221	347597	39.3	0.618	56	15.3	16.6	3.9	0.109	24176	14585	480m.fbmy8028_ef5b9b101_jun23_hack.cy9c_u
634082	0	0	0.0	2142.6	145.1	0.000	0.000	0.003	0.234	115585	40.7	0.182	51	18.7	20.1	6.3	0.173	27972	10191	480m.fbmy8028_ef5b9b101_jun23_hack.cy9c1_u
478088	0	0	0.0	1602.7	116.2	0.000	0.000	0.003	0.249	420609	34.8	0.880	58	15.4	16.8	4.1	0.171	20679	10190	480m.fbmy8028_ef5b9b101_jun23_hack.cy9c2_u
289505	0	0	0.0	1121.6	78.7	0.000	0.000	0.004	0.278	66043	19.1	0.228	53	16.2	17.5	4.8	0.301	2198	599	480m.fbmy8028_ef5b9b101_jun23_hack.cy9c3_u
429722	0	0	0.0	1428.6	108.1	0.000	0.000	0.003	0.258	218036	28.1	0.507	52	15.1	16.4	4.0	0.225	20676	3496	480m.fbmy8028_ef5b9b101_jun23_hack.cy9c4_u
645161	0	0	0.0	2266.3	174.4	0.000	0.000	0.004	0.277	225369	40.3	0.349	50	15.2	16.6	4.3	0.172	27972	22278	480m.fbmy8028_ef5b9b101_jun23_hack.cy9c5_u
687679	0	0	0.0	2385.2	178.9	0.000	0.000	0.003	0.266	129571	40.6	0.188	47	15.2	16.5	6.4	0.099	29670	25674	480m.fbmy8028_ef5b9b101_jun23_hack.cy9c6_u
686695	0	0	0.0	2420.6	178.1	0.000	0.000	0.004	0.266	129889	40.8	0.189	48	15.2	16.5	6.3	0.115	29670	25674	480m.fbmy8028_ef5b9b101_jun23_hack.cy9c7_u
l.x
l.x: create secondary indexes.
Average throughput:
Performance metrics for the DBMS listed above. Some are normalized by throughput, others are not. Legend for results is here.
ips	qps	rps	rmbps	wps	wmbps	rpq	rkbpq	wpi	wkbpi	csps	cpups	cspq	cpupq	dbgb1	dbgb2	rss	maxop	p50	p99	tag
1433134	0	30	0.2	1849.8	129.5	0.000	0.000	0.001	0.093	24391	26.7	0.017	15	32.4	33.8	33.4	0.003	NA	NA	480m.fbmy8028_ef5b9b101_jun23_hack.cy9c_u
1454848	0	30	0.2	2108.2	144.1	0.000	0.000	0.001	0.101	26727	28.7	0.018	16	32.5	33.8	43.8	0.004	NA	NA	480m.fbmy8028_ef5b9b101_jun23_hack.cy9c1_u
1446084	0	30	0.2	1898.2	133.5	0.000	0.000	0.001	0.095	25273	27.8	0.017	15	32.4	33.7	34.5	0.004	NA	NA	480m.fbmy8028_ef5b9b101_jun23_hack.cy9c2_u
1416224	0	29	0.2	1847.7	129.7	0.000	0.000	0.001	0.094	25506	27.5	0.018	16	32.4	33.7	35.4	0.003	NA	NA	480m.fbmy8028_ef5b9b101_jun23_hack.cy9c3_u
1454848	0	30	0.2	1860.2	132.4	0.000	0.000	0.001	0.093	23925	27.3	0.016	15	32.4	33.7	33.4	0.004	NA	NA	480m.fbmy8028_ef5b9b101_jun23_hack.cy9c4_u
1424629	0	30	0.2	1842.7	131.3	0.000	0.000	0.001	0.094	23821	27.1	0.017	15	32.3	33.7	33.9	0.003	NA	NA	480m.fbmy8028_ef5b9b101_jun23_hack.cy9c5_u
1450453	0	30	0.2	1876.2	132.1	0.000	0.000	0.001	0.093	23604	27.0	0.016	15	32.3	33.6	36.0	0.003	NA	NA	480m.fbmy8028_ef5b9b101_jun23_hack.cy9c6_u
1441742	0	30	0.2	1833.8	129.0	0.000	0.000	0.001	0.092	24276	26.7	0.017	15	32.5	33.8	35.5	0.003	NA	NA	480m.fbmy8028_ef5b9b101_jun23_hack.cy9c7_u
l.i1
l.i1: continue load after secondary indexes created. Graphs for performance per 1-second interval are here.
Average throughput:
Insert response time histogram: each cell has the percentage of responses that take <= the time in the header and max is the max response time in seconds. For the max column values in the top 25% of the range have a red background and in the bottom 25% of the range have a green background. The red background is not used when the min value is within 80% of the max value.
| dbms | 256us | 1ms | 4ms | 16ms | 64ms | 256ms | 1s | 4s | 16s | gt | max |
|---|---|---|---|---|---|---|---|---|---|---|---|
| fbmy8028_ef5b9b101_jun23_hack.cy9c_u | 0.029 | 18.565 | 80.876 | 0.458 | 0.063 | 0.010 | 2.044 | ||||
| fbmy8028_ef5b9b101_jun23_hack.cy9c1_u | 0.027 | 22.664 | 76.910 | 0.356 | 0.042 | 0.002 | 1.291 | ||||
| fbmy8028_ef5b9b101_jun23_hack.cy9c2_u | 0.036 | 16.370 | 83.022 | 0.528 | 0.041 | 0.002 | 1.253 | ||||
| fbmy8028_ef5b9b101_jun23_hack.cy9c3_u | 0.025 | 16.016 | 68.329 | 11.886 | 3.743 | 0.001 | 1.139 | ||||
| fbmy8028_ef5b9b101_jun23_hack.cy9c4_u | 0.025 | 15.137 | 77.397 | 7.408 | 0.031 | 0.002 | nonzero | 6.115 | |||
| fbmy8028_ef5b9b101_jun23_hack.cy9c5_u | 0.025 | 18.980 | 80.988 | 0.006 | 0.179 | ||||||
| fbmy8028_ef5b9b101_jun23_hack.cy9c6_u | 0.026 | 21.096 | 78.874 | 0.005 | 0.140 | ||||||
| fbmy8028_ef5b9b101_jun23_hack.cy9c7_u | 0.027 | 19.056 | 80.912 | 0.005 | 0.192 |
Delete response time histogram: each cell has the percentage of responses that take <= the time in the header and max is the max response time in seconds. For the max column values in the top 25% of the range have a red background and in the bottom 25% of the range have a green background. The red background is not used when the min value is within 80% of the max value.
| dbms | 256us | 1ms | 4ms | 16ms | 64ms | 256ms | 1s | 4s | 16s | gt | max |
|---|---|---|---|---|---|---|---|---|---|---|---|
| fbmy8028_ef5b9b101_jun23_hack.cy9c_u | 0.028 | 18.476 | 80.964 | 0.459 | 0.063 | 0.010 | 2.044 | ||||
| fbmy8028_ef5b9b101_jun23_hack.cy9c1_u | 0.028 | 22.814 | 76.758 | 0.357 | 0.042 | 0.002 | 1.291 | ||||
| fbmy8028_ef5b9b101_jun23_hack.cy9c2_u | 0.037 | 16.167 | 83.221 | 0.531 | 0.041 | 0.002 | 1.253 | ||||
| fbmy8028_ef5b9b101_jun23_hack.cy9c3_u | 0.027 | 16.361 | 67.987 | 11.884 | 3.741 | 0.001 | 1.139 | ||||
| fbmy8028_ef5b9b101_jun23_hack.cy9c4_u | 0.027 | 15.889 | 76.675 | 7.376 | 0.031 | 0.002 | nonzero | 6.115 | |||
| fbmy8028_ef5b9b101_jun23_hack.cy9c5_u | 0.027 | 19.565 | 80.401 | 0.007 | nonzero | 0.279 | |||||
| fbmy8028_ef5b9b101_jun23_hack.cy9c6_u | 0.028 | 22.255 | 77.712 | 0.005 | nonzero | 0.287 | |||||
| fbmy8028_ef5b9b101_jun23_hack.cy9c7_u | 0.029 | 20.213 | 79.752 | 0.005 | nonzero | 0.296 |
Performance metrics for the DBMS listed above. Some are normalized by throughput, others are not. Legend for results is here.
ips	qps	rps	rmbps	wps	wmbps	rpq	rkbpq	wpi	wkbpi	csps	cpups	cspq	cpupq	dbgb1	dbgb2	rss	maxop	p50	p99	tag
60432	0	103	1.2	1209.8	78.3	0.002	0.020	0.020	1.327	183437	18.3	3.035	242	48.3	48.6	175.9	2.044	2697	50	480m.fbmy8028_ef5b9b101_jun23_hack.cy9c_u
63125	0	127	1.5	1270.0	81.9	0.002	0.024	0.020	1.329	74007	16.4	1.172	208	57.5	57.8	178.5	1.291	2747	150	480m.fbmy8028_ef5b9b101_jun23_hack.cy9c1_u
60003	0	126	1.3	1212.3	78.2	0.002	0.023	0.020	1.334	291795	20.1	4.863	268	41.1	41.4	178.2	1.253	2647	150	480m.fbmy8028_ef5b9b101_jun23_hack.cy9c2_u
25858	0	24	0.4	713.3	45.2	0.001	0.017	0.028	1.789	52450	8.5	2.028	263	42.0	42.3	175.9	1.139	350	100	480m.fbmy8028_ef5b9b101_jun23_hack.cy9c3_u
43727	0	36	0.7	1116.3	69.4	0.001	0.018	0.026	1.626	103964	13.1	2.378	240	39.0	39.3	177.5	6.115	2148	300	480m.fbmy8028_ef5b9b101_jun23_hack.cy9c4_u
64568	0	47	0.9	1637.0	104.0	0.001	0.014	0.025	1.650	123128	18.5	1.907	229	40.7	40.9	177.4	0.179	2697	2398	480m.fbmy8028_ef5b9b101_jun23_hack.cy9c5_u
65865	0	51	1.0	1656.1	105.3	0.001	0.015	0.025	1.637	78449	17.7	1.191	215	38.1	38.3	177.6	0.140	2747	2448	480m.fbmy8028_ef5b9b101_jun23_hack.cy9c6_u
64669	0	53	1.0	1631.9	104.2	0.001	0.015	0.025	1.649	77216	17.5	1.194	216	38.2	38.4	177.5	0.192	2697	2398	480m.fbmy8028_ef5b9b101_jun23_hack.cy9c7_u
q100.1
q100.1: range queries with 100 insert/s per client. Graphs for performance per 1-second interval are here.
Average throughput:
Query response time histogram: each cell has the percentage of responses that take <= the time in the header and max is the max response time in seconds. For max values in the top 25% of the range have a red background and in the bottom 25% of the range have a green background. The red background is not used when the min value is within 80% of the max value.
| dbms | 256us | 1ms | 4ms | 16ms | 64ms | 256ms | 1s | 4s | 16s | gt | max |
|---|---|---|---|---|---|---|---|---|---|---|---|
| fbmy8028_ef5b9b101_jun23_hack.cy9c_u | 52.150 | 47.849 | 0.002 | nonzero | nonzero | 0.032 | |||||
| fbmy8028_ef5b9b101_jun23_hack.cy9c1_u | 61.782 | 38.215 | 0.002 | nonzero | nonzero | nonzero | nonzero | 0.310 | |||
| fbmy8028_ef5b9b101_jun23_hack.cy9c2_u | 50.219 | 49.779 | 0.002 | nonzero | nonzero | 0.020 | |||||
| fbmy8028_ef5b9b101_jun23_hack.cy9c3_u | 54.071 | 45.928 | 0.001 | nonzero | nonzero | 0.040 | |||||
| fbmy8028_ef5b9b101_jun23_hack.cy9c4_u | 54.261 | 45.738 | 0.001 | nonzero | nonzero | 0.021 | |||||
| fbmy8028_ef5b9b101_jun23_hack.cy9c5_u | 53.516 | 46.483 | 0.001 | nonzero | 0.007 | ||||||
| fbmy8028_ef5b9b101_jun23_hack.cy9c6_u | 63.095 | 36.904 | 0.001 | nonzero | nonzero | 0.024 | |||||
| fbmy8028_ef5b9b101_jun23_hack.cy9c7_u | 63.205 | 36.793 | 0.001 | nonzero | nonzero | 0.017 |
Insert response time histogram: each cell has the percentage of responses that take <= the time in the header and max is the max response time in seconds. For max values in the top 25% of the range have a red background and in the bottom 25% of the range have a green background. The red background is not used when the min value is within 80% of the max value.
| dbms | 256us | 1ms | 4ms | 16ms | 64ms | 256ms | 1s | 4s | 16s | gt | max |
|---|---|---|---|---|---|---|---|---|---|---|---|
| fbmy8028_ef5b9b101_jun23_hack.cy9c_u | 99.950 | 0.050 | 0.007 | ||||||||
| fbmy8028_ef5b9b101_jun23_hack.cy9c1_u | 99.961 | 0.039 | 0.008 | ||||||||
| fbmy8028_ef5b9b101_jun23_hack.cy9c2_u | 99.907 | 0.091 | 0.002 | 0.023 | |||||||
| fbmy8028_ef5b9b101_jun23_hack.cy9c3_u | 97.731 | 2.269 | 0.015 | ||||||||
| fbmy8028_ef5b9b101_jun23_hack.cy9c4_u | 98.880 | 1.120 | 0.009 | ||||||||
| fbmy8028_ef5b9b101_jun23_hack.cy9c5_u | 97.676 | 2.324 | 0.013 | ||||||||
| fbmy8028_ef5b9b101_jun23_hack.cy9c6_u | 99.884 | 0.116 | 0.009 | ||||||||
| fbmy8028_ef5b9b101_jun23_hack.cy9c7_u | 99.519 | 0.481 | 0.008 |
Delete response time histogram: each cell has the percentage of responses that take <= the time in the header and max is the max response time in seconds. For max values in the top 25% of the range have a red background and in the bottom 25% of the range have a green background. The red background is not used when the min value is within 80% of the max value.
| dbms | 256us | 1ms | 4ms | 16ms | 64ms | 256ms | 1s | 4s | 16s | gt | max |
|---|---|---|---|---|---|---|---|---|---|---|---|
| fbmy8028_ef5b9b101_jun23_hack.cy9c_u | 99.974 | 0.026 | 0.015 | ||||||||
| fbmy8028_ef5b9b101_jun23_hack.cy9c1_u | 99.966 | 0.030 | 0.003 | 0.001 | 0.141 | ||||||
| fbmy8028_ef5b9b101_jun23_hack.cy9c2_u | 99.959 | 0.036 | 0.005 | 0.056 | |||||||
| fbmy8028_ef5b9b101_jun23_hack.cy9c3_u | 98.699 | 1.299 | 0.002 | 0.040 | |||||||
| fbmy8028_ef5b9b101_jun23_hack.cy9c4_u | 99.488 | 0.509 | 0.003 | 0.050 | |||||||
| fbmy8028_ef5b9b101_jun23_hack.cy9c5_u | 98.640 | 1.358 | 0.002 | 0.029 | |||||||
| fbmy8028_ef5b9b101_jun23_hack.cy9c6_u | 99.953 | 0.045 | 0.003 | 0.038 | |||||||
| fbmy8028_ef5b9b101_jun23_hack.cy9c7_u | 99.758 | 0.240 | 0.002 | 0.001 | 0.077 |
Performance metrics for the DBMS listed above. Some are normalized by throughput, others are not. Legend for results is here.
ips	qps	rps	rmbps	wps	wmbps	rpq	rkbpq	wpi	wkbpi	csps	cpups	cspq	cpupq	dbgb1	dbgb2	rss	maxop	p50	p99	tag
2381	87738	8	0.2	127.2	7.6	0.000	0.002	0.053	3.255	356341	32.3	4.061	295	36.4	38.6	180.2	0.032	3660	2653	480m.fbmy8028_ef5b9b101_jun23_hack.cy9c_u
2381	92313	220	2.2	135.7	8.0	0.002	0.024	0.057	3.447	374270	32.4	4.054	281	36.5	38.6	180.5	0.310	3884	3069	480m.fbmy8028_ef5b9b101_jun23_hack.cy9c1_u
2381	87252	6	0.2	98.0	5.8	0.000	0.002	0.041	2.479	355542	32.2	4.075	295	36.5	36.8	179.9	0.020	3645	3118	480m.fbmy8028_ef5b9b101_jun23_hack.cy9c2_u
2382	88772	12	0.3	81.9	4.9	0.000	0.003	0.034	2.107	360415	32.1	4.060	289	37.4	39.5	177.5	0.040	3724	3293	480m.fbmy8028_ef5b9b101_jun23_hack.cy9c3_u
2381	88831	10	0.3	76.8	4.4	0.000	0.003	0.032	1.908	360092	32.0	4.054	288	37.2	39.4	178.8	0.021	3708	3293	480m.fbmy8028_ef5b9b101_jun23_hack.cy9c4_u
2381	88507	8	0.3	84.8	4.9	0.000	0.003	0.036	2.093	358859	32.1	4.055	290	37.0	39.2	179.0	0.007	3741	3276	480m.fbmy8028_ef5b9b101_jun23_hack.cy9c5_u
2381	93052	8	0.3	83.2	4.7	0.000	0.003	0.035	2.029	376600	32.1	4.047	276	37.1	39.2	179.2	0.024	3900	3484	480m.fbmy8028_ef5b9b101_jun23_hack.cy9c6_u
2381	93160	10	0.3	87.8	5.1	0.000	0.003	0.037	2.192	376961	32.1	4.046	276	37.2	39.3	179.2	0.017	3915	3452	480m.fbmy8028_ef5b9b101_jun23_hack.cy9c7_u
q500.1
q500.1: range queries with 500 insert/s per client. Graphs for performance per 1-second interval are here.
Average throughput:
Query response time histogram: each cell has the percentage of responses that take <= the time in the header and max is the max response time in seconds. For max values in the top 25% of the range have a red background and in the bottom 25% of the range have a green background. The red background is not used when the min value is within 80% of the max value.
| dbms | 256us | 1ms | 4ms | 16ms | 64ms | 256ms | 1s | 4s | 16s | gt | max |
|---|---|---|---|---|---|---|---|---|---|---|---|
| fbmy8028_ef5b9b101_jun23_hack.cy9c_u | 33.049 | 66.948 | 0.003 | nonzero | nonzero | 0.001 | 0.087 | ||||
| fbmy8028_ef5b9b101_jun23_hack.cy9c1_u | 44.048 | 55.950 | 0.003 | nonzero | nonzero | 0.057 | |||||
| fbmy8028_ef5b9b101_jun23_hack.cy9c2_u | 31.561 | 68.436 | 0.003 | nonzero | nonzero | nonzero | 0.326 | ||||
| fbmy8028_ef5b9b101_jun23_hack.cy9c3_u | 33.748 | 66.249 | 0.003 | nonzero | nonzero | 0.001 | 0.085 | ||||
| fbmy8028_ef5b9b101_jun23_hack.cy9c4_u | 39.159 | 60.838 | 0.003 | nonzero | nonzero | 0.001 | 0.085 | ||||
| fbmy8028_ef5b9b101_jun23_hack.cy9c5_u | 37.801 | 62.196 | 0.003 | nonzero | nonzero | 0.001 | 0.111 | ||||
| fbmy8028_ef5b9b101_jun23_hack.cy9c6_u | 50.176 | 49.822 | 0.002 | nonzero | nonzero | 0.052 | |||||
| fbmy8028_ef5b9b101_jun23_hack.cy9c7_u | 49.627 | 50.371 | 0.002 | nonzero | nonzero | 0.042 |
Insert response time histogram: each cell has the percentage of responses that take <= the time in the header and max is the max response time in seconds. For max values in the top 25% of the range have a red background and in the bottom 25% of the range have a green background. The red background is not used when the min value is within 80% of the max value.
| dbms | 256us | 1ms | 4ms | 16ms | 64ms | 256ms | 1s | 4s | 16s | gt | max |
|---|---|---|---|---|---|---|---|---|---|---|---|
| fbmy8028_ef5b9b101_jun23_hack.cy9c_u | 24.763 | 70.001 | 5.231 | 0.005 | 0.122 | ||||||
| fbmy8028_ef5b9b101_jun23_hack.cy9c1_u | 23.223 | 69.586 | 7.191 | 0.039 | |||||||
| fbmy8028_ef5b9b101_jun23_hack.cy9c2_u | 27.737 | 68.731 | 3.521 | 0.008 | 0.003 | 0.314 | |||||
| fbmy8028_ef5b9b101_jun23_hack.cy9c3_u | 27.672 | 72.120 | 0.203 | 0.004 | 0.094 | ||||||
| fbmy8028_ef5b9b101_jun23_hack.cy9c4_u | 27.796 | 71.972 | 0.230 | 0.002 | 0.085 | ||||||
| fbmy8028_ef5b9b101_jun23_hack.cy9c5_u | 24.202 | 63.240 | 12.554 | 0.005 | 0.097 | ||||||
| fbmy8028_ef5b9b101_jun23_hack.cy9c6_u | 23.679 | 72.099 | 4.221 | 0.037 | |||||||
| fbmy8028_ef5b9b101_jun23_hack.cy9c7_u | 24.349 | 68.004 | 7.645 | 0.002 | 0.091 |
Delete response time histogram: each cell has the percentage of responses that take <= the time in the header and max is the max response time in seconds. For max values in the top 25% of the range have a red background and in the bottom 25% of the range have a green background. The red background is not used when the min value is within 80% of the max value.
| dbms | 256us | 1ms | 4ms | 16ms | 64ms | 256ms | 1s | 4s | 16s | gt | max |
|---|---|---|---|---|---|---|---|---|---|---|---|
| fbmy8028_ef5b9b101_jun23_hack.cy9c_u | 26.780 | 68.026 | 5.187 | 0.006 | 0.122 | ||||||
| fbmy8028_ef5b9b101_jun23_hack.cy9c1_u | 24.072 | 68.770 | 7.158 | nonzero | 0.070 | ||||||
| fbmy8028_ef5b9b101_jun23_hack.cy9c2_u | 29.853 | 66.662 | 3.471 | 0.009 | 0.005 | 0.315 | |||||
| fbmy8028_ef5b9b101_jun23_hack.cy9c3_u | 30.053 | 69.740 | 0.201 | 0.006 | 0.097 | ||||||
| fbmy8028_ef5b9b101_jun23_hack.cy9c4_u | 29.637 | 70.129 | 0.230 | 0.004 | 0.090 | ||||||
| fbmy8028_ef5b9b101_jun23_hack.cy9c5_u | 25.337 | 62.200 | 12.457 | 0.006 | 0.096 | ||||||
| fbmy8028_ef5b9b101_jun23_hack.cy9c6_u | 24.828 | 70.991 | 4.180 | nonzero | 0.072 | ||||||
| fbmy8028_ef5b9b101_jun23_hack.cy9c7_u | 25.732 | 66.678 | 7.589 | 0.002 | 0.091 |
Performance metrics for the DBMS listed above. Some are normalized by throughput, others are not. Legend for results is here.
ips	qps	rps	rmbps	wps	wmbps	rpq	rkbpq	wpi	wkbpi	csps	cpups	cspq	cpupq	dbgb1	dbgb2	rss	maxop	p50	p99	tag
11907	80814	21	0.2	318.8	19.6	0.000	0.003	0.027	1.685	337982	34.1	4.182	338	36.8	38.2	183.7	0.087	3373	2941	480m.fbmy8028_ef5b9b101_jun23_hack.cy9c_u
11907	85024	24	0.3	324.2	20.0	0.000	0.004	0.027	1.723	352683	34.1	4.148	321	36.9	38.2	183.5	0.057	3565	3133	480m.fbmy8028_ef5b9b101_jun23_hack.cy9c1_u
11907	80274	22	0.2	323.2	19.9	0.000	0.003	0.027	1.713	338777	34.0	4.220	339	36.8	38.2	183.3	0.326	3388	2973	480m.fbmy8028_ef5b9b101_jun23_hack.cy9c2_u
11911	81070	14	0.2	323.4	19.8	0.000	0.002	0.027	1.704	337645	34.1	4.165	336	37.7	39.1	182.5	0.085	3420	2989	480m.fbmy8028_ef5b9b101_jun23_hack.cy9c3_u
11907	83100	16	0.2	335.8	20.6	0.000	0.002	0.028	1.771	345666	34.2	4.160	329	37.5	38.9	183.2	0.085	3486	3069	480m.fbmy8028_ef5b9b101_jun23_hack.cy9c4_u
11911	82601	16	0.2	347.2	21.2	0.000	0.003	0.029	1.824	346146	34.4	4.191	333	37.3	38.7	183.3	0.111	3469	2973	480m.fbmy8028_ef5b9b101_jun23_hack.cy9c5_u
11907	87568	16	0.2	345.0	21.3	0.000	0.002	0.029	1.831	363313	34.4	4.149	314	37.5	38.8	183.1	0.052	3692	3229	480m.fbmy8028_ef5b9b101_jun23_hack.cy9c6_u
11907	87427	16	0.2	347.9	21.4	0.000	0.003	0.029	1.837	362169	34.4	4.143	315	37.2	38.6	183.2	0.042	3676	3229	480m.fbmy8028_ef5b9b101_jun23_hack.cy9c7_u
q1000.1
q1000.1: range queries with 1000 insert/s per client. Graphs for performance per 1-second interval are here.
Average throughput:
Query response time histogram: each cell has the percentage of responses that take <= the time in the header and max is the max response time in seconds. For max values in the top 25% of the range have a red background and in the bottom 25% of the range have a green background. The red background is not used when the min value is within 80% of the max value.
| dbms | 256us | 1ms | 4ms | 16ms | 64ms | 256ms | 1s | 4s | 16s | gt | max |
|---|---|---|---|---|---|---|---|---|---|---|---|
| fbmy8028_ef5b9b101_jun23_hack.cy9c_u | 15.216 | 84.768 | 0.016 | nonzero | nonzero | nonzero | 0.083 | ||||
| fbmy8028_ef5b9b101_jun23_hack.cy9c1_u | 23.169 | 76.818 | 0.013 | nonzero | nonzero | nonzero | 0.094 | ||||
| fbmy8028_ef5b9b101_jun23_hack.cy9c2_u | 13.835 | 86.146 | 0.018 | nonzero | nonzero | nonzero | 0.068 | ||||
| fbmy8028_ef5b9b101_jun23_hack.cy9c3_u | 8.747 | 91.240 | 0.013 | nonzero | nonzero | nonzero | 0.155 | ||||
| fbmy8028_ef5b9b101_jun23_hack.cy9c4_u | 17.376 | 82.607 | 0.017 | nonzero | nonzero | 0.050 | |||||
| fbmy8028_ef5b9b101_jun23_hack.cy9c5_u | 21.662 | 78.323 | 0.015 | nonzero | nonzero | nonzero | 0.148 | ||||
| fbmy8028_ef5b9b101_jun23_hack.cy9c6_u | 30.525 | 69.460 | 0.015 | nonzero | nonzero | nonzero | 0.098 | ||||
| fbmy8028_ef5b9b101_jun23_hack.cy9c7_u | 30.903 | 69.084 | 0.013 | nonzero | nonzero | 0.056 |
Insert response time histogram: each cell has the percentage of responses that take <= the time in the header and max is the max response time in seconds. For max values in the top 25% of the range have a red background and in the bottom 25% of the range have a green background. The red background is not used when the min value is within 80% of the max value.
| dbms | 256us | 1ms | 4ms | 16ms | 64ms | 256ms | 1s | 4s | 16s | gt | max |
|---|---|---|---|---|---|---|---|---|---|---|---|
| fbmy8028_ef5b9b101_jun23_hack.cy9c_u | 2.967 | 15.822 | 81.209 | 0.001 | 0.092 | ||||||
| fbmy8028_ef5b9b101_jun23_hack.cy9c1_u | 2.720 | 16.855 | 80.425 | 0.061 | |||||||
| fbmy8028_ef5b9b101_jun23_hack.cy9c2_u | 4.254 | 24.760 | 70.985 | 0.001 | 0.131 | ||||||
| fbmy8028_ef5b9b101_jun23_hack.cy9c3_u | 9.670 | 46.904 | 42.646 | 0.754 | 0.025 | 0.299 | |||||
| fbmy8028_ef5b9b101_jun23_hack.cy9c4_u | 1.391 | 13.833 | 84.753 | 0.023 | 0.117 | ||||||
| fbmy8028_ef5b9b101_jun23_hack.cy9c5_u | 2.377 | 15.710 | 81.911 | 0.003 | 0.082 | ||||||
| fbmy8028_ef5b9b101_jun23_hack.cy9c6_u | 1.465 | 11.964 | 86.567 | 0.004 | 0.105 | ||||||
| fbmy8028_ef5b9b101_jun23_hack.cy9c7_u | 2.478 | 14.528 | 82.991 | 0.004 | 0.103 |
Delete response time histogram: each cell has the percentage of responses that take <= the time in the header and max is the max response time in seconds. For max values in the top 25% of the range have a red background and in the bottom 25% of the range have a green background. The red background is not used when the min value is within 80% of the max value.
| dbms | 256us | 1ms | 4ms | 16ms | 64ms | 256ms | 1s | 4s | 16s | gt | max |
|---|---|---|---|---|---|---|---|---|---|---|---|
| fbmy8028_ef5b9b101_jun23_hack.cy9c_u | 2.988 | 15.857 | 81.153 | 0.002 | 0.116 | ||||||
| fbmy8028_ef5b9b101_jun23_hack.cy9c1_u | 2.712 | 16.872 | 80.415 | nonzero | 0.140 | ||||||
| fbmy8028_ef5b9b101_jun23_hack.cy9c2_u | 4.456 | 24.694 | 70.848 | 0.002 | 0.134 | ||||||
| fbmy8028_ef5b9b101_jun23_hack.cy9c3_u | 10.102 | 46.507 | 42.612 | 0.755 | 0.025 | 0.299 | |||||
| fbmy8028_ef5b9b101_jun23_hack.cy9c4_u | 1.369 | 13.886 | 84.722 | 0.023 | 0.116 | ||||||
| fbmy8028_ef5b9b101_jun23_hack.cy9c5_u | 2.412 | 15.728 | 81.856 | 0.003 | 0.088 | ||||||
| fbmy8028_ef5b9b101_jun23_hack.cy9c6_u | 1.425 | 12.040 | 86.531 | 0.005 | 0.105 | ||||||
| fbmy8028_ef5b9b101_jun23_hack.cy9c7_u | 2.496 | 14.562 | 82.938 | 0.004 | 0.103 |
Performance metrics for the DBMS listed above. Some are normalized by throughput, others are not. Legend for results is here.
ips	qps	rps	rmbps	wps	wmbps	rpq	rkbpq	wpi	wkbpi	csps	cpups	cspq	cpupq	dbgb1	dbgb2	rss	maxop	p50	p99	tag
23828	72124	44	0.5	625.5	37.8	0.001	0.008	0.026	1.625	327343	38.1	4.539	423	37.4	39.3	185.8	0.083	3005	2621	480m.fbmy8028_ef5b9b101_jun23_hack.cy9c_u
23828	76070	43	0.5	629.1	38.9	0.001	0.007	0.026	1.670	329651	37.7	4.334	396	37.3	39.2	185.3	0.094	3165	2765	480m.fbmy8028_ef5b9b101_jun23_hack.cy9c1_u
23828	71008	48	0.5	623.4	38.3	0.001	0.008	0.026	1.648	338437	38.3	4.766	431	37.3	39.2	185.7	0.068	2973	2558	480m.fbmy8028_ef5b9b101_jun23_hack.cy9c2_u
23613	68222	42	0.6	664.9	41.6	0.001	0.009	0.028	1.806	302488	37.9	4.434	444	38.1	40.0	185.6	0.155	2861	2334	480m.fbmy8028_ef5b9b101_jun23_hack.cy9c3_u
23834	73609	35	0.4	656.3	40.0	0.000	0.006	0.028	1.718	330283	38.4	4.487	417	37.9	39.9	185.8	0.050	3053	2701	480m.fbmy8028_ef5b9b101_jun23_hack.cy9c4_u
23828	75721	41	0.5	647.8	39.1	0.001	0.007	0.027	1.680	335719	38.2	4.434	404	38.6	40.4	185.7	0.148	3149	2685	480m.fbmy8028_ef5b9b101_jun23_hack.cy9c5_u
23834	79422	42	0.5	647.9	39.6	0.001	0.007	0.027	1.699	343451	38.2	4.324	385	38.7	40.6	185.2	0.098	3309	2797	480m.fbmy8028_ef5b9b101_jun23_hack.cy9c6_u
23828	79647	37	0.4	649.8	39.7	0.000	0.006	0.027	1.705	343444	38.0	4.312	382	38.0	39.9	185.3	0.056	3325	2845	480m.fbmy8028_ef5b9b101_jun23_hack.cy9c7_u
l.i0
l.i0: load without secondary indexes
Performance metrics for all DBMS, not just the ones listed above. Some are normalized by throughput, others are not. Legend for results is here.
ips	qps	rps	rmbps	wps	wmbps	rpq	rkbpq	wpi	wkbpi	csps	cpups	cspq	cpupq	dbgb1	dbgb2	rss	maxop	p50	p99	tag
562720	0	0	0.0	1807.6	121.2	0.000	0.000	0.003	0.221	347597	39.3	0.618	56	15.3	16.6	3.9	0.109	24176	14585	480m.fbmy8028_ef5b9b101_jun23_hack.cy9c_u
634082	0	0	0.0	2142.6	145.1	0.000	0.000	0.003	0.234	115585	40.7	0.182	51	18.7	20.1	6.3	0.173	27972	10191	480m.fbmy8028_ef5b9b101_jun23_hack.cy9c1_u
478088	0	0	0.0	1602.7	116.2	0.000	0.000	0.003	0.249	420609	34.8	0.880	58	15.4	16.8	4.1	0.171	20679	10190	480m.fbmy8028_ef5b9b101_jun23_hack.cy9c2_u
289505	0	0	0.0	1121.6	78.7	0.000	0.000	0.004	0.278	66043	19.1	0.228	53	16.2	17.5	4.8	0.301	2198	599	480m.fbmy8028_ef5b9b101_jun23_hack.cy9c3_u
429722	0	0	0.0	1428.6	108.1	0.000	0.000	0.003	0.258	218036	28.1	0.507	52	15.1	16.4	4.0	0.225	20676	3496	480m.fbmy8028_ef5b9b101_jun23_hack.cy9c4_u
645161	0	0	0.0	2266.3	174.4	0.000	0.000	0.004	0.277	225369	40.3	0.349	50	15.2	16.6	4.3	0.172	27972	22278	480m.fbmy8028_ef5b9b101_jun23_hack.cy9c5_u
687679	0	0	0.0	2385.2	178.9	0.000	0.000	0.003	0.266	129571	40.6	0.188	47	15.2	16.5	6.4	0.099	29670	25674	480m.fbmy8028_ef5b9b101_jun23_hack.cy9c6_u
686695	0	0	0.0	2420.6	178.1	0.000	0.000	0.004	0.266	129889	40.8	0.189	48	15.2	16.5	6.3	0.115	29670	25674	480m.fbmy8028_ef5b9b101_jun23_hack.cy9c7_u
l.x
l.x: create secondary indexes
Performance metrics for all DBMS, not just the ones listed above. Some are normalized by throughput, others are not. Legend for results is here.
ips	qps	rps	rmbps	wps	wmbps	rpq	rkbpq	wpi	wkbpi	csps	cpups	cspq	cpupq	dbgb1	dbgb2	rss	maxop	p50	p99	tag
1433134	0	30	0.2	1849.8	129.5	0.000	0.000	0.001	0.093	24391	26.7	0.017	15	32.4	33.8	33.4	0.003	NA	NA	480m.fbmy8028_ef5b9b101_jun23_hack.cy9c_u
1454848	0	30	0.2	2108.2	144.1	0.000	0.000	0.001	0.101	26727	28.7	0.018	16	32.5	33.8	43.8	0.004	NA	NA	480m.fbmy8028_ef5b9b101_jun23_hack.cy9c1_u
1446084	0	30	0.2	1898.2	133.5	0.000	0.000	0.001	0.095	25273	27.8	0.017	15	32.4	33.7	34.5	0.004	NA	NA	480m.fbmy8028_ef5b9b101_jun23_hack.cy9c2_u
1416224	0	29	0.2	1847.7	129.7	0.000	0.000	0.001	0.094	25506	27.5	0.018	16	32.4	33.7	35.4	0.003	NA	NA	480m.fbmy8028_ef5b9b101_jun23_hack.cy9c3_u
1454848	0	30	0.2	1860.2	132.4	0.000	0.000	0.001	0.093	23925	27.3	0.016	15	32.4	33.7	33.4	0.004	NA	NA	480m.fbmy8028_ef5b9b101_jun23_hack.cy9c4_u
1424629	0	30	0.2	1842.7	131.3	0.000	0.000	0.001	0.094	23821	27.1	0.017	15	32.3	33.7	33.9	0.003	NA	NA	480m.fbmy8028_ef5b9b101_jun23_hack.cy9c5_u
1450453	0	30	0.2	1876.2	132.1	0.000	0.000	0.001	0.093	23604	27.0	0.016	15	32.3	33.6	36.0	0.003	NA	NA	480m.fbmy8028_ef5b9b101_jun23_hack.cy9c6_u
1441742	0	30	0.2	1833.8	129.0	0.000	0.000	0.001	0.092	24276	26.7	0.017	15	32.5	33.8	35.5	0.003	NA	NA	480m.fbmy8028_ef5b9b101_jun23_hack.cy9c7_u
l.i1
l.i1: continue load after secondary indexes created
Performance metrics for all DBMS, not just the ones listed above. Some are normalized by throughput, others are not. Legend for results is here.
ips	qps	rps	rmbps	wps	wmbps	rpq	rkbpq	wpi	wkbpi	csps	cpups	cspq	cpupq	dbgb1	dbgb2	rss	maxop	p50	p99	tag
60432	0	103	1.2	1209.8	78.3	0.002	0.020	0.020	1.327	183437	18.3	3.035	242	48.3	48.6	175.9	2.044	2697	50	480m.fbmy8028_ef5b9b101_jun23_hack.cy9c_u
63125	0	127	1.5	1270.0	81.9	0.002	0.024	0.020	1.329	74007	16.4	1.172	208	57.5	57.8	178.5	1.291	2747	150	480m.fbmy8028_ef5b9b101_jun23_hack.cy9c1_u
60003	0	126	1.3	1212.3	78.2	0.002	0.023	0.020	1.334	291795	20.1	4.863	268	41.1	41.4	178.2	1.253	2647	150	480m.fbmy8028_ef5b9b101_jun23_hack.cy9c2_u
25858	0	24	0.4	713.3	45.2	0.001	0.017	0.028	1.789	52450	8.5	2.028	263	42.0	42.3	175.9	1.139	350	100	480m.fbmy8028_ef5b9b101_jun23_hack.cy9c3_u
43727	0	36	0.7	1116.3	69.4	0.001	0.018	0.026	1.626	103964	13.1	2.378	240	39.0	39.3	177.5	6.115	2148	300	480m.fbmy8028_ef5b9b101_jun23_hack.cy9c4_u
64568	0	47	0.9	1637.0	104.0	0.001	0.014	0.025	1.650	123128	18.5	1.907	229	40.7	40.9	177.4	0.179	2697	2398	480m.fbmy8028_ef5b9b101_jun23_hack.cy9c5_u
65865	0	51	1.0	1656.1	105.3	0.001	0.015	0.025	1.637	78449	17.7	1.191	215	38.1	38.3	177.6	0.140	2747	2448	480m.fbmy8028_ef5b9b101_jun23_hack.cy9c6_u
64669	0	53	1.0	1631.9	104.2	0.001	0.015	0.025	1.649	77216	17.5	1.194	216	38.2	38.4	177.5	0.192	2697	2398	480m.fbmy8028_ef5b9b101_jun23_hack.cy9c7_u
q100.1
q100.1: range queries with 100 insert/s per client
Performance metrics for all DBMS, not just the ones listed above. Some are normalized by throughput, others are not. Legend for results is here.
ips	qps	rps	rmbps	wps	wmbps	rpq	rkbpq	wpi	wkbpi	csps	cpups	cspq	cpupq	dbgb1	dbgb2	rss	maxop	p50	p99	tag
2381	87738	8	0.2	127.2	7.6	0.000	0.002	0.053	3.255	356341	32.3	4.061	295	36.4	38.6	180.2	0.032	3660	2653	480m.fbmy8028_ef5b9b101_jun23_hack.cy9c_u
2381	92313	220	2.2	135.7	8.0	0.002	0.024	0.057	3.447	374270	32.4	4.054	281	36.5	38.6	180.5	0.310	3884	3069	480m.fbmy8028_ef5b9b101_jun23_hack.cy9c1_u
2381	87252	6	0.2	98.0	5.8	0.000	0.002	0.041	2.479	355542	32.2	4.075	295	36.5	36.8	179.9	0.020	3645	3118	480m.fbmy8028_ef5b9b101_jun23_hack.cy9c2_u
2382	88772	12	0.3	81.9	4.9	0.000	0.003	0.034	2.107	360415	32.1	4.060	289	37.4	39.5	177.5	0.040	3724	3293	480m.fbmy8028_ef5b9b101_jun23_hack.cy9c3_u
2381	88831	10	0.3	76.8	4.4	0.000	0.003	0.032	1.908	360092	32.0	4.054	288	37.2	39.4	178.8	0.021	3708	3293	480m.fbmy8028_ef5b9b101_jun23_hack.cy9c4_u
2381	88507	8	0.3	84.8	4.9	0.000	0.003	0.036	2.093	358859	32.1	4.055	290	37.0	39.2	179.0	0.007	3741	3276	480m.fbmy8028_ef5b9b101_jun23_hack.cy9c5_u
2381	93052	8	0.3	83.2	4.7	0.000	0.003	0.035	2.029	376600	32.1	4.047	276	37.1	39.2	179.2	0.024	3900	3484	480m.fbmy8028_ef5b9b101_jun23_hack.cy9c6_u
2381	93160	10	0.3	87.8	5.1	0.000	0.003	0.037	2.192	376961	32.1	4.046	276	37.2	39.3	179.2	0.017	3915	3452	480m.fbmy8028_ef5b9b101_jun23_hack.cy9c7_u
q500.1
q500.1: range queries with 500 insert/s per client
Performance metrics for all DBMS, not just the ones listed above. Some are normalized by throughput, others are not. Legend for results is here.
ips	qps	rps	rmbps	wps	wmbps	rpq	rkbpq	wpi	wkbpi	csps	cpups	cspq	cpupq	dbgb1	dbgb2	rss	maxop	p50	p99	tag
11907	80814	21	0.2	318.8	19.6	0.000	0.003	0.027	1.685	337982	34.1	4.182	338	36.8	38.2	183.7	0.087	3373	2941	480m.fbmy8028_ef5b9b101_jun23_hack.cy9c_u
11907	85024	24	0.3	324.2	20.0	0.000	0.004	0.027	1.723	352683	34.1	4.148	321	36.9	38.2	183.5	0.057	3565	3133	480m.fbmy8028_ef5b9b101_jun23_hack.cy9c1_u
11907	80274	22	0.2	323.2	19.9	0.000	0.003	0.027	1.713	338777	34.0	4.220	339	36.8	38.2	183.3	0.326	3388	2973	480m.fbmy8028_ef5b9b101_jun23_hack.cy9c2_u
11911	81070	14	0.2	323.4	19.8	0.000	0.002	0.027	1.704	337645	34.1	4.165	336	37.7	39.1	182.5	0.085	3420	2989	480m.fbmy8028_ef5b9b101_jun23_hack.cy9c3_u
11907	83100	16	0.2	335.8	20.6	0.000	0.002	0.028	1.771	345666	34.2	4.160	329	37.5	38.9	183.2	0.085	3486	3069	480m.fbmy8028_ef5b9b101_jun23_hack.cy9c4_u
11911	82601	16	0.2	347.2	21.2	0.000	0.003	0.029	1.824	346146	34.4	4.191	333	37.3	38.7	183.3	0.111	3469	2973	480m.fbmy8028_ef5b9b101_jun23_hack.cy9c5_u
11907	87568	16	0.2	345.0	21.3	0.000	0.002	0.029	1.831	363313	34.4	4.149	314	37.5	38.8	183.1	0.052	3692	3229	480m.fbmy8028_ef5b9b101_jun23_hack.cy9c6_u
11907	87427	16	0.2	347.9	21.4	0.000	0.003	0.029	1.837	362169	34.4	4.143	315	37.2	38.6	183.2	0.042	3676	3229	480m.fbmy8028_ef5b9b101_jun23_hack.cy9c7_u
q1000.1
q1000.1: range queries with 1000 insert/s per client
Performance metrics for all DBMS, not just the ones listed above. Some are normalized by throughput, others are not. Legend for results is here.
ips	qps	rps	rmbps	wps	wmbps	rpq	rkbpq	wpi	wkbpi	csps	cpups	cspq	cpupq	dbgb1	dbgb2	rss	maxop	p50	p99	tag
23828	72124	44	0.5	625.5	37.8	0.001	0.008	0.026	1.625	327343	38.1	4.539	423	37.4	39.3	185.8	0.083	3005	2621	480m.fbmy8028_ef5b9b101_jun23_hack.cy9c_u
23828	76070	43	0.5	629.1	38.9	0.001	0.007	0.026	1.670	329651	37.7	4.334	396	37.3	39.2	185.3	0.094	3165	2765	480m.fbmy8028_ef5b9b101_jun23_hack.cy9c1_u
23828	71008	48	0.5	623.4	38.3	0.001	0.008	0.026	1.648	338437	38.3	4.766	431	37.3	39.2	185.7	0.068	2973	2558	480m.fbmy8028_ef5b9b101_jun23_hack.cy9c2_u
23613	68222	42	0.6	664.9	41.6	0.001	0.009	0.028	1.806	302488	37.9	4.434	444	38.1	40.0	185.6	0.155	2861	2334	480m.fbmy8028_ef5b9b101_jun23_hack.cy9c3_u
23834	73609	35	0.4	656.3	40.0	0.000	0.006	0.028	1.718	330283	38.4	4.487	417	37.9	39.9	185.8	0.050	3053	2701	480m.fbmy8028_ef5b9b101_jun23_hack.cy9c4_u
23828	75721	41	0.5	647.8	39.1	0.001	0.007	0.027	1.680	335719	38.2	4.434	404	38.6	40.4	185.7	0.148	3149	2685	480m.fbmy8028_ef5b9b101_jun23_hack.cy9c5_u
23834	79422	42	0.5	647.9	39.6	0.001	0.007	0.027	1.699	343451	38.2	4.324	385	38.7	40.6	185.2	0.098	3309	2797	480m.fbmy8028_ef5b9b101_jun23_hack.cy9c6_u
23828	79647	37	0.4	649.8	39.7	0.000	0.006	0.027	1.705	343444	38.0	4.312	382	38.0	39.9	185.3	0.056	3325	2845	480m.fbmy8028_ef5b9b101_jun23_hack.cy9c7_u
l.i0
- l.i0: load without secondary indexes
- Legend for results is here.
- Each entry lists the percentage of responses that fit in that bucket (slower than max time for previous bucket, faster than min time for next bucket).
Insert response time histogram
256us	1ms	4ms	16ms	64ms	256ms	1s	4s	16s	gt	max	tag
0.000	0.000	56.777	43.180	0.002	0.042	0.000	0.000	0.000	0.000	0.109	fbmy8028_ef5b9b101_jun23_hack.cy9c_u
0.000	0.000	82.698	17.174	0.085	0.043	0.000	0.000	0.000	0.000	0.173	fbmy8028_ef5b9b101_jun23_hack.cy9c1_u
0.000	0.000	35.105	64.850	0.002	0.042	0.000	0.000	0.000	0.000	0.171	fbmy8028_ef5b9b101_jun23_hack.cy9c2_u
0.000	0.000	81.045	12.564	2.635	3.756	nonzero	0.000	0.000	0.000	0.301	fbmy8028_ef5b9b101_jun23_hack.cy9c3_u
0.000	0.000	59.490	36.810	3.657	0.043	0.000	0.000	0.000	0.000	0.225	fbmy8028_ef5b9b101_jun23_hack.cy9c4_u
0.000	0.000	80.034	19.922	0.001	0.043	0.000	0.000	0.000	0.000	0.172	fbmy8028_ef5b9b101_jun23_hack.cy9c5_u
0.000	0.000	88.749	11.207	nonzero	0.043	0.000	0.000	0.000	0.000	0.099	fbmy8028_ef5b9b101_jun23_hack.cy9c6_u
0.000	0.000	88.594	11.362	0.001	0.043	0.000	0.000	0.000	0.000	0.115	fbmy8028_ef5b9b101_jun23_hack.cy9c7_u
l.x
- l.x: create secondary indexes
- Legend for results is here.
- Each entry lists the percentage of responses that fit in that bucket (slower than max time for previous bucket, faster than min time for next bucket).
TODO - determine whether there is data for create index response time
l.i1
- l.i1: continue load after secondary indexes created
- Legend for results is here.
- Each entry lists the percentage of responses that fit in that bucket (slower than max time for previous bucket, faster than min time for next bucket).
Insert response time histogram
256us	1ms	4ms	16ms	64ms	256ms	1s	4s	16s	gt	max	tag
0.000	0.000	0.029	18.565	80.876	0.458	0.063	0.010	0.000	0.000	2.044	fbmy8028_ef5b9b101_jun23_hack.cy9c_u
0.000	0.000	0.027	22.664	76.910	0.356	0.042	0.002	0.000	0.000	1.291	fbmy8028_ef5b9b101_jun23_hack.cy9c1_u
0.000	0.000	0.036	16.370	83.022	0.528	0.041	0.002	0.000	0.000	1.253	fbmy8028_ef5b9b101_jun23_hack.cy9c2_u
0.000	0.000	0.025	16.016	68.329	11.886	3.743	0.001	0.000	0.000	1.139	fbmy8028_ef5b9b101_jun23_hack.cy9c3_u
0.000	0.000	0.025	15.137	77.397	7.408	0.031	0.002	nonzero	0.000	6.115	fbmy8028_ef5b9b101_jun23_hack.cy9c4_u
0.000	0.000	0.025	18.980	80.988	0.006	0.000	0.000	0.000	0.000	0.179	fbmy8028_ef5b9b101_jun23_hack.cy9c5_u
0.000	0.000	0.026	21.096	78.874	0.005	0.000	0.000	0.000	0.000	0.140	fbmy8028_ef5b9b101_jun23_hack.cy9c6_u
0.000	0.000	0.027	19.056	80.912	0.005	0.000	0.000	0.000	0.000	0.192	fbmy8028_ef5b9b101_jun23_hack.cy9c7_u
Delete response time histogram
256us	1ms	4ms	16ms	64ms	256ms	1s	4s	16s	gt	max	tag
0.000	0.000	0.028	18.476	80.964	0.459	0.063	0.010	0.000	0.000	2.044	fbmy8028_ef5b9b101_jun23_hack.cy9c_u
0.000	0.000	0.028	22.814	76.758	0.357	0.042	0.002	0.000	0.000	1.291	fbmy8028_ef5b9b101_jun23_hack.cy9c1_u
0.000	0.000	0.037	16.167	83.221	0.531	0.041	0.002	0.000	0.000	1.253	fbmy8028_ef5b9b101_jun23_hack.cy9c2_u
0.000	0.000	0.027	16.361	67.987	11.884	3.741	0.001	0.000	0.000	1.139	fbmy8028_ef5b9b101_jun23_hack.cy9c3_u
0.000	0.000	0.027	15.889	76.675	7.376	0.031	0.002	nonzero	0.000	6.115	fbmy8028_ef5b9b101_jun23_hack.cy9c4_u
0.000	0.000	0.027	19.565	80.401	0.007	nonzero	0.000	0.000	0.000	0.279	fbmy8028_ef5b9b101_jun23_hack.cy9c5_u
0.000	0.000	0.028	22.255	77.712	0.005	nonzero	0.000	0.000	0.000	0.287	fbmy8028_ef5b9b101_jun23_hack.cy9c6_u
0.000	0.000	0.029	20.213	79.752	0.005	nonzero	0.000	0.000	0.000	0.296	fbmy8028_ef5b9b101_jun23_hack.cy9c7_u
q100.1
- q100.1: range queries with 100 insert/s per client
- Legend for results is here.
- Each entry lists the percentage of responses that fit in that bucket (slower than max time for previous bucket, faster than min time for next bucket).
Query response time histogram
256us	1ms	4ms	16ms	64ms	256ms	1s	4s	16s	gt	max	tag
52.150	47.849	0.002	nonzero	nonzero	0.000	0.000	0.000	0.000	0.000	0.032	fbmy8028_ef5b9b101_jun23_hack.cy9c_u
61.782	38.215	0.002	nonzero	nonzero	nonzero	nonzero	0.000	0.000	0.000	0.310	fbmy8028_ef5b9b101_jun23_hack.cy9c1_u
50.219	49.779	0.002	nonzero	nonzero	0.000	0.000	0.000	0.000	0.000	0.020	fbmy8028_ef5b9b101_jun23_hack.cy9c2_u
54.071	45.928	0.001	nonzero	nonzero	0.000	0.000	0.000	0.000	0.000	0.040	fbmy8028_ef5b9b101_jun23_hack.cy9c3_u
54.261	45.738	0.001	nonzero	nonzero	0.000	0.000	0.000	0.000	0.000	0.021	fbmy8028_ef5b9b101_jun23_hack.cy9c4_u
53.516	46.483	0.001	nonzero	0.000	0.000	0.000	0.000	0.000	0.000	0.007	fbmy8028_ef5b9b101_jun23_hack.cy9c5_u
63.095	36.904	0.001	nonzero	nonzero	0.000	0.000	0.000	0.000	0.000	0.024	fbmy8028_ef5b9b101_jun23_hack.cy9c6_u
63.205	36.793	0.001	nonzero	nonzero	0.000	0.000	0.000	0.000	0.000	0.017	fbmy8028_ef5b9b101_jun23_hack.cy9c7_u
Insert response time histogram
256us	1ms	4ms	16ms	64ms	256ms	1s	4s	16s	gt	max	tag
0.000	0.000	99.950	0.050	0.000	0.000	0.000	0.000	0.000	0.000	0.007	fbmy8028_ef5b9b101_jun23_hack.cy9c_u
0.000	0.000	99.961	0.039	0.000	0.000	0.000	0.000	0.000	0.000	0.008	fbmy8028_ef5b9b101_jun23_hack.cy9c1_u
0.000	0.000	99.907	0.091	0.002	0.000	0.000	0.000	0.000	0.000	0.023	fbmy8028_ef5b9b101_jun23_hack.cy9c2_u
0.000	0.000	97.731	2.269	0.000	0.000	0.000	0.000	0.000	0.000	0.015	fbmy8028_ef5b9b101_jun23_hack.cy9c3_u
0.000	0.000	98.880	1.120	0.000	0.000	0.000	0.000	0.000	0.000	0.009	fbmy8028_ef5b9b101_jun23_hack.cy9c4_u
0.000	0.000	97.676	2.324	0.000	0.000	0.000	0.000	0.000	0.000	0.013	fbmy8028_ef5b9b101_jun23_hack.cy9c5_u
0.000	0.000	99.884	0.116	0.000	0.000	0.000	0.000	0.000	0.000	0.009	fbmy8028_ef5b9b101_jun23_hack.cy9c6_u
0.000	0.000	99.519	0.481	0.000	0.000	0.000	0.000	0.000	0.000	0.008	fbmy8028_ef5b9b101_jun23_hack.cy9c7_u
Delete response time histogram
256us	1ms	4ms	16ms	64ms	256ms	1s	4s	16s	gt	max	tag
0.000	0.000	99.974	0.026	0.000	0.000	0.000	0.000	0.000	0.000	0.015	fbmy8028_ef5b9b101_jun23_hack.cy9c_u
0.000	0.000	99.966	0.030	0.003	0.001	0.000	0.000	0.000	0.000	0.141	fbmy8028_ef5b9b101_jun23_hack.cy9c1_u
0.000	0.000	99.959	0.036	0.005	0.000	0.000	0.000	0.000	0.000	0.056	fbmy8028_ef5b9b101_jun23_hack.cy9c2_u
0.000	0.000	98.699	1.299	0.002	0.000	0.000	0.000	0.000	0.000	0.040	fbmy8028_ef5b9b101_jun23_hack.cy9c3_u
0.000	0.000	99.488	0.509	0.003	0.000	0.000	0.000	0.000	0.000	0.050	fbmy8028_ef5b9b101_jun23_hack.cy9c4_u
0.000	0.000	98.640	1.358	0.002	0.000	0.000	0.000	0.000	0.000	0.029	fbmy8028_ef5b9b101_jun23_hack.cy9c5_u
0.000	0.000	99.953	0.045	0.003	0.000	0.000	0.000	0.000	0.000	0.038	fbmy8028_ef5b9b101_jun23_hack.cy9c6_u
0.000	0.000	99.758	0.240	0.002	0.001	0.000	0.000	0.000	0.000	0.077	fbmy8028_ef5b9b101_jun23_hack.cy9c7_u
q500.1
- q500.1: range queries with 500 insert/s per client
- Legend for results is here.
- Each entry lists the percentage of responses that fit in that bucket (slower than max time for previous bucket, faster than min time for next bucket).
Query response time histogram
256us	1ms	4ms	16ms	64ms	256ms	1s	4s	16s	gt	max	tag
33.049	66.948	0.003	nonzero	nonzero	0.001	0.000	0.000	0.000	0.000	0.087	fbmy8028_ef5b9b101_jun23_hack.cy9c_u
44.048	55.950	0.003	nonzero	nonzero	0.000	0.000	0.000	0.000	0.000	0.057	fbmy8028_ef5b9b101_jun23_hack.cy9c1_u
31.561	68.436	0.003	nonzero	nonzero	0.000	nonzero	0.000	0.000	0.000	0.326	fbmy8028_ef5b9b101_jun23_hack.cy9c2_u
33.748	66.249	0.003	nonzero	nonzero	0.001	0.000	0.000	0.000	0.000	0.085	fbmy8028_ef5b9b101_jun23_hack.cy9c3_u
39.159	60.838	0.003	nonzero	nonzero	0.001	0.000	0.000	0.000	0.000	0.085	fbmy8028_ef5b9b101_jun23_hack.cy9c4_u
37.801	62.196	0.003	nonzero	nonzero	0.001	0.000	0.000	0.000	0.000	0.111	fbmy8028_ef5b9b101_jun23_hack.cy9c5_u
50.176	49.822	0.002	nonzero	nonzero	0.000	0.000	0.000	0.000	0.000	0.052	fbmy8028_ef5b9b101_jun23_hack.cy9c6_u
49.627	50.371	0.002	nonzero	nonzero	0.000	0.000	0.000	0.000	0.000	0.042	fbmy8028_ef5b9b101_jun23_hack.cy9c7_u
Insert response time histogram
256us	1ms	4ms	16ms	64ms	256ms	1s	4s	16s	gt	max	tag
0.000	0.000	24.763	70.001	5.231	0.005	0.000	0.000	0.000	0.000	0.122	fbmy8028_ef5b9b101_jun23_hack.cy9c_u
0.000	0.000	23.223	69.586	7.191	0.000	0.000	0.000	0.000	0.000	0.039	fbmy8028_ef5b9b101_jun23_hack.cy9c1_u
0.000	0.000	27.737	68.731	3.521	0.008	0.003	0.000	0.000	0.000	0.314	fbmy8028_ef5b9b101_jun23_hack.cy9c2_u
0.000	0.000	27.672	72.120	0.203	0.004	0.000	0.000	0.000	0.000	0.094	fbmy8028_ef5b9b101_jun23_hack.cy9c3_u
0.000	0.000	27.796	71.972	0.230	0.002	0.000	0.000	0.000	0.000	0.085	fbmy8028_ef5b9b101_jun23_hack.cy9c4_u
0.000	0.000	24.202	63.240	12.554	0.005	0.000	0.000	0.000	0.000	0.097	fbmy8028_ef5b9b101_jun23_hack.cy9c5_u
0.000	0.000	23.679	72.099	4.221	0.000	0.000	0.000	0.000	0.000	0.037	fbmy8028_ef5b9b101_jun23_hack.cy9c6_u
0.000	0.000	24.349	68.004	7.645	0.002	0.000	0.000	0.000	0.000	0.091	fbmy8028_ef5b9b101_jun23_hack.cy9c7_u
Delete response time histogram
256us	1ms	4ms	16ms	64ms	256ms	1s	4s	16s	gt	max	tag
0.000	0.000	26.780	68.026	5.187	0.006	0.000	0.000	0.000	0.000	0.122	fbmy8028_ef5b9b101_jun23_hack.cy9c_u
0.000	0.000	24.072	68.770	7.158	nonzero	0.000	0.000	0.000	0.000	0.070	fbmy8028_ef5b9b101_jun23_hack.cy9c1_u
0.000	0.000	29.853	66.662	3.471	0.009	0.005	0.000	0.000	0.000	0.315	fbmy8028_ef5b9b101_jun23_hack.cy9c2_u
0.000	0.000	30.053	69.740	0.201	0.006	0.000	0.000	0.000	0.000	0.097	fbmy8028_ef5b9b101_jun23_hack.cy9c3_u
0.000	0.000	29.637	70.129	0.230	0.004	0.000	0.000	0.000	0.000	0.090	fbmy8028_ef5b9b101_jun23_hack.cy9c4_u
0.000	0.000	25.337	62.200	12.457	0.006	0.000	0.000	0.000	0.000	0.096	fbmy8028_ef5b9b101_jun23_hack.cy9c5_u
0.000	0.000	24.828	70.991	4.180	nonzero	0.000	0.000	0.000	0.000	0.072	fbmy8028_ef5b9b101_jun23_hack.cy9c6_u
0.000	0.000	25.732	66.678	7.589	0.002	0.000	0.000	0.000	0.000	0.091	fbmy8028_ef5b9b101_jun23_hack.cy9c7_u
q1000.1
- q1000.1: range queries with 1000 insert/s per client
- Legend for results is here.
- Each entry lists the percentage of responses that fit in that bucket (slower than max time for previous bucket, faster than min time for next bucket).
Query response time histogram
256us	1ms	4ms	16ms	64ms	256ms	1s	4s	16s	gt	max	tag
15.216	84.768	0.016	nonzero	nonzero	nonzero	0.000	0.000	0.000	0.000	0.083	fbmy8028_ef5b9b101_jun23_hack.cy9c_u
23.169	76.818	0.013	nonzero	nonzero	nonzero	0.000	0.000	0.000	0.000	0.094	fbmy8028_ef5b9b101_jun23_hack.cy9c1_u
13.835	86.146	0.018	nonzero	nonzero	nonzero	0.000	0.000	0.000	0.000	0.068	fbmy8028_ef5b9b101_jun23_hack.cy9c2_u
8.747	91.240	0.013	nonzero	nonzero	nonzero	0.000	0.000	0.000	0.000	0.155	fbmy8028_ef5b9b101_jun23_hack.cy9c3_u
17.376	82.607	0.017	nonzero	nonzero	0.000	0.000	0.000	0.000	0.000	0.050	fbmy8028_ef5b9b101_jun23_hack.cy9c4_u
21.662	78.323	0.015	nonzero	nonzero	nonzero	0.000	0.000	0.000	0.000	0.148	fbmy8028_ef5b9b101_jun23_hack.cy9c5_u
30.525	69.460	0.015	nonzero	nonzero	nonzero	0.000	0.000	0.000	0.000	0.098	fbmy8028_ef5b9b101_jun23_hack.cy9c6_u
30.903	69.084	0.013	nonzero	nonzero	0.000	0.000	0.000	0.000	0.000	0.056	fbmy8028_ef5b9b101_jun23_hack.cy9c7_u
Insert response time histogram
256us	1ms	4ms	16ms	64ms	256ms	1s	4s	16s	gt	max	tag
0.000	0.000	2.967	15.822	81.209	0.001	0.000	0.000	0.000	0.000	0.092	fbmy8028_ef5b9b101_jun23_hack.cy9c_u
0.000	0.000	2.720	16.855	80.425	0.000	0.000	0.000	0.000	0.000	0.061	fbmy8028_ef5b9b101_jun23_hack.cy9c1_u
0.000	0.000	4.254	24.760	70.985	0.001	0.000	0.000	0.000	0.000	0.131	fbmy8028_ef5b9b101_jun23_hack.cy9c2_u
0.000	0.000	9.670	46.904	42.646	0.754	0.025	0.000	0.000	0.000	0.299	fbmy8028_ef5b9b101_jun23_hack.cy9c3_u
0.000	0.000	1.391	13.833	84.753	0.023	0.000	0.000	0.000	0.000	0.117	fbmy8028_ef5b9b101_jun23_hack.cy9c4_u
0.000	0.000	2.377	15.710	81.911	0.003	0.000	0.000	0.000	0.000	0.082	fbmy8028_ef5b9b101_jun23_hack.cy9c5_u
0.000	0.000	1.465	11.964	86.567	0.004	0.000	0.000	0.000	0.000	0.105	fbmy8028_ef5b9b101_jun23_hack.cy9c6_u
0.000	0.000	2.478	14.528	82.991	0.004	0.000	0.000	0.000	0.000	0.103	fbmy8028_ef5b9b101_jun23_hack.cy9c7_u
Delete response time histogram
256us	1ms	4ms	16ms	64ms	256ms	1s	4s	16s	gt	max	tag
0.000	0.000	2.988	15.857	81.153	0.002	0.000	0.000	0.000	0.000	0.116	fbmy8028_ef5b9b101_jun23_hack.cy9c_u
0.000	0.000	2.712	16.872	80.415	nonzero	0.000	0.000	0.000	0.000	0.140	fbmy8028_ef5b9b101_jun23_hack.cy9c1_u
0.000	0.000	4.456	24.694	70.848	0.002	0.000	0.000	0.000	0.000	0.134	fbmy8028_ef5b9b101_jun23_hack.cy9c2_u
0.000	0.000	10.102	46.507	42.612	0.755	0.025	0.000	0.000	0.000	0.299	fbmy8028_ef5b9b101_jun23_hack.cy9c3_u
0.000	0.000	1.369	13.886	84.722	0.023	0.000	0.000	0.000	0.000	0.116	fbmy8028_ef5b9b101_jun23_hack.cy9c4_u
0.000	0.000	2.412	15.728	81.856	0.003	0.000	0.000	0.000	0.000	0.088	fbmy8028_ef5b9b101_jun23_hack.cy9c5_u
0.000	0.000	1.425	12.040	86.531	0.005	0.000	0.000	0.000	0.000	0.105	fbmy8028_ef5b9b101_jun23_hack.cy9c6_u
0.000	0.000	2.496	14.562	82.938	0.004	0.000	0.000	0.000	0.000	0.103	fbmy8028_ef5b9b101_jun23_hack.cy9c7_u