Introduction
This is a report for the insert benchmark with 800M docs and 1 client(s). It is generated by scripts (bash, awk, sed) and Tufte might not be impressed. An overview of the insert benchmark is here and a short update is here. Below, by DBMS, I mean DBMS+version.config. An example is my8020.c10b40 where my means MySQL, 8020 is version 8.0.20 and c10b40 is the name for the configuration file.
The test server has 8 AMD cores, 16G RAM and an NVMe SSD. It is described here as the Beelink. The benchmark was run with 1 client and there were 1 or 3 connections per client (1 for queries or inserts without rate limits, 1+1 for rate limited inserts+deletes). It uses 1 table. It loads 800M rows per table without secondary indexes, creates secondary indexes, then inserts 100M rows per table with a delete per insert to avoid growing the table. It then does 3 read+write tests for 3600s each that do queries as fast as possible with 100, 500 and then 1000 inserts/second/client concurrent with the queries and 1000 deletes/second to avoid growing the table. The database is larger than memory. Clients and the DBMS share one server. The per-database configs are in the per-database subdirectories here.
The tested DBMS are:
- fbmy8028_rel_native_lto_jun23_ef5b9b101_hack.cy10a0_bee - MyRocks 8.0.28 at git hash ef5b9b101 from June 2023, rel_native_lto build, cy10a0_bee config
- fbmy8028_rel_native_lto_jun23_ef5b9b101_hack.cy10a1_bee - MyRocks 8.0.28 at git hash ef5b9b101 from June 2023, rel_native_lto build, cy10a1_bee config, adds rocksdb_use_hyper_clock_cache=ON
- fbmy8028_rel_native_lto_jun23_ef5b9b101_hack.cy10a2_bee - MyRocks 8.0.28 at git hash ef5b9b101 from June 2023, rel_native_lto build, cy10a2_bee config, adds rocksdb_block_cache_numshardbits=3
- fbmy8028_rel_native_lto_jun23_ef5b9b101_hack.cy10a3_bee - MyRocks 8.0.28 at git hash ef5b9b101 from June 2023, rel_native_lto build, cy10a3_bee config, disables intra-L0 compaction via hack
- fbmy8028_rel_native_lto_jun23_ef5b9b101_hack.cy10a4_bee - MyRocks 8.0.28 at git hash ef5b9b101 from June 2023, rel_native_lto build, cy10a4_bee config, reduces level0_slowdown_writes_trigger from 20 to 8 and level0_stop_writes_trigger from 36 to 12
- fbmy8028_rel_native_lto_jun23_ef5b9b101_hack.cy10a5_bee - MyRocks 8.0.28 at git hash ef5b9b101 from June 2023, rel_native_lto build, cy10a5_bee config, adds rocksdb_max_subcompactions=5
- fbmy8028_rel_native_lto_jun23_ef5b9b101_hack.cy10a6_bee - MyRocks 8.0.28 at git hash ef5b9b101 from June 2023, rel_native_lto build, cy10a6_bee config, combines a1, a2, a5
- fbmy8028_rel_native_lto_jun23_ef5b9b101_hack.cy10a7_bee - MyRocks 8.0.28 at git hash ef5b9b101 from June 2023, rel_native_lto build, cy10a7_bee config, combines a1, a5
Contents
- Summary
- l.i0: load without secondary indexes
- l.x: create secondary indexes
- l.i1: continue load after secondary indexes created
- q100.1: range queries with 100 insert/s per client
- q500.1: range queries with 500 insert/s per client
- q1000.1: range queries with 1000 insert/s per client
Summary
The numbers are inserts/s for l.i0 and l.i1, indexed docs (or rows) /s for l.x and queries/s for q*.2. The values are the average rate over the entire test for inserts (IPS) and queries (QPS). The range of values for IPS and QPS is split into 3 parts: bottom 25%, middle 50%, top 25%. Values in the bottom 25% have a red background, values in the top 25% have a green background and values in the middle have no color. A gray background is used for values that can be ignored because the DBMS did not sustain the target insert rate. Red backgrounds are not used when the minimum value is within 80% of the max value.
| dbms | l.i0 | l.x | l.i1 | q100.1 | q500.1 | q1000.1 |
|---|---|---|---|---|---|---|
| fbmy8028_rel_native_lto_jun23_ef5b9b101_hack.cy10a0_bee | 60855 | 73633 | 23240 | 1900 | 1904 | 1969 |
| fbmy8028_rel_native_lto_jun23_ef5b9b101_hack.cy10a1_bee | 60740 | 73377 | 23073 | 1975 | 1881 | 1993 |
| fbmy8028_rel_native_lto_jun23_ef5b9b101_hack.cy10a2_bee | 61505 | 73216 | 23196 | 1911 | 1944 | 1971 |
| fbmy8028_rel_native_lto_jun23_ef5b9b101_hack.cy10a3_bee | 60767 | 73410 | 19106 | 1958 | 1930 | 1973 |
| fbmy8028_rel_native_lto_jun23_ef5b9b101_hack.cy10a4_bee | 61022 | 73525 | 22022 | 1907 | 1915 | 1936 |
| fbmy8028_rel_native_lto_jun23_ef5b9b101_hack.cy10a5_bee | 60990 | 73525 | 23234 | 1992 | 1937 | 2015 |
| fbmy8028_rel_native_lto_jun23_ef5b9b101_hack.cy10a6_bee | 60883 | 73701 | 23111 | 1988 | 1898 | 1914 |
| fbmy8028_rel_native_lto_jun23_ef5b9b101_hack.cy10a7_bee | 60556 | 73336 | 23375 | 1883 | 1930 | 2044 |
This table has relative throughput, throughput for the DBMS relative to the DBMS in the first line, using the absolute throughput from the previous table. Values less than 0.95 have a yellow background. Values greater than 1.05 have a blue background.
| dbms | l.i0 | l.x | l.i1 | q100.1 | q500.1 | q1000.1 |
|---|---|---|---|---|---|---|
| fbmy8028_rel_native_lto_jun23_ef5b9b101_hack.cy10a0_bee | 1.00 | 1.00 | 1.00 | 1.00 | 1.00 | 1.00 |
| fbmy8028_rel_native_lto_jun23_ef5b9b101_hack.cy10a1_bee | 1.00 | 1.00 | 0.99 | 1.04 | 0.99 | 1.01 |
| fbmy8028_rel_native_lto_jun23_ef5b9b101_hack.cy10a2_bee | 1.01 | 0.99 | 1.00 | 1.01 | 1.02 | 1.00 |
| fbmy8028_rel_native_lto_jun23_ef5b9b101_hack.cy10a3_bee | 1.00 | 1.00 | 0.82 | 1.03 | 1.01 | 1.00 |
| fbmy8028_rel_native_lto_jun23_ef5b9b101_hack.cy10a4_bee | 1.00 | 1.00 | 0.95 | 1.00 | 1.01 | 0.98 |
| fbmy8028_rel_native_lto_jun23_ef5b9b101_hack.cy10a5_bee | 1.00 | 1.00 | 1.00 | 1.05 | 1.02 | 1.02 |
| fbmy8028_rel_native_lto_jun23_ef5b9b101_hack.cy10a6_bee | 1.00 | 1.00 | 0.99 | 1.05 | 1.00 | 0.97 |
| fbmy8028_rel_native_lto_jun23_ef5b9b101_hack.cy10a7_bee | 1.00 | 1.00 | 1.01 | 0.99 | 1.01 | 1.04 |
This lists the average rate of inserts/s for the tests that do inserts concurrent with queries. For such tests the query rate is listed in the table above. The read+write tests are setup so that the insert rate should match the target rate every second. Cells that are not at least 95% of the target have a red background to indicate a failure to satisfy the target.
| dbms | q100.1 | q500.1 | q1000.1 |
|---|---|---|---|
| fbmy8028_rel_native_lto_jun23_ef5b9b101_hack.cy10a0_bee | 100 | 499 | 999 |
| fbmy8028_rel_native_lto_jun23_ef5b9b101_hack.cy10a1_bee | 100 | 499 | 999 |
| fbmy8028_rel_native_lto_jun23_ef5b9b101_hack.cy10a2_bee | 100 | 499 | 998 |
| fbmy8028_rel_native_lto_jun23_ef5b9b101_hack.cy10a3_bee | 100 | 499 | 999 |
| fbmy8028_rel_native_lto_jun23_ef5b9b101_hack.cy10a4_bee | 100 | 499 | 999 |
| fbmy8028_rel_native_lto_jun23_ef5b9b101_hack.cy10a5_bee | 100 | 499 | 999 |
| fbmy8028_rel_native_lto_jun23_ef5b9b101_hack.cy10a6_bee | 100 | 499 | 998 |
| fbmy8028_rel_native_lto_jun23_ef5b9b101_hack.cy10a7_bee | 100 | 499 | 998 |
| target | 100 | 500 | 1000 |
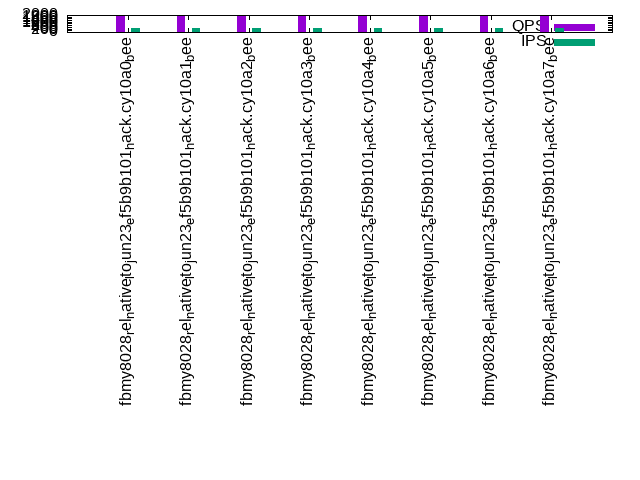
l.i0
l.i0: load without secondary indexes. Graphs for performance per 1-second interval are here.
Average throughput:
Insert response time histogram: each cell has the percentage of responses that take <= the time in the header and max is the max response time in seconds. For the max column values in the top 25% of the range have a red background and in the bottom 25% of the range have a green background. The red background is not used when the min value is within 80% of the max value.
| dbms | 256us | 1ms | 4ms | 16ms | 64ms | 256ms | 1s | 4s | 16s | gt | max |
|---|---|---|---|---|---|---|---|---|---|---|---|
| fbmy8028_rel_native_lto_jun23_ef5b9b101_hack.cy10a0_bee | 99.733 | 0.191 | 0.073 | 0.003 | 0.102 | ||||||
| fbmy8028_rel_native_lto_jun23_ef5b9b101_hack.cy10a1_bee | 99.733 | 0.191 | 0.073 | 0.003 | 0.112 | ||||||
| fbmy8028_rel_native_lto_jun23_ef5b9b101_hack.cy10a2_bee | 99.735 | 0.190 | 0.072 | 0.003 | 0.116 | ||||||
| fbmy8028_rel_native_lto_jun23_ef5b9b101_hack.cy10a3_bee | 99.733 | 0.192 | 0.072 | 0.003 | 0.117 | ||||||
| fbmy8028_rel_native_lto_jun23_ef5b9b101_hack.cy10a4_bee | 99.734 | 0.191 | 0.072 | 0.003 | 0.149 | ||||||
| fbmy8028_rel_native_lto_jun23_ef5b9b101_hack.cy10a5_bee | 99.733 | 0.191 | 0.072 | 0.003 | 0.111 | ||||||
| fbmy8028_rel_native_lto_jun23_ef5b9b101_hack.cy10a6_bee | 99.733 | 0.191 | 0.073 | 0.003 | 0.102 | ||||||
| fbmy8028_rel_native_lto_jun23_ef5b9b101_hack.cy10a7_bee | 99.732 | 0.192 | 0.073 | 0.003 | 0.117 |
Performance metrics for the DBMS listed above. Some are normalized by throughput, others are not. Legend for results is here.
ips	qps	rps	rmbps	wps	wmbps	rpq	rkbpq	wpi	wkbpi	csps	cpups	cspq	cpupq	dbgb1	dbgb2	rss	maxop	p50	p99	tag
60855	0	0	0.0	47.4	14.0	0.000	0.000	0.001	0.236	6406	22.8	0.105	30	25.1	25.9	2.0	0.102	60931	55037	800m.fbmy8028_rel_native_lto_jun23_ef5b9b101_hack.cy10a0_bee
60740	0	0	0.0	47.4	14.0	0.000	0.000	0.001	0.236	6392	23.0	0.105	30	25.1	25.9	2.1	0.112	60831	54973	800m.fbmy8028_rel_native_lto_jun23_ef5b9b101_hack.cy10a1_bee
61505	0	0	0.0	48.0	14.2	0.000	0.000	0.001	0.236	6476	22.7	0.105	30	25.1	25.9	2.0	0.116	61628	55537	800m.fbmy8028_rel_native_lto_jun23_ef5b9b101_hack.cy10a2_bee
60767	0	0	0.0	47.5	14.0	0.000	0.000	0.001	0.236	6394	22.8	0.105	30	25.1	25.9	2.0	0.117	60832	54738	800m.fbmy8028_rel_native_lto_jun23_ef5b9b101_hack.cy10a3_bee
61022	0	0	0.0	47.6	14.1	0.000	0.000	0.001	0.236	6421	22.6	0.105	30	25.1	25.9	2.0	0.149	61131	54748	800m.fbmy8028_rel_native_lto_jun23_ef5b9b101_hack.cy10a4_bee
60990	0	0	0.0	47.6	14.1	0.000	0.000	0.001	0.236	6420	22.7	0.105	30	25.1	25.9	2.0	0.111	61130	54837	800m.fbmy8028_rel_native_lto_jun23_ef5b9b101_hack.cy10a5_bee
60883	0	0	0.0	47.5	14.0	0.000	0.000	0.001	0.236	6404	22.9	0.105	30	25.1	25.9	2.1	0.102	60933	54837	800m.fbmy8028_rel_native_lto_jun23_ef5b9b101_hack.cy10a6_bee
60556	0	0	0.0	47.2	14.0	0.000	0.000	0.001	0.236	6376	22.7	0.105	30	25.1	25.9	2.1	0.117	60633	54437	800m.fbmy8028_rel_native_lto_jun23_ef5b9b101_hack.cy10a7_bee
l.x
l.x: create secondary indexes.
Average throughput:
Performance metrics for the DBMS listed above. Some are normalized by throughput, others are not. Legend for results is here.
ips	qps	rps	rmbps	wps	wmbps	rpq	rkbpq	wpi	wkbpi	csps	cpups	cspq	cpupq	dbgb1	dbgb2	rss	maxop	p50	p99	tag
73633	0	98	15.4	29.8	10.8	0.001	0.214	0.000	0.150	448	11.7	0.006	13	51.0	51.8	10.4	0.009	NA	NA	800m.fbmy8028_rel_native_lto_jun23_ef5b9b101_hack.cy10a0_bee
73377	0	98	15.4	28.9	10.7	0.001	0.214	0.000	0.150	442	11.7	0.006	13	51.0	51.8	9.5	0.009	NA	NA	800m.fbmy8028_rel_native_lto_jun23_ef5b9b101_hack.cy10a1_bee
73216	0	97	15.3	29.7	10.7	0.001	0.214	0.000	0.150	458	11.7	0.006	13	51.0	51.8	10.4	0.009	NA	NA	800m.fbmy8028_rel_native_lto_jun23_ef5b9b101_hack.cy10a2_bee
73410	0	98	15.4	30.2	10.7	0.001	0.214	0.000	0.149	450	11.7	0.006	13	51.0	51.8	10.4	0.009	NA	NA	800m.fbmy8028_rel_native_lto_jun23_ef5b9b101_hack.cy10a3_bee
73525	0	98	15.4	30.1	10.7	0.001	0.214	0.000	0.150	448	11.7	0.006	13	51.0	51.8	10.4	0.009	NA	NA	800m.fbmy8028_rel_native_lto_jun23_ef5b9b101_hack.cy10a4_bee
73525	0	98	15.4	30.3	10.7	0.001	0.214	0.000	0.150	448	11.7	0.006	13	51.0	51.8	10.4	0.009	NA	NA	800m.fbmy8028_rel_native_lto_jun23_ef5b9b101_hack.cy10a5_bee
73701	0	98	15.4	29.4	10.8	0.001	0.214	0.000	0.150	448	11.7	0.006	13	51.0	51.8	9.4	0.009	NA	NA	800m.fbmy8028_rel_native_lto_jun23_ef5b9b101_hack.cy10a6_bee
73336	0	98	15.3	29.6	10.7	0.001	0.214	0.000	0.149	441	11.7	0.006	13	50.9	51.8	9.5	0.009	NA	NA	800m.fbmy8028_rel_native_lto_jun23_ef5b9b101_hack.cy10a7_bee
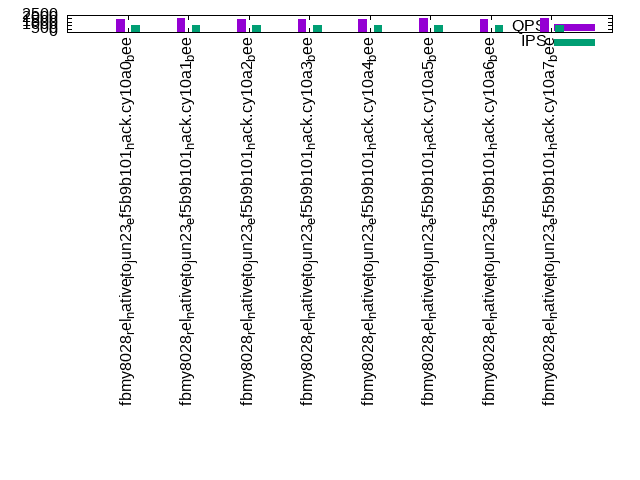
l.i1
l.i1: continue load after secondary indexes created. Graphs for performance per 1-second interval are here.
Average throughput:
Insert response time histogram: each cell has the percentage of responses that take <= the time in the header and max is the max response time in seconds. For the max column values in the top 25% of the range have a red background and in the bottom 25% of the range have a green background. The red background is not used when the min value is within 80% of the max value.
| dbms | 256us | 1ms | 4ms | 16ms | 64ms | 256ms | 1s | 4s | 16s | gt | max |
|---|---|---|---|---|---|---|---|---|---|---|---|
| fbmy8028_rel_native_lto_jun23_ef5b9b101_hack.cy10a0_bee | 99.650 | 0.343 | 0.004 | 0.003 | 0.107 | ||||||
| fbmy8028_rel_native_lto_jun23_ef5b9b101_hack.cy10a1_bee | 99.658 | 0.336 | 0.004 | 0.003 | 0.140 | ||||||
| fbmy8028_rel_native_lto_jun23_ef5b9b101_hack.cy10a2_bee | 99.649 | 0.343 | 0.004 | 0.003 | 0.126 | ||||||
| fbmy8028_rel_native_lto_jun23_ef5b9b101_hack.cy10a3_bee | 94.089 | 5.826 | 0.083 | 0.003 | 0.151 | ||||||
| fbmy8028_rel_native_lto_jun23_ef5b9b101_hack.cy10a4_bee | 97.049 | 2.942 | 0.007 | 0.003 | 0.171 | ||||||
| fbmy8028_rel_native_lto_jun23_ef5b9b101_hack.cy10a5_bee | 99.654 | 0.337 | 0.006 | 0.003 | 0.150 | ||||||
| fbmy8028_rel_native_lto_jun23_ef5b9b101_hack.cy10a6_bee | 99.660 | 0.333 | 0.004 | 0.003 | 0.131 | ||||||
| fbmy8028_rel_native_lto_jun23_ef5b9b101_hack.cy10a7_bee | 99.662 | 0.330 | 0.006 | 0.003 | 0.155 |
Delete response time histogram: each cell has the percentage of responses that take <= the time in the header and max is the max response time in seconds. For the max column values in the top 25% of the range have a red background and in the bottom 25% of the range have a green background. The red background is not used when the min value is within 80% of the max value.
| dbms | 256us | 1ms | 4ms | 16ms | 64ms | 256ms | 1s | 4s | 16s | gt | max |
|---|---|---|---|---|---|---|---|---|---|---|---|
| fbmy8028_rel_native_lto_jun23_ef5b9b101_hack.cy10a0_bee | 99.634 | 0.356 | 0.008 | 0.002 | 0.107 | ||||||
| fbmy8028_rel_native_lto_jun23_ef5b9b101_hack.cy10a1_bee | 99.614 | 0.375 | 0.008 | 0.003 | 0.149 | ||||||
| fbmy8028_rel_native_lto_jun23_ef5b9b101_hack.cy10a2_bee | 99.606 | 0.382 | 0.009 | 0.003 | 0.145 | ||||||
| fbmy8028_rel_native_lto_jun23_ef5b9b101_hack.cy10a3_bee | 93.980 | 5.933 | 0.084 | 0.003 | 0.169 | ||||||
| fbmy8028_rel_native_lto_jun23_ef5b9b101_hack.cy10a4_bee | 96.427 | 3.559 | 0.011 | 0.003 | 0.150 | ||||||
| fbmy8028_rel_native_lto_jun23_ef5b9b101_hack.cy10a5_bee | 99.598 | 0.387 | 0.012 | 0.003 | 0.169 | ||||||
| fbmy8028_rel_native_lto_jun23_ef5b9b101_hack.cy10a6_bee | 99.601 | 0.387 | 0.009 | 0.003 | 0.126 | ||||||
| fbmy8028_rel_native_lto_jun23_ef5b9b101_hack.cy10a7_bee | 99.608 | 0.379 | 0.010 | 0.003 | 0.173 |
Performance metrics for the DBMS listed above. Some are normalized by throughput, others are not. Legend for results is here.
ips	qps	rps	rmbps	wps	wmbps	rpq	rkbpq	wpi	wkbpi	csps	cpups	cspq	cpupq	dbgb1	dbgb2	rss	maxop	p50	p99	tag
23240	0	344	24.5	151.5	55.1	0.015	1.081	0.007	2.429	10643	51.5	0.458	177	57.0	57.2	8.6	0.107	23224	20178	800m.fbmy8028_rel_native_lto_jun23_ef5b9b101_hack.cy10a0_bee
23073	0	265	15.0	148.0	55.3	0.011	0.665	0.006	2.453	10536	51.6	0.457	179	57.4	57.6	6.6	0.140	22974	19937	800m.fbmy8028_rel_native_lto_jun23_ef5b9b101_hack.cy10a1_bee
23196	0	346	25.0	150.3	55.4	0.015	1.103	0.006	2.445	10679	51.7	0.460	178	57.0	57.2	8.7	0.126	23174	20078	800m.fbmy8028_rel_native_lto_jun23_ef5b9b101_hack.cy10a2_bee
19106	0	348	28.1	140.0	51.4	0.018	1.505	0.007	2.755	9394	47.1	0.492	197	59.9	60.1	8.6	0.151	21326	3447	800m.fbmy8028_rel_native_lto_jun23_ef5b9b101_hack.cy10a3_bee
22022	0	302	20.4	152.0	55.5	0.014	0.951	0.007	2.582	10292	51.0	0.467	185	57.0	57.2	8.7	0.171	23124	6992	800m.fbmy8028_rel_native_lto_jun23_ef5b9b101_hack.cy10a4_bee
23234	0	343	24.5	150.8	55.4	0.015	1.080	0.006	2.440	10706	51.6	0.461	178	56.5	56.7	8.6	0.150	23223	20132	800m.fbmy8028_rel_native_lto_jun23_ef5b9b101_hack.cy10a5_bee
23111	0	270	15.7	146.8	54.6	0.012	0.696	0.006	2.421	10571	51.3	0.457	178	57.5	57.7	6.8	0.131	22975	19678	800m.fbmy8028_rel_native_lto_jun23_ef5b9b101_hack.cy10a6_bee
23375	0	272	15.5	148.5	55.4	0.012	0.678	0.006	2.426	10686	51.7	0.457	177	57.8	58.0	6.6	0.155	23373	20127	800m.fbmy8028_rel_native_lto_jun23_ef5b9b101_hack.cy10a7_bee
q100.1
q100.1: range queries with 100 insert/s per client. Graphs for performance per 1-second interval are here.
Average throughput:
Query response time histogram: each cell has the percentage of responses that take <= the time in the header and max is the max response time in seconds. For max values in the top 25% of the range have a red background and in the bottom 25% of the range have a green background. The red background is not used when the min value is within 80% of the max value.
| dbms | 256us | 1ms | 4ms | 16ms | 64ms | 256ms | 1s | 4s | 16s | gt | max |
|---|---|---|---|---|---|---|---|---|---|---|---|
| fbmy8028_rel_native_lto_jun23_ef5b9b101_hack.cy10a0_bee | 0.382 | 94.216 | 5.394 | 0.009 | nonzero | 0.047 | |||||
| fbmy8028_rel_native_lto_jun23_ef5b9b101_hack.cy10a1_bee | 1.720 | 93.467 | 4.792 | 0.021 | nonzero | 0.040 | |||||
| fbmy8028_rel_native_lto_jun23_ef5b9b101_hack.cy10a2_bee | 1.438 | 93.123 | 5.425 | 0.013 | nonzero | 0.040 | |||||
| fbmy8028_rel_native_lto_jun23_ef5b9b101_hack.cy10a3_bee | 1.136 | 94.149 | 4.700 | 0.014 | 0.001 | 0.062 | |||||
| fbmy8028_rel_native_lto_jun23_ef5b9b101_hack.cy10a4_bee | 0.659 | 94.999 | 4.329 | 0.013 | nonzero | 0.045 | |||||
| fbmy8028_rel_native_lto_jun23_ef5b9b101_hack.cy10a5_bee | 1.204 | 94.533 | 4.258 | 0.005 | nonzero | 0.037 | |||||
| fbmy8028_rel_native_lto_jun23_ef5b9b101_hack.cy10a6_bee | 1.352 | 94.714 | 3.910 | 0.024 | nonzero | 0.046 | |||||
| fbmy8028_rel_native_lto_jun23_ef5b9b101_hack.cy10a7_bee | 1.572 | 91.810 | 6.590 | 0.027 | nonzero | 0.039 |
Insert response time histogram: each cell has the percentage of responses that take <= the time in the header and max is the max response time in seconds. For max values in the top 25% of the range have a red background and in the bottom 25% of the range have a green background. The red background is not used when the min value is within 80% of the max value.
| dbms | 256us | 1ms | 4ms | 16ms | 64ms | 256ms | 1s | 4s | 16s | gt | max |
|---|---|---|---|---|---|---|---|---|---|---|---|
| fbmy8028_rel_native_lto_jun23_ef5b9b101_hack.cy10a0_bee | 99.333 | 0.625 | 0.042 | 0.017 | |||||||
| fbmy8028_rel_native_lto_jun23_ef5b9b101_hack.cy10a1_bee | 99.375 | 0.583 | 0.042 | 0.019 | |||||||
| fbmy8028_rel_native_lto_jun23_ef5b9b101_hack.cy10a2_bee | 99.542 | 0.444 | 0.014 | 0.018 | |||||||
| fbmy8028_rel_native_lto_jun23_ef5b9b101_hack.cy10a3_bee | 99.569 | 0.431 | 0.015 | ||||||||
| fbmy8028_rel_native_lto_jun23_ef5b9b101_hack.cy10a4_bee | 99.319 | 0.611 | 0.069 | 0.019 | |||||||
| fbmy8028_rel_native_lto_jun23_ef5b9b101_hack.cy10a5_bee | 99.444 | 0.556 | 0.014 | ||||||||
| fbmy8028_rel_native_lto_jun23_ef5b9b101_hack.cy10a6_bee | 99.417 | 0.542 | 0.042 | 0.022 | |||||||
| fbmy8028_rel_native_lto_jun23_ef5b9b101_hack.cy10a7_bee | 99.250 | 0.722 | 0.028 | 0.018 |
Delete response time histogram: each cell has the percentage of responses that take <= the time in the header and max is the max response time in seconds. For max values in the top 25% of the range have a red background and in the bottom 25% of the range have a green background. The red background is not used when the min value is within 80% of the max value.
| dbms | 256us | 1ms | 4ms | 16ms | 64ms | 256ms | 1s | 4s | 16s | gt | max |
|---|---|---|---|---|---|---|---|---|---|---|---|
| fbmy8028_rel_native_lto_jun23_ef5b9b101_hack.cy10a0_bee | 99.139 | 0.833 | 0.028 | 0.052 | |||||||
| fbmy8028_rel_native_lto_jun23_ef5b9b101_hack.cy10a1_bee | 82.667 | 17.069 | 0.264 | 0.022 | |||||||
| fbmy8028_rel_native_lto_jun23_ef5b9b101_hack.cy10a2_bee | 84.097 | 15.611 | 0.292 | 0.027 | |||||||
| fbmy8028_rel_native_lto_jun23_ef5b9b101_hack.cy10a3_bee | 86.972 | 12.875 | 0.153 | 0.020 | |||||||
| fbmy8028_rel_native_lto_jun23_ef5b9b101_hack.cy10a4_bee | 84.236 | 15.542 | 0.222 | 0.022 | |||||||
| fbmy8028_rel_native_lto_jun23_ef5b9b101_hack.cy10a5_bee | 96.833 | 3.111 | 0.056 | 0.020 | |||||||
| fbmy8028_rel_native_lto_jun23_ef5b9b101_hack.cy10a6_bee | 81.903 | 17.681 | 0.417 | 0.027 | |||||||
| fbmy8028_rel_native_lto_jun23_ef5b9b101_hack.cy10a7_bee | 92.972 | 6.931 | 0.097 | 0.023 |
Performance metrics for the DBMS listed above. Some are normalized by throughput, others are not. Legend for results is here.
ips	qps	rps	rmbps	wps	wmbps	rpq	rkbpq	wpi	wkbpi	csps	cpups	cspq	cpupq	dbgb1	dbgb2	rss	maxop	p50	p99	tag
100	1900	266	4.2	8.2	1.9	0.140	2.254	0.082	18.998	7995	13.4	4.207	564	55.8	56.1	9.6	0.047	1918	1247	800m.fbmy8028_rel_native_lto_jun23_ef5b9b101_hack.cy10a0_bee
100	1975	203	2.9	8.5	2.0	0.103	1.527	0.085	20.216	8226	13.5	4.164	547	55.6	55.9	7.5	0.040	1982	1326	800m.fbmy8028_rel_native_lto_jun23_ef5b9b101_hack.cy10a1_bee
100	1911	266	3.9	8.2	1.9	0.139	2.093	0.082	19.016	8063	13.4	4.220	561	55.6	55.9	9.5	0.040	1886	1215	800m.fbmy8028_rel_native_lto_jun23_ef5b9b101_hack.cy10a2_bee
100	1958	268	4.5	9.6	2.4	0.137	2.341	0.096	24.591	8253	13.7	4.216	560	55.6	55.9	9.3	0.062	1966	1103	800m.fbmy8028_rel_native_lto_jun23_ef5b9b101_hack.cy10a3_bee
100	1907	219	2.9	6.0	1.0	0.115	1.558	0.060	10.708	7951	13.0	4.170	545	55.6	55.9	9.9	0.045	1869	1263	800m.fbmy8028_rel_native_lto_jun23_ef5b9b101_hack.cy10a4_bee
100	1992	296	4.5	8.8	2.0	0.149	2.339	0.088	20.856	8363	13.6	4.199	546	55.7	56.0	9.7	0.037	2014	1263	800m.fbmy8028_rel_native_lto_jun23_ef5b9b101_hack.cy10a5_bee
100	1988	200	2.9	8.1	1.9	0.101	1.500	0.081	19.254	8278	13.5	4.165	543	55.7	56.0	7.1	0.046	1998	1263	800m.fbmy8028_rel_native_lto_jun23_ef5b9b101_hack.cy10a6_bee
100	1883	249	3.8	8.7	2.0	0.132	2.050	0.087	20.848	7930	13.5	4.211	573	55.6	55.9	7.7	0.039	1853	1279	800m.fbmy8028_rel_native_lto_jun23_ef5b9b101_hack.cy10a7_bee
q500.1
q500.1: range queries with 500 insert/s per client. Graphs for performance per 1-second interval are here.
Average throughput:
Query response time histogram: each cell has the percentage of responses that take <= the time in the header and max is the max response time in seconds. For max values in the top 25% of the range have a red background and in the bottom 25% of the range have a green background. The red background is not used when the min value is within 80% of the max value.
| dbms | 256us | 1ms | 4ms | 16ms | 64ms | 256ms | 1s | 4s | 16s | gt | max |
|---|---|---|---|---|---|---|---|---|---|---|---|
| fbmy8028_rel_native_lto_jun23_ef5b9b101_hack.cy10a0_bee | 0.365 | 94.265 | 5.352 | 0.018 | nonzero | 0.026 | |||||
| fbmy8028_rel_native_lto_jun23_ef5b9b101_hack.cy10a1_bee | 0.544 | 93.116 | 6.292 | 0.047 | nonzero | 0.037 | |||||
| fbmy8028_rel_native_lto_jun23_ef5b9b101_hack.cy10a2_bee | 0.834 | 94.464 | 4.677 | 0.025 | nonzero | 0.052 | |||||
| fbmy8028_rel_native_lto_jun23_ef5b9b101_hack.cy10a3_bee | 0.410 | 94.813 | 4.755 | 0.023 | nonzero | 0.017 | |||||
| fbmy8028_rel_native_lto_jun23_ef5b9b101_hack.cy10a4_bee | 0.193 | 95.883 | 3.905 | 0.019 | nonzero | 0.026 | |||||
| fbmy8028_rel_native_lto_jun23_ef5b9b101_hack.cy10a5_bee | 0.481 | 94.555 | 4.949 | 0.014 | nonzero | 0.019 | |||||
| fbmy8028_rel_native_lto_jun23_ef5b9b101_hack.cy10a6_bee | 0.734 | 93.989 | 5.248 | 0.028 | 0.011 | ||||||
| fbmy8028_rel_native_lto_jun23_ef5b9b101_hack.cy10a7_bee | 1.455 | 93.089 | 5.414 | 0.042 | nonzero | 0.018 |
Insert response time histogram: each cell has the percentage of responses that take <= the time in the header and max is the max response time in seconds. For max values in the top 25% of the range have a red background and in the bottom 25% of the range have a green background. The red background is not used when the min value is within 80% of the max value.
| dbms | 256us | 1ms | 4ms | 16ms | 64ms | 256ms | 1s | 4s | 16s | gt | max |
|---|---|---|---|---|---|---|---|---|---|---|---|
| fbmy8028_rel_native_lto_jun23_ef5b9b101_hack.cy10a0_bee | 99.567 | 0.425 | 0.006 | 0.003 | 0.066 | ||||||
| fbmy8028_rel_native_lto_jun23_ef5b9b101_hack.cy10a1_bee | 99.528 | 0.456 | 0.017 | 0.040 | |||||||
| fbmy8028_rel_native_lto_jun23_ef5b9b101_hack.cy10a2_bee | 99.575 | 0.408 | 0.017 | 0.062 | |||||||
| fbmy8028_rel_native_lto_jun23_ef5b9b101_hack.cy10a3_bee | 99.589 | 0.397 | 0.011 | 0.003 | 0.087 | ||||||
| fbmy8028_rel_native_lto_jun23_ef5b9b101_hack.cy10a4_bee | 99.531 | 0.464 | 0.006 | 0.041 | |||||||
| fbmy8028_rel_native_lto_jun23_ef5b9b101_hack.cy10a5_bee | 99.589 | 0.394 | 0.017 | 0.050 | |||||||
| fbmy8028_rel_native_lto_jun23_ef5b9b101_hack.cy10a6_bee | 99.519 | 0.461 | 0.019 | 0.039 | |||||||
| fbmy8028_rel_native_lto_jun23_ef5b9b101_hack.cy10a7_bee | 99.533 | 0.458 | 0.008 | 0.041 |
Delete response time histogram: each cell has the percentage of responses that take <= the time in the header and max is the max response time in seconds. For max values in the top 25% of the range have a red background and in the bottom 25% of the range have a green background. The red background is not used when the min value is within 80% of the max value.
| dbms | 256us | 1ms | 4ms | 16ms | 64ms | 256ms | 1s | 4s | 16s | gt | max |
|---|---|---|---|---|---|---|---|---|---|---|---|
| fbmy8028_rel_native_lto_jun23_ef5b9b101_hack.cy10a0_bee | 98.147 | 1.828 | 0.022 | 0.003 | 0.080 | ||||||
| fbmy8028_rel_native_lto_jun23_ef5b9b101_hack.cy10a1_bee | 95.656 | 4.278 | 0.067 | 0.054 | |||||||
| fbmy8028_rel_native_lto_jun23_ef5b9b101_hack.cy10a2_bee | 95.950 | 3.953 | 0.097 | 0.047 | |||||||
| fbmy8028_rel_native_lto_jun23_ef5b9b101_hack.cy10a3_bee | 95.922 | 4.014 | 0.061 | 0.003 | 0.072 | ||||||
| fbmy8028_rel_native_lto_jun23_ef5b9b101_hack.cy10a4_bee | 96.342 | 3.614 | 0.044 | 0.057 | |||||||
| fbmy8028_rel_native_lto_jun23_ef5b9b101_hack.cy10a5_bee | 97.681 | 2.283 | 0.036 | 0.063 | |||||||
| fbmy8028_rel_native_lto_jun23_ef5b9b101_hack.cy10a6_bee | 95.981 | 3.936 | 0.083 | 0.053 | |||||||
| fbmy8028_rel_native_lto_jun23_ef5b9b101_hack.cy10a7_bee | 98.461 | 1.506 | 0.033 | 0.056 |
Performance metrics for the DBMS listed above. Some are normalized by throughput, others are not. Legend for results is here.
ips	qps	rps	rmbps	wps	wmbps	rpq	rkbpq	wpi	wkbpi	csps	cpups	cspq	cpupq	dbgb1	dbgb2	rss	maxop	p50	p99	tag
499	1904	45	1.2	7.3	1.6	0.024	0.646	0.015	3.193	7720	13.9	4.055	584	55.7	56.4	9.1	0.026	1886	1582	800m.fbmy8028_rel_native_lto_jun23_ef5b9b101_hack.cy10a0_bee
499	1881	14	0.3	6.0	1.0	0.007	0.182	0.012	2.131	7626	13.6	4.054	578	55.7	56.4	7.1	0.037	1790	1646	800m.fbmy8028_rel_native_lto_jun23_ef5b9b101_hack.cy10a1_bee
499	1944	32	0.7	7.0	1.4	0.017	0.368	0.014	2.912	7877	13.8	4.052	568	55.7	56.4	9.0	0.052	1901	1646	800m.fbmy8028_rel_native_lto_jun23_ef5b9b101_hack.cy10a2_bee
499	1930	27	0.5	5.7	1.0	0.014	0.282	0.011	1.967	7807	13.6	4.046	564	55.8	56.4	9.2	0.017	1886	1630	800m.fbmy8028_rel_native_lto_jun23_ef5b9b101_hack.cy10a3_bee
499	1915	32	0.8	7.0	1.5	0.017	0.454	0.014	3.055	7762	13.9	4.052	581	55.7	56.3	9.1	0.026	1854	1630	800m.fbmy8028_rel_native_lto_jun23_ef5b9b101_hack.cy10a4_bee
499	1937	41	0.8	6.4	1.2	0.021	0.428	0.013	2.553	7841	13.7	4.047	566	55.7	56.4	9.2	0.019	1902	1614	800m.fbmy8028_rel_native_lto_jun23_ef5b9b101_hack.cy10a5_bee
499	1898	25	0.7	7.6	1.6	0.013	0.367	0.015	3.370	7697	14.0	4.057	590	55.6	56.3	7.0	0.011	1822	1694	800m.fbmy8028_rel_native_lto_jun23_ef5b9b101_hack.cy10a6_bee
499	1930	55	0.9	7.3	1.5	0.028	0.470	0.015	3.092	7866	13.9	4.077	576	55.7	56.4	7.0	0.018	1902	1614	800m.fbmy8028_rel_native_lto_jun23_ef5b9b101_hack.cy10a7_bee
q1000.1
q1000.1: range queries with 1000 insert/s per client. Graphs for performance per 1-second interval are here.
Average throughput:
Query response time histogram: each cell has the percentage of responses that take <= the time in the header and max is the max response time in seconds. For max values in the top 25% of the range have a red background and in the bottom 25% of the range have a green background. The red background is not used when the min value is within 80% of the max value.
| dbms | 256us | 1ms | 4ms | 16ms | 64ms | 256ms | 1s | 4s | 16s | gt | max |
|---|---|---|---|---|---|---|---|---|---|---|---|
| fbmy8028_rel_native_lto_jun23_ef5b9b101_hack.cy10a0_bee | 0.429 | 95.440 | 4.123 | 0.008 | nonzero | 0.037 | |||||
| fbmy8028_rel_native_lto_jun23_ef5b9b101_hack.cy10a1_bee | 1.029 | 94.752 | 4.193 | 0.025 | nonzero | 0.052 | |||||
| fbmy8028_rel_native_lto_jun23_ef5b9b101_hack.cy10a2_bee | 0.425 | 95.937 | 3.621 | 0.017 | nonzero | 0.021 | |||||
| fbmy8028_rel_native_lto_jun23_ef5b9b101_hack.cy10a3_bee | 0.342 | 95.983 | 3.665 | 0.010 | nonzero | 0.038 | |||||
| fbmy8028_rel_native_lto_jun23_ef5b9b101_hack.cy10a4_bee | 0.176 | 97.046 | 2.758 | 0.020 | nonzero | 0.020 | |||||
| fbmy8028_rel_native_lto_jun23_ef5b9b101_hack.cy10a5_bee | 0.880 | 95.551 | 3.559 | 0.011 | nonzero | 0.059 | |||||
| fbmy8028_rel_native_lto_jun23_ef5b9b101_hack.cy10a6_bee | 0.694 | 95.178 | 4.069 | 0.059 | 0.011 | ||||||
| fbmy8028_rel_native_lto_jun23_ef5b9b101_hack.cy10a7_bee | 1.902 | 94.776 | 3.312 | 0.010 | nonzero | 0.038 |
Insert response time histogram: each cell has the percentage of responses that take <= the time in the header and max is the max response time in seconds. For max values in the top 25% of the range have a red background and in the bottom 25% of the range have a green background. The red background is not used when the min value is within 80% of the max value.
| dbms | 256us | 1ms | 4ms | 16ms | 64ms | 256ms | 1s | 4s | 16s | gt | max |
|---|---|---|---|---|---|---|---|---|---|---|---|
| fbmy8028_rel_native_lto_jun23_ef5b9b101_hack.cy10a0_bee | 99.572 | 0.422 | 0.003 | 0.003 | 0.074 | ||||||
| fbmy8028_rel_native_lto_jun23_ef5b9b101_hack.cy10a1_bee | 99.612 | 0.382 | 0.006 | 0.054 | |||||||
| fbmy8028_rel_native_lto_jun23_ef5b9b101_hack.cy10a2_bee | 99.594 | 0.403 | 0.003 | 0.057 | |||||||
| fbmy8028_rel_native_lto_jun23_ef5b9b101_hack.cy10a3_bee | 99.658 | 0.338 | 0.003 | 0.001 | 0.071 | ||||||
| fbmy8028_rel_native_lto_jun23_ef5b9b101_hack.cy10a4_bee | 99.653 | 0.344 | 0.001 | 0.001 | 0.067 | ||||||
| fbmy8028_rel_native_lto_jun23_ef5b9b101_hack.cy10a5_bee | 99.569 | 0.425 | 0.004 | 0.001 | 0.068 | ||||||
| fbmy8028_rel_native_lto_jun23_ef5b9b101_hack.cy10a6_bee | 99.664 | 0.331 | 0.004 | 0.001 | 0.067 | ||||||
| fbmy8028_rel_native_lto_jun23_ef5b9b101_hack.cy10a7_bee | 99.662 | 0.335 | 0.003 | 0.056 |
Delete response time histogram: each cell has the percentage of responses that take <= the time in the header and max is the max response time in seconds. For max values in the top 25% of the range have a red background and in the bottom 25% of the range have a green background. The red background is not used when the min value is within 80% of the max value.
| dbms | 256us | 1ms | 4ms | 16ms | 64ms | 256ms | 1s | 4s | 16s | gt | max |
|---|---|---|---|---|---|---|---|---|---|---|---|
| fbmy8028_rel_native_lto_jun23_ef5b9b101_hack.cy10a0_bee | 99.278 | 0.715 | 0.004 | 0.003 | 0.085 | ||||||
| fbmy8028_rel_native_lto_jun23_ef5b9b101_hack.cy10a1_bee | 99.424 | 0.556 | 0.021 | 0.055 | |||||||
| fbmy8028_rel_native_lto_jun23_ef5b9b101_hack.cy10a2_bee | 98.924 | 1.056 | 0.021 | 0.058 | |||||||
| fbmy8028_rel_native_lto_jun23_ef5b9b101_hack.cy10a3_bee | 99.222 | 0.765 | 0.010 | 0.003 | 0.081 | ||||||
| fbmy8028_rel_native_lto_jun23_ef5b9b101_hack.cy10a4_bee | 98.917 | 1.071 | 0.010 | 0.003 | 0.082 | ||||||
| fbmy8028_rel_native_lto_jun23_ef5b9b101_hack.cy10a5_bee | 99.331 | 0.657 | 0.011 | 0.001 | 0.066 | ||||||
| fbmy8028_rel_native_lto_jun23_ef5b9b101_hack.cy10a6_bee | 98.367 | 1.606 | 0.028 | 0.053 | |||||||
| fbmy8028_rel_native_lto_jun23_ef5b9b101_hack.cy10a7_bee | 99.614 | 0.383 | 0.003 | 0.056 |
Performance metrics for the DBMS listed above. Some are normalized by throughput, others are not. Legend for results is here.
ips	qps	rps	rmbps	wps	wmbps	rpq	rkbpq	wpi	wkbpi	csps	cpups	cspq	cpupq	dbgb1	dbgb2	rss	maxop	p50	p99	tag
999	1969	86	2.0	11.6	3.2	0.043	1.042	0.012	3.235	8193	15.6	4.160	634	55.7	57.1	9.1	0.037	2014	1598	800m.fbmy8028_rel_native_lto_jun23_ef5b9b101_hack.cy10a0_bee
999	1993	70	1.4	12.0	3.1	0.035	0.736	0.012	3.209	8336	15.5	4.182	622	55.7	57.1	7.0	0.052	1982	1662	800m.fbmy8028_rel_native_lto_jun23_ef5b9b101_hack.cy10a1_bee
998	1971	67	1.8	11.3	3.0	0.034	0.949	0.011	3.084	8205	15.6	4.163	633	55.7	57.1	9.0	0.021	1934	1648	800m.fbmy8028_rel_native_lto_jun23_ef5b9b101_hack.cy10a2_bee
999	1973	73	1.9	11.8	3.2	0.037	1.000	0.012	3.286	8197	15.7	4.155	637	55.6	57.1	9.1	0.038	1966	1646	800m.fbmy8028_rel_native_lto_jun23_ef5b9b101_hack.cy10a3_bee
999	1936	51	1.3	11.2	3.0	0.026	0.684	0.011	3.069	8057	15.5	4.162	641	55.7	57.1	9.0	0.020	1870	1646	800m.fbmy8028_rel_native_lto_jun23_ef5b9b101_hack.cy10a4_bee
999	2015	77	1.9	11.0	2.9	0.038	0.965	0.011	2.983	8363	15.5	4.150	615	55.7	57.2	9.0	0.059	2030	1646	800m.fbmy8028_rel_native_lto_jun23_ef5b9b101_hack.cy10a5_bee
998	1914	40	0.8	10.8	2.8	0.021	0.449	0.011	2.843	7999	15.4	4.180	644	55.7	57.1	6.9	0.011	1838	1678	800m.fbmy8028_rel_native_lto_jun23_ef5b9b101_hack.cy10a6_bee
998	2044	110	1.6	10.6	2.7	0.054	0.819	0.011	2.745	8585	15.2	4.201	595	55.7	57.2	7.0	0.038	2094	1647	800m.fbmy8028_rel_native_lto_jun23_ef5b9b101_hack.cy10a7_bee
l.i0
l.i0: load without secondary indexes
Performance metrics for all DBMS, not just the ones listed above. Some are normalized by throughput, others are not. Legend for results is here.
ips	qps	rps	rmbps	wps	wmbps	rpq	rkbpq	wpi	wkbpi	csps	cpups	cspq	cpupq	dbgb1	dbgb2	rss	maxop	p50	p99	tag
60855	0	0	0.0	47.4	14.0	0.000	0.000	0.001	0.236	6406	22.8	0.105	30	25.1	25.9	2.0	0.102	60931	55037	800m.fbmy8028_rel_native_lto_jun23_ef5b9b101_hack.cy10a0_bee
60740	0	0	0.0	47.4	14.0	0.000	0.000	0.001	0.236	6392	23.0	0.105	30	25.1	25.9	2.1	0.112	60831	54973	800m.fbmy8028_rel_native_lto_jun23_ef5b9b101_hack.cy10a1_bee
61505	0	0	0.0	48.0	14.2	0.000	0.000	0.001	0.236	6476	22.7	0.105	30	25.1	25.9	2.0	0.116	61628	55537	800m.fbmy8028_rel_native_lto_jun23_ef5b9b101_hack.cy10a2_bee
60767	0	0	0.0	47.5	14.0	0.000	0.000	0.001	0.236	6394	22.8	0.105	30	25.1	25.9	2.0	0.117	60832	54738	800m.fbmy8028_rel_native_lto_jun23_ef5b9b101_hack.cy10a3_bee
61022	0	0	0.0	47.6	14.1	0.000	0.000	0.001	0.236	6421	22.6	0.105	30	25.1	25.9	2.0	0.149	61131	54748	800m.fbmy8028_rel_native_lto_jun23_ef5b9b101_hack.cy10a4_bee
60990	0	0	0.0	47.6	14.1	0.000	0.000	0.001	0.236	6420	22.7	0.105	30	25.1	25.9	2.0	0.111	61130	54837	800m.fbmy8028_rel_native_lto_jun23_ef5b9b101_hack.cy10a5_bee
60883	0	0	0.0	47.5	14.0	0.000	0.000	0.001	0.236	6404	22.9	0.105	30	25.1	25.9	2.1	0.102	60933	54837	800m.fbmy8028_rel_native_lto_jun23_ef5b9b101_hack.cy10a6_bee
60556	0	0	0.0	47.2	14.0	0.000	0.000	0.001	0.236	6376	22.7	0.105	30	25.1	25.9	2.1	0.117	60633	54437	800m.fbmy8028_rel_native_lto_jun23_ef5b9b101_hack.cy10a7_bee
l.x
l.x: create secondary indexes
Performance metrics for all DBMS, not just the ones listed above. Some are normalized by throughput, others are not. Legend for results is here.
ips	qps	rps	rmbps	wps	wmbps	rpq	rkbpq	wpi	wkbpi	csps	cpups	cspq	cpupq	dbgb1	dbgb2	rss	maxop	p50	p99	tag
73633	0	98	15.4	29.8	10.8	0.001	0.214	0.000	0.150	448	11.7	0.006	13	51.0	51.8	10.4	0.009	NA	NA	800m.fbmy8028_rel_native_lto_jun23_ef5b9b101_hack.cy10a0_bee
73377	0	98	15.4	28.9	10.7	0.001	0.214	0.000	0.150	442	11.7	0.006	13	51.0	51.8	9.5	0.009	NA	NA	800m.fbmy8028_rel_native_lto_jun23_ef5b9b101_hack.cy10a1_bee
73216	0	97	15.3	29.7	10.7	0.001	0.214	0.000	0.150	458	11.7	0.006	13	51.0	51.8	10.4	0.009	NA	NA	800m.fbmy8028_rel_native_lto_jun23_ef5b9b101_hack.cy10a2_bee
73410	0	98	15.4	30.2	10.7	0.001	0.214	0.000	0.149	450	11.7	0.006	13	51.0	51.8	10.4	0.009	NA	NA	800m.fbmy8028_rel_native_lto_jun23_ef5b9b101_hack.cy10a3_bee
73525	0	98	15.4	30.1	10.7	0.001	0.214	0.000	0.150	448	11.7	0.006	13	51.0	51.8	10.4	0.009	NA	NA	800m.fbmy8028_rel_native_lto_jun23_ef5b9b101_hack.cy10a4_bee
73525	0	98	15.4	30.3	10.7	0.001	0.214	0.000	0.150	448	11.7	0.006	13	51.0	51.8	10.4	0.009	NA	NA	800m.fbmy8028_rel_native_lto_jun23_ef5b9b101_hack.cy10a5_bee
73701	0	98	15.4	29.4	10.8	0.001	0.214	0.000	0.150	448	11.7	0.006	13	51.0	51.8	9.4	0.009	NA	NA	800m.fbmy8028_rel_native_lto_jun23_ef5b9b101_hack.cy10a6_bee
73336	0	98	15.3	29.6	10.7	0.001	0.214	0.000	0.149	441	11.7	0.006	13	50.9	51.8	9.5	0.009	NA	NA	800m.fbmy8028_rel_native_lto_jun23_ef5b9b101_hack.cy10a7_bee
l.i1
l.i1: continue load after secondary indexes created
Performance metrics for all DBMS, not just the ones listed above. Some are normalized by throughput, others are not. Legend for results is here.
ips	qps	rps	rmbps	wps	wmbps	rpq	rkbpq	wpi	wkbpi	csps	cpups	cspq	cpupq	dbgb1	dbgb2	rss	maxop	p50	p99	tag
23240	0	344	24.5	151.5	55.1	0.015	1.081	0.007	2.429	10643	51.5	0.458	177	57.0	57.2	8.6	0.107	23224	20178	800m.fbmy8028_rel_native_lto_jun23_ef5b9b101_hack.cy10a0_bee
23073	0	265	15.0	148.0	55.3	0.011	0.665	0.006	2.453	10536	51.6	0.457	179	57.4	57.6	6.6	0.140	22974	19937	800m.fbmy8028_rel_native_lto_jun23_ef5b9b101_hack.cy10a1_bee
23196	0	346	25.0	150.3	55.4	0.015	1.103	0.006	2.445	10679	51.7	0.460	178	57.0	57.2	8.7	0.126	23174	20078	800m.fbmy8028_rel_native_lto_jun23_ef5b9b101_hack.cy10a2_bee
19106	0	348	28.1	140.0	51.4	0.018	1.505	0.007	2.755	9394	47.1	0.492	197	59.9	60.1	8.6	0.151	21326	3447	800m.fbmy8028_rel_native_lto_jun23_ef5b9b101_hack.cy10a3_bee
22022	0	302	20.4	152.0	55.5	0.014	0.951	0.007	2.582	10292	51.0	0.467	185	57.0	57.2	8.7	0.171	23124	6992	800m.fbmy8028_rel_native_lto_jun23_ef5b9b101_hack.cy10a4_bee
23234	0	343	24.5	150.8	55.4	0.015	1.080	0.006	2.440	10706	51.6	0.461	178	56.5	56.7	8.6	0.150	23223	20132	800m.fbmy8028_rel_native_lto_jun23_ef5b9b101_hack.cy10a5_bee
23111	0	270	15.7	146.8	54.6	0.012	0.696	0.006	2.421	10571	51.3	0.457	178	57.5	57.7	6.8	0.131	22975	19678	800m.fbmy8028_rel_native_lto_jun23_ef5b9b101_hack.cy10a6_bee
23375	0	272	15.5	148.5	55.4	0.012	0.678	0.006	2.426	10686	51.7	0.457	177	57.8	58.0	6.6	0.155	23373	20127	800m.fbmy8028_rel_native_lto_jun23_ef5b9b101_hack.cy10a7_bee
q100.1
q100.1: range queries with 100 insert/s per client
Performance metrics for all DBMS, not just the ones listed above. Some are normalized by throughput, others are not. Legend for results is here.
ips	qps	rps	rmbps	wps	wmbps	rpq	rkbpq	wpi	wkbpi	csps	cpups	cspq	cpupq	dbgb1	dbgb2	rss	maxop	p50	p99	tag
100	1900	266	4.2	8.2	1.9	0.140	2.254	0.082	18.998	7995	13.4	4.207	564	55.8	56.1	9.6	0.047	1918	1247	800m.fbmy8028_rel_native_lto_jun23_ef5b9b101_hack.cy10a0_bee
100	1975	203	2.9	8.5	2.0	0.103	1.527	0.085	20.216	8226	13.5	4.164	547	55.6	55.9	7.5	0.040	1982	1326	800m.fbmy8028_rel_native_lto_jun23_ef5b9b101_hack.cy10a1_bee
100	1911	266	3.9	8.2	1.9	0.139	2.093	0.082	19.016	8063	13.4	4.220	561	55.6	55.9	9.5	0.040	1886	1215	800m.fbmy8028_rel_native_lto_jun23_ef5b9b101_hack.cy10a2_bee
100	1958	268	4.5	9.6	2.4	0.137	2.341	0.096	24.591	8253	13.7	4.216	560	55.6	55.9	9.3	0.062	1966	1103	800m.fbmy8028_rel_native_lto_jun23_ef5b9b101_hack.cy10a3_bee
100	1907	219	2.9	6.0	1.0	0.115	1.558	0.060	10.708	7951	13.0	4.170	545	55.6	55.9	9.9	0.045	1869	1263	800m.fbmy8028_rel_native_lto_jun23_ef5b9b101_hack.cy10a4_bee
100	1992	296	4.5	8.8	2.0	0.149	2.339	0.088	20.856	8363	13.6	4.199	546	55.7	56.0	9.7	0.037	2014	1263	800m.fbmy8028_rel_native_lto_jun23_ef5b9b101_hack.cy10a5_bee
100	1988	200	2.9	8.1	1.9	0.101	1.500	0.081	19.254	8278	13.5	4.165	543	55.7	56.0	7.1	0.046	1998	1263	800m.fbmy8028_rel_native_lto_jun23_ef5b9b101_hack.cy10a6_bee
100	1883	249	3.8	8.7	2.0	0.132	2.050	0.087	20.848	7930	13.5	4.211	573	55.6	55.9	7.7	0.039	1853	1279	800m.fbmy8028_rel_native_lto_jun23_ef5b9b101_hack.cy10a7_bee
q500.1
q500.1: range queries with 500 insert/s per client
Performance metrics for all DBMS, not just the ones listed above. Some are normalized by throughput, others are not. Legend for results is here.
ips	qps	rps	rmbps	wps	wmbps	rpq	rkbpq	wpi	wkbpi	csps	cpups	cspq	cpupq	dbgb1	dbgb2	rss	maxop	p50	p99	tag
499	1904	45	1.2	7.3	1.6	0.024	0.646	0.015	3.193	7720	13.9	4.055	584	55.7	56.4	9.1	0.026	1886	1582	800m.fbmy8028_rel_native_lto_jun23_ef5b9b101_hack.cy10a0_bee
499	1881	14	0.3	6.0	1.0	0.007	0.182	0.012	2.131	7626	13.6	4.054	578	55.7	56.4	7.1	0.037	1790	1646	800m.fbmy8028_rel_native_lto_jun23_ef5b9b101_hack.cy10a1_bee
499	1944	32	0.7	7.0	1.4	0.017	0.368	0.014	2.912	7877	13.8	4.052	568	55.7	56.4	9.0	0.052	1901	1646	800m.fbmy8028_rel_native_lto_jun23_ef5b9b101_hack.cy10a2_bee
499	1930	27	0.5	5.7	1.0	0.014	0.282	0.011	1.967	7807	13.6	4.046	564	55.8	56.4	9.2	0.017	1886	1630	800m.fbmy8028_rel_native_lto_jun23_ef5b9b101_hack.cy10a3_bee
499	1915	32	0.8	7.0	1.5	0.017	0.454	0.014	3.055	7762	13.9	4.052	581	55.7	56.3	9.1	0.026	1854	1630	800m.fbmy8028_rel_native_lto_jun23_ef5b9b101_hack.cy10a4_bee
499	1937	41	0.8	6.4	1.2	0.021	0.428	0.013	2.553	7841	13.7	4.047	566	55.7	56.4	9.2	0.019	1902	1614	800m.fbmy8028_rel_native_lto_jun23_ef5b9b101_hack.cy10a5_bee
499	1898	25	0.7	7.6	1.6	0.013	0.367	0.015	3.370	7697	14.0	4.057	590	55.6	56.3	7.0	0.011	1822	1694	800m.fbmy8028_rel_native_lto_jun23_ef5b9b101_hack.cy10a6_bee
499	1930	55	0.9	7.3	1.5	0.028	0.470	0.015	3.092	7866	13.9	4.077	576	55.7	56.4	7.0	0.018	1902	1614	800m.fbmy8028_rel_native_lto_jun23_ef5b9b101_hack.cy10a7_bee
q1000.1
q1000.1: range queries with 1000 insert/s per client
Performance metrics for all DBMS, not just the ones listed above. Some are normalized by throughput, others are not. Legend for results is here.
ips	qps	rps	rmbps	wps	wmbps	rpq	rkbpq	wpi	wkbpi	csps	cpups	cspq	cpupq	dbgb1	dbgb2	rss	maxop	p50	p99	tag
999	1969	86	2.0	11.6	3.2	0.043	1.042	0.012	3.235	8193	15.6	4.160	634	55.7	57.1	9.1	0.037	2014	1598	800m.fbmy8028_rel_native_lto_jun23_ef5b9b101_hack.cy10a0_bee
999	1993	70	1.4	12.0	3.1	0.035	0.736	0.012	3.209	8336	15.5	4.182	622	55.7	57.1	7.0	0.052	1982	1662	800m.fbmy8028_rel_native_lto_jun23_ef5b9b101_hack.cy10a1_bee
998	1971	67	1.8	11.3	3.0	0.034	0.949	0.011	3.084	8205	15.6	4.163	633	55.7	57.1	9.0	0.021	1934	1648	800m.fbmy8028_rel_native_lto_jun23_ef5b9b101_hack.cy10a2_bee
999	1973	73	1.9	11.8	3.2	0.037	1.000	0.012	3.286	8197	15.7	4.155	637	55.6	57.1	9.1	0.038	1966	1646	800m.fbmy8028_rel_native_lto_jun23_ef5b9b101_hack.cy10a3_bee
999	1936	51	1.3	11.2	3.0	0.026	0.684	0.011	3.069	8057	15.5	4.162	641	55.7	57.1	9.0	0.020	1870	1646	800m.fbmy8028_rel_native_lto_jun23_ef5b9b101_hack.cy10a4_bee
999	2015	77	1.9	11.0	2.9	0.038	0.965	0.011	2.983	8363	15.5	4.150	615	55.7	57.2	9.0	0.059	2030	1646	800m.fbmy8028_rel_native_lto_jun23_ef5b9b101_hack.cy10a5_bee
998	1914	40	0.8	10.8	2.8	0.021	0.449	0.011	2.843	7999	15.4	4.180	644	55.7	57.1	6.9	0.011	1838	1678	800m.fbmy8028_rel_native_lto_jun23_ef5b9b101_hack.cy10a6_bee
998	2044	110	1.6	10.6	2.7	0.054	0.819	0.011	2.745	8585	15.2	4.201	595	55.7	57.2	7.0	0.038	2094	1647	800m.fbmy8028_rel_native_lto_jun23_ef5b9b101_hack.cy10a7_bee
l.i0
- l.i0: load without secondary indexes
- Legend for results is here.
- Each entry lists the percentage of responses that fit in that bucket (slower than max time for previous bucket, faster than min time for next bucket).
Insert response time histogram
256us	1ms	4ms	16ms	64ms	256ms	1s	4s	16s	gt	max	tag
0.000	0.000	99.733	0.191	0.073	0.003	0.000	0.000	0.000	0.000	0.102	fbmy8028_rel_native_lto_jun23_ef5b9b101_hack.cy10a0_bee
0.000	0.000	99.733	0.191	0.073	0.003	0.000	0.000	0.000	0.000	0.112	fbmy8028_rel_native_lto_jun23_ef5b9b101_hack.cy10a1_bee
0.000	0.000	99.735	0.190	0.072	0.003	0.000	0.000	0.000	0.000	0.116	fbmy8028_rel_native_lto_jun23_ef5b9b101_hack.cy10a2_bee
0.000	0.000	99.733	0.192	0.072	0.003	0.000	0.000	0.000	0.000	0.117	fbmy8028_rel_native_lto_jun23_ef5b9b101_hack.cy10a3_bee
0.000	0.000	99.734	0.191	0.072	0.003	0.000	0.000	0.000	0.000	0.149	fbmy8028_rel_native_lto_jun23_ef5b9b101_hack.cy10a4_bee
0.000	0.000	99.733	0.191	0.072	0.003	0.000	0.000	0.000	0.000	0.111	fbmy8028_rel_native_lto_jun23_ef5b9b101_hack.cy10a5_bee
0.000	0.000	99.733	0.191	0.073	0.003	0.000	0.000	0.000	0.000	0.102	fbmy8028_rel_native_lto_jun23_ef5b9b101_hack.cy10a6_bee
0.000	0.000	99.732	0.192	0.073	0.003	0.000	0.000	0.000	0.000	0.117	fbmy8028_rel_native_lto_jun23_ef5b9b101_hack.cy10a7_bee
l.x
- l.x: create secondary indexes
- Legend for results is here.
- Each entry lists the percentage of responses that fit in that bucket (slower than max time for previous bucket, faster than min time for next bucket).
TODO - determine whether there is data for create index response time
l.i1
- l.i1: continue load after secondary indexes created
- Legend for results is here.
- Each entry lists the percentage of responses that fit in that bucket (slower than max time for previous bucket, faster than min time for next bucket).
Insert response time histogram
256us	1ms	4ms	16ms	64ms	256ms	1s	4s	16s	gt	max	tag
0.000	0.000	99.650	0.343	0.004	0.003	0.000	0.000	0.000	0.000	0.107	fbmy8028_rel_native_lto_jun23_ef5b9b101_hack.cy10a0_bee
0.000	0.000	99.658	0.336	0.004	0.003	0.000	0.000	0.000	0.000	0.140	fbmy8028_rel_native_lto_jun23_ef5b9b101_hack.cy10a1_bee
0.000	0.000	99.649	0.343	0.004	0.003	0.000	0.000	0.000	0.000	0.126	fbmy8028_rel_native_lto_jun23_ef5b9b101_hack.cy10a2_bee
0.000	0.000	94.089	5.826	0.083	0.003	0.000	0.000	0.000	0.000	0.151	fbmy8028_rel_native_lto_jun23_ef5b9b101_hack.cy10a3_bee
0.000	0.000	97.049	2.942	0.007	0.003	0.000	0.000	0.000	0.000	0.171	fbmy8028_rel_native_lto_jun23_ef5b9b101_hack.cy10a4_bee
0.000	0.000	99.654	0.337	0.006	0.003	0.000	0.000	0.000	0.000	0.150	fbmy8028_rel_native_lto_jun23_ef5b9b101_hack.cy10a5_bee
0.000	0.000	99.660	0.333	0.004	0.003	0.000	0.000	0.000	0.000	0.131	fbmy8028_rel_native_lto_jun23_ef5b9b101_hack.cy10a6_bee
0.000	0.000	99.662	0.330	0.006	0.003	0.000	0.000	0.000	0.000	0.155	fbmy8028_rel_native_lto_jun23_ef5b9b101_hack.cy10a7_bee
Delete response time histogram
256us	1ms	4ms	16ms	64ms	256ms	1s	4s	16s	gt	max	tag
0.000	0.000	99.634	0.356	0.008	0.002	0.000	0.000	0.000	0.000	0.107	fbmy8028_rel_native_lto_jun23_ef5b9b101_hack.cy10a0_bee
0.000	0.000	99.614	0.375	0.008	0.003	0.000	0.000	0.000	0.000	0.149	fbmy8028_rel_native_lto_jun23_ef5b9b101_hack.cy10a1_bee
0.000	0.000	99.606	0.382	0.009	0.003	0.000	0.000	0.000	0.000	0.145	fbmy8028_rel_native_lto_jun23_ef5b9b101_hack.cy10a2_bee
0.000	0.000	93.980	5.933	0.084	0.003	0.000	0.000	0.000	0.000	0.169	fbmy8028_rel_native_lto_jun23_ef5b9b101_hack.cy10a3_bee
0.000	0.000	96.427	3.559	0.011	0.003	0.000	0.000	0.000	0.000	0.150	fbmy8028_rel_native_lto_jun23_ef5b9b101_hack.cy10a4_bee
0.000	0.000	99.598	0.387	0.012	0.003	0.000	0.000	0.000	0.000	0.169	fbmy8028_rel_native_lto_jun23_ef5b9b101_hack.cy10a5_bee
0.000	0.000	99.601	0.387	0.009	0.003	0.000	0.000	0.000	0.000	0.126	fbmy8028_rel_native_lto_jun23_ef5b9b101_hack.cy10a6_bee
0.000	0.000	99.608	0.379	0.010	0.003	0.000	0.000	0.000	0.000	0.173	fbmy8028_rel_native_lto_jun23_ef5b9b101_hack.cy10a7_bee
q100.1
- q100.1: range queries with 100 insert/s per client
- Legend for results is here.
- Each entry lists the percentage of responses that fit in that bucket (slower than max time for previous bucket, faster than min time for next bucket).
Query response time histogram
256us	1ms	4ms	16ms	64ms	256ms	1s	4s	16s	gt	max	tag
0.382	94.216	5.394	0.009	nonzero	0.000	0.000	0.000	0.000	0.000	0.047	fbmy8028_rel_native_lto_jun23_ef5b9b101_hack.cy10a0_bee
1.720	93.467	4.792	0.021	nonzero	0.000	0.000	0.000	0.000	0.000	0.040	fbmy8028_rel_native_lto_jun23_ef5b9b101_hack.cy10a1_bee
1.438	93.123	5.425	0.013	nonzero	0.000	0.000	0.000	0.000	0.000	0.040	fbmy8028_rel_native_lto_jun23_ef5b9b101_hack.cy10a2_bee
1.136	94.149	4.700	0.014	0.001	0.000	0.000	0.000	0.000	0.000	0.062	fbmy8028_rel_native_lto_jun23_ef5b9b101_hack.cy10a3_bee
0.659	94.999	4.329	0.013	nonzero	0.000	0.000	0.000	0.000	0.000	0.045	fbmy8028_rel_native_lto_jun23_ef5b9b101_hack.cy10a4_bee
1.204	94.533	4.258	0.005	nonzero	0.000	0.000	0.000	0.000	0.000	0.037	fbmy8028_rel_native_lto_jun23_ef5b9b101_hack.cy10a5_bee
1.352	94.714	3.910	0.024	nonzero	0.000	0.000	0.000	0.000	0.000	0.046	fbmy8028_rel_native_lto_jun23_ef5b9b101_hack.cy10a6_bee
1.572	91.810	6.590	0.027	nonzero	0.000	0.000	0.000	0.000	0.000	0.039	fbmy8028_rel_native_lto_jun23_ef5b9b101_hack.cy10a7_bee
Insert response time histogram
256us	1ms	4ms	16ms	64ms	256ms	1s	4s	16s	gt	max	tag
0.000	0.000	99.333	0.625	0.042	0.000	0.000	0.000	0.000	0.000	0.017	fbmy8028_rel_native_lto_jun23_ef5b9b101_hack.cy10a0_bee
0.000	0.000	99.375	0.583	0.042	0.000	0.000	0.000	0.000	0.000	0.019	fbmy8028_rel_native_lto_jun23_ef5b9b101_hack.cy10a1_bee
0.000	0.000	99.542	0.444	0.014	0.000	0.000	0.000	0.000	0.000	0.018	fbmy8028_rel_native_lto_jun23_ef5b9b101_hack.cy10a2_bee
0.000	0.000	99.569	0.431	0.000	0.000	0.000	0.000	0.000	0.000	0.015	fbmy8028_rel_native_lto_jun23_ef5b9b101_hack.cy10a3_bee
0.000	0.000	99.319	0.611	0.069	0.000	0.000	0.000	0.000	0.000	0.019	fbmy8028_rel_native_lto_jun23_ef5b9b101_hack.cy10a4_bee
0.000	0.000	99.444	0.556	0.000	0.000	0.000	0.000	0.000	0.000	0.014	fbmy8028_rel_native_lto_jun23_ef5b9b101_hack.cy10a5_bee
0.000	0.000	99.417	0.542	0.042	0.000	0.000	0.000	0.000	0.000	0.022	fbmy8028_rel_native_lto_jun23_ef5b9b101_hack.cy10a6_bee
0.000	0.000	99.250	0.722	0.028	0.000	0.000	0.000	0.000	0.000	0.018	fbmy8028_rel_native_lto_jun23_ef5b9b101_hack.cy10a7_bee
Delete response time histogram
256us	1ms	4ms	16ms	64ms	256ms	1s	4s	16s	gt	max	tag
0.000	0.000	99.139	0.833	0.028	0.000	0.000	0.000	0.000	0.000	0.052	fbmy8028_rel_native_lto_jun23_ef5b9b101_hack.cy10a0_bee
0.000	0.000	82.667	17.069	0.264	0.000	0.000	0.000	0.000	0.000	0.022	fbmy8028_rel_native_lto_jun23_ef5b9b101_hack.cy10a1_bee
0.000	0.000	84.097	15.611	0.292	0.000	0.000	0.000	0.000	0.000	0.027	fbmy8028_rel_native_lto_jun23_ef5b9b101_hack.cy10a2_bee
0.000	0.000	86.972	12.875	0.153	0.000	0.000	0.000	0.000	0.000	0.020	fbmy8028_rel_native_lto_jun23_ef5b9b101_hack.cy10a3_bee
0.000	0.000	84.236	15.542	0.222	0.000	0.000	0.000	0.000	0.000	0.022	fbmy8028_rel_native_lto_jun23_ef5b9b101_hack.cy10a4_bee
0.000	0.000	96.833	3.111	0.056	0.000	0.000	0.000	0.000	0.000	0.020	fbmy8028_rel_native_lto_jun23_ef5b9b101_hack.cy10a5_bee
0.000	0.000	81.903	17.681	0.417	0.000	0.000	0.000	0.000	0.000	0.027	fbmy8028_rel_native_lto_jun23_ef5b9b101_hack.cy10a6_bee
0.000	0.000	92.972	6.931	0.097	0.000	0.000	0.000	0.000	0.000	0.023	fbmy8028_rel_native_lto_jun23_ef5b9b101_hack.cy10a7_bee
q500.1
- q500.1: range queries with 500 insert/s per client
- Legend for results is here.
- Each entry lists the percentage of responses that fit in that bucket (slower than max time for previous bucket, faster than min time for next bucket).
Query response time histogram
256us	1ms	4ms	16ms	64ms	256ms	1s	4s	16s	gt	max	tag
0.365	94.265	5.352	0.018	nonzero	0.000	0.000	0.000	0.000	0.000	0.026	fbmy8028_rel_native_lto_jun23_ef5b9b101_hack.cy10a0_bee
0.544	93.116	6.292	0.047	nonzero	0.000	0.000	0.000	0.000	0.000	0.037	fbmy8028_rel_native_lto_jun23_ef5b9b101_hack.cy10a1_bee
0.834	94.464	4.677	0.025	nonzero	0.000	0.000	0.000	0.000	0.000	0.052	fbmy8028_rel_native_lto_jun23_ef5b9b101_hack.cy10a2_bee
0.410	94.813	4.755	0.023	nonzero	0.000	0.000	0.000	0.000	0.000	0.017	fbmy8028_rel_native_lto_jun23_ef5b9b101_hack.cy10a3_bee
0.193	95.883	3.905	0.019	nonzero	0.000	0.000	0.000	0.000	0.000	0.026	fbmy8028_rel_native_lto_jun23_ef5b9b101_hack.cy10a4_bee
0.481	94.555	4.949	0.014	nonzero	0.000	0.000	0.000	0.000	0.000	0.019	fbmy8028_rel_native_lto_jun23_ef5b9b101_hack.cy10a5_bee
0.734	93.989	5.248	0.028	0.000	0.000	0.000	0.000	0.000	0.000	0.011	fbmy8028_rel_native_lto_jun23_ef5b9b101_hack.cy10a6_bee
1.455	93.089	5.414	0.042	nonzero	0.000	0.000	0.000	0.000	0.000	0.018	fbmy8028_rel_native_lto_jun23_ef5b9b101_hack.cy10a7_bee
Insert response time histogram
256us	1ms	4ms	16ms	64ms	256ms	1s	4s	16s	gt	max	tag
0.000	0.000	99.567	0.425	0.006	0.003	0.000	0.000	0.000	0.000	0.066	fbmy8028_rel_native_lto_jun23_ef5b9b101_hack.cy10a0_bee
0.000	0.000	99.528	0.456	0.017	0.000	0.000	0.000	0.000	0.000	0.040	fbmy8028_rel_native_lto_jun23_ef5b9b101_hack.cy10a1_bee
0.000	0.000	99.575	0.408	0.017	0.000	0.000	0.000	0.000	0.000	0.062	fbmy8028_rel_native_lto_jun23_ef5b9b101_hack.cy10a2_bee
0.000	0.000	99.589	0.397	0.011	0.003	0.000	0.000	0.000	0.000	0.087	fbmy8028_rel_native_lto_jun23_ef5b9b101_hack.cy10a3_bee
0.000	0.000	99.531	0.464	0.006	0.000	0.000	0.000	0.000	0.000	0.041	fbmy8028_rel_native_lto_jun23_ef5b9b101_hack.cy10a4_bee
0.000	0.000	99.589	0.394	0.017	0.000	0.000	0.000	0.000	0.000	0.050	fbmy8028_rel_native_lto_jun23_ef5b9b101_hack.cy10a5_bee
0.000	0.000	99.519	0.461	0.019	0.000	0.000	0.000	0.000	0.000	0.039	fbmy8028_rel_native_lto_jun23_ef5b9b101_hack.cy10a6_bee
0.000	0.000	99.533	0.458	0.008	0.000	0.000	0.000	0.000	0.000	0.041	fbmy8028_rel_native_lto_jun23_ef5b9b101_hack.cy10a7_bee
Delete response time histogram
256us	1ms	4ms	16ms	64ms	256ms	1s	4s	16s	gt	max	tag
0.000	0.000	98.147	1.828	0.022	0.003	0.000	0.000	0.000	0.000	0.080	fbmy8028_rel_native_lto_jun23_ef5b9b101_hack.cy10a0_bee
0.000	0.000	95.656	4.278	0.067	0.000	0.000	0.000	0.000	0.000	0.054	fbmy8028_rel_native_lto_jun23_ef5b9b101_hack.cy10a1_bee
0.000	0.000	95.950	3.953	0.097	0.000	0.000	0.000	0.000	0.000	0.047	fbmy8028_rel_native_lto_jun23_ef5b9b101_hack.cy10a2_bee
0.000	0.000	95.922	4.014	0.061	0.003	0.000	0.000	0.000	0.000	0.072	fbmy8028_rel_native_lto_jun23_ef5b9b101_hack.cy10a3_bee
0.000	0.000	96.342	3.614	0.044	0.000	0.000	0.000	0.000	0.000	0.057	fbmy8028_rel_native_lto_jun23_ef5b9b101_hack.cy10a4_bee
0.000	0.000	97.681	2.283	0.036	0.000	0.000	0.000	0.000	0.000	0.063	fbmy8028_rel_native_lto_jun23_ef5b9b101_hack.cy10a5_bee
0.000	0.000	95.981	3.936	0.083	0.000	0.000	0.000	0.000	0.000	0.053	fbmy8028_rel_native_lto_jun23_ef5b9b101_hack.cy10a6_bee
0.000	0.000	98.461	1.506	0.033	0.000	0.000	0.000	0.000	0.000	0.056	fbmy8028_rel_native_lto_jun23_ef5b9b101_hack.cy10a7_bee
q1000.1
- q1000.1: range queries with 1000 insert/s per client
- Legend for results is here.
- Each entry lists the percentage of responses that fit in that bucket (slower than max time for previous bucket, faster than min time for next bucket).
Query response time histogram
256us	1ms	4ms	16ms	64ms	256ms	1s	4s	16s	gt	max	tag
0.429	95.440	4.123	0.008	nonzero	0.000	0.000	0.000	0.000	0.000	0.037	fbmy8028_rel_native_lto_jun23_ef5b9b101_hack.cy10a0_bee
1.029	94.752	4.193	0.025	nonzero	0.000	0.000	0.000	0.000	0.000	0.052	fbmy8028_rel_native_lto_jun23_ef5b9b101_hack.cy10a1_bee
0.425	95.937	3.621	0.017	nonzero	0.000	0.000	0.000	0.000	0.000	0.021	fbmy8028_rel_native_lto_jun23_ef5b9b101_hack.cy10a2_bee
0.342	95.983	3.665	0.010	nonzero	0.000	0.000	0.000	0.000	0.000	0.038	fbmy8028_rel_native_lto_jun23_ef5b9b101_hack.cy10a3_bee
0.176	97.046	2.758	0.020	nonzero	0.000	0.000	0.000	0.000	0.000	0.020	fbmy8028_rel_native_lto_jun23_ef5b9b101_hack.cy10a4_bee
0.880	95.551	3.559	0.011	nonzero	0.000	0.000	0.000	0.000	0.000	0.059	fbmy8028_rel_native_lto_jun23_ef5b9b101_hack.cy10a5_bee
0.694	95.178	4.069	0.059	0.000	0.000	0.000	0.000	0.000	0.000	0.011	fbmy8028_rel_native_lto_jun23_ef5b9b101_hack.cy10a6_bee
1.902	94.776	3.312	0.010	nonzero	0.000	0.000	0.000	0.000	0.000	0.038	fbmy8028_rel_native_lto_jun23_ef5b9b101_hack.cy10a7_bee
Insert response time histogram
256us	1ms	4ms	16ms	64ms	256ms	1s	4s	16s	gt	max	tag
0.000	0.000	99.572	0.422	0.003	0.003	0.000	0.000	0.000	0.000	0.074	fbmy8028_rel_native_lto_jun23_ef5b9b101_hack.cy10a0_bee
0.000	0.000	99.612	0.382	0.006	0.000	0.000	0.000	0.000	0.000	0.054	fbmy8028_rel_native_lto_jun23_ef5b9b101_hack.cy10a1_bee
0.000	0.000	99.594	0.403	0.003	0.000	0.000	0.000	0.000	0.000	0.057	fbmy8028_rel_native_lto_jun23_ef5b9b101_hack.cy10a2_bee
0.000	0.000	99.658	0.338	0.003	0.001	0.000	0.000	0.000	0.000	0.071	fbmy8028_rel_native_lto_jun23_ef5b9b101_hack.cy10a3_bee
0.000	0.000	99.653	0.344	0.001	0.001	0.000	0.000	0.000	0.000	0.067	fbmy8028_rel_native_lto_jun23_ef5b9b101_hack.cy10a4_bee
0.000	0.000	99.569	0.425	0.004	0.001	0.000	0.000	0.000	0.000	0.068	fbmy8028_rel_native_lto_jun23_ef5b9b101_hack.cy10a5_bee
0.000	0.000	99.664	0.331	0.004	0.001	0.000	0.000	0.000	0.000	0.067	fbmy8028_rel_native_lto_jun23_ef5b9b101_hack.cy10a6_bee
0.000	0.000	99.662	0.335	0.003	0.000	0.000	0.000	0.000	0.000	0.056	fbmy8028_rel_native_lto_jun23_ef5b9b101_hack.cy10a7_bee
Delete response time histogram
256us	1ms	4ms	16ms	64ms	256ms	1s	4s	16s	gt	max	tag
0.000	0.000	99.278	0.715	0.004	0.003	0.000	0.000	0.000	0.000	0.085	fbmy8028_rel_native_lto_jun23_ef5b9b101_hack.cy10a0_bee
0.000	0.000	99.424	0.556	0.021	0.000	0.000	0.000	0.000	0.000	0.055	fbmy8028_rel_native_lto_jun23_ef5b9b101_hack.cy10a1_bee
0.000	0.000	98.924	1.056	0.021	0.000	0.000	0.000	0.000	0.000	0.058	fbmy8028_rel_native_lto_jun23_ef5b9b101_hack.cy10a2_bee
0.000	0.000	99.222	0.765	0.010	0.003	0.000	0.000	0.000	0.000	0.081	fbmy8028_rel_native_lto_jun23_ef5b9b101_hack.cy10a3_bee
0.000	0.000	98.917	1.071	0.010	0.003	0.000	0.000	0.000	0.000	0.082	fbmy8028_rel_native_lto_jun23_ef5b9b101_hack.cy10a4_bee
0.000	0.000	99.331	0.657	0.011	0.001	0.000	0.000	0.000	0.000	0.066	fbmy8028_rel_native_lto_jun23_ef5b9b101_hack.cy10a5_bee
0.000	0.000	98.367	1.606	0.028	0.000	0.000	0.000	0.000	0.000	0.053	fbmy8028_rel_native_lto_jun23_ef5b9b101_hack.cy10a6_bee
0.000	0.000	99.614	0.383	0.003	0.000	0.000	0.000	0.000	0.000	0.056	fbmy8028_rel_native_lto_jun23_ef5b9b101_hack.cy10a7_bee