Introduction
This is a report for the insert benchmark with 12000M docs and 24 client(s). It is generated by scripts (bash, awk, sed) and Tufte might not be impressed. An overview of the insert benchmark is here and a short update is here. Below, by DBMS, I mean DBMS+version.config. An example is my8020.c10b40 where my means MySQL, 8020 is version 8.0.20 and c10b40 is the name for the configuration file.
The test server has 80 cores with hyperthreads enabled, 256G RAM and fast SSD. The benchmark was run with 24 client and there were 1 or 3 connections per client (1 for queries or inserts without rate limits, 1+1 for rate limited inserts+deletes). There are 24 tables, with a client per table. It loads 500M rows per-table without secondary indexes, creates secondary indexes, then inserts 50M rows per-table with a delete per insert to avoid growing the table. The read-write tests were run for 7200 seconds each. The read+write tests were skipped. The database is larger than memory.
The tested DBMS are:
- fbmy5635_202203072101.cy9c5_u - MyRocks with FB MySQL 5.6.35 from 7 March 2022 at git hash 84ce624a with RocksDB 6.28.2, cy9c5_u config
- fbmy5635_202304122154.cy9c5_u - MyRocks with FB MySQL 5.6.35 from 12 April 2023 at git hash f2161d019 with RocksDB 7.10.2, cy9c5_u config
- fbmy5635_202305292102.cy9c5_u - MyRocks with FB MySQL 5.6.35 from 29 May 2023 at git hash 509203f4 with RocksDB 8.2.1, cy9c5_u config
- fbmy5635_jun23_7e40af67.cy9c5_u - MyRocks with FB MySQL 5.6.35 from 23 June 2023 at git hash 7e40af67 with RocksDB 8.2.1, cy9c5_u config
Contents
- Summary
- l.i0: load without secondary indexes
- l.x: create secondary indexes
- l.i1: continue load after secondary indexes created
- q100.1: range queries with 100 insert/s per client
- q500.1: range queries with 500 insert/s per client
- q1000.1: range queries with 1000 insert/s per client
Summary
The numbers are inserts/s for l.i0 and l.i1, indexed docs (or rows) /s for l.x and queries/s for q*.2. The values are the average rate over the entire test for inserts (IPS) and queries (QPS). The range of values for IPS and QPS is split into 3 parts: bottom 25%, middle 50%, top 25%. Values in the bottom 25% have a red background, values in the top 25% have a green background and values in the middle have no color. A gray background is used for values that can be ignored because the DBMS did not sustain the target insert rate. Red backgrounds are not used when the minimum value is within 80% of the max value.
| dbms | l.i0 | l.x | l.i1 | q100.1 | q500.1 | q1000.1 |
|---|---|---|---|---|---|---|
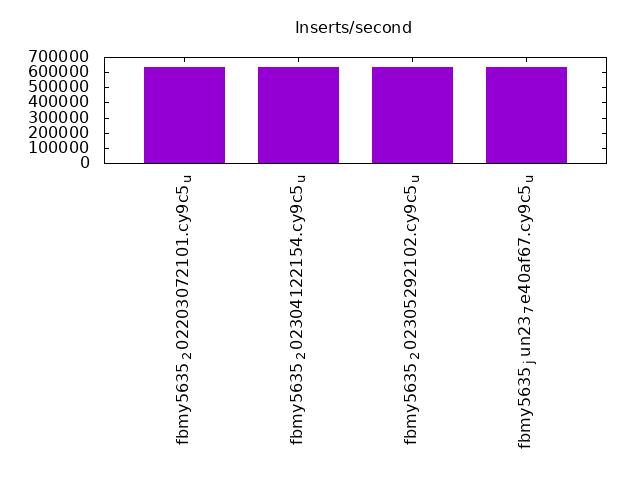
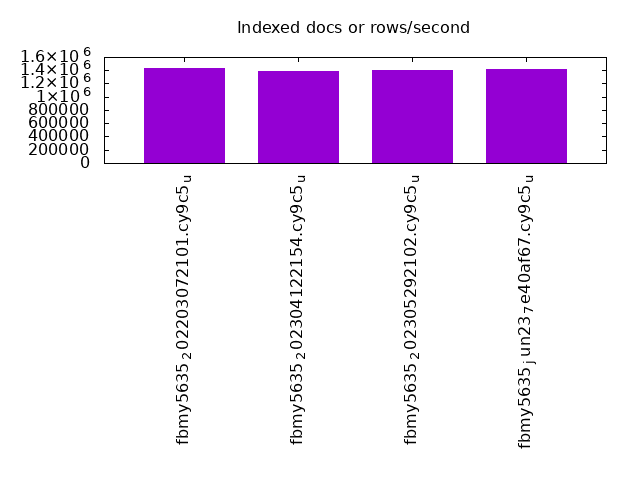
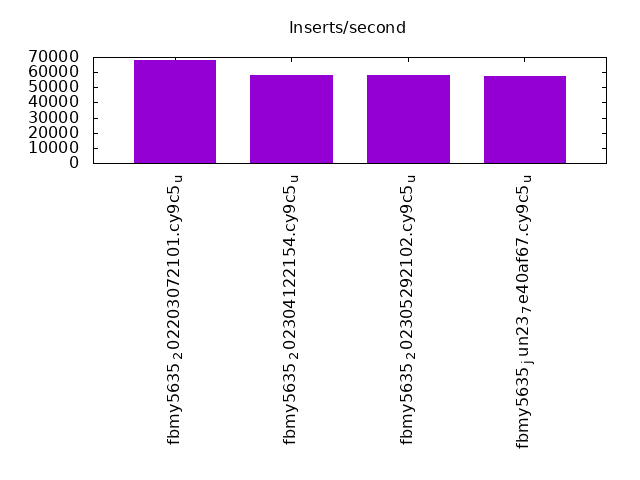
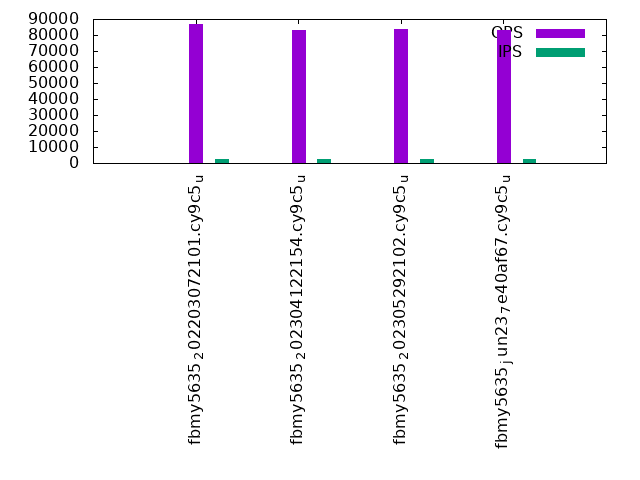
| fbmy5635_202203072101.cy9c5_u | 634316 | 1429775 | 67923 | 86676 | 81096 | 73796 |
| fbmy5635_202304122154.cy9c5_u | 632411 | 1382182 | 57977 | 82914 | 76386 | 68814 |
| fbmy5635_202305292102.cy9c5_u | 633513 | 1401062 | 57837 | 83496 | 77048 | 69935 |
| fbmy5635_jun23_7e40af67.cy9c5_u | 631114 | 1411942 | 57670 | 83102 | 76926 | 69760 |
This table has relative throughput, throughput for the DBMS relative to the DBMS in the first line, using the absolute throughput from the previous table. Values less than 0.95 have a yellow background. Values greater than 1.05 have a blue background.
| dbms | l.i0 | l.x | l.i1 | q100.1 | q500.1 | q1000.1 |
|---|---|---|---|---|---|---|
| fbmy5635_202203072101.cy9c5_u | 1.00 | 1.00 | 1.00 | 1.00 | 1.00 | 1.00 |
| fbmy5635_202304122154.cy9c5_u | 1.00 | 0.97 | 0.85 | 0.96 | 0.94 | 0.93 |
| fbmy5635_202305292102.cy9c5_u | 1.00 | 0.98 | 0.85 | 0.96 | 0.95 | 0.95 |
| fbmy5635_jun23_7e40af67.cy9c5_u | 0.99 | 0.99 | 0.85 | 0.96 | 0.95 | 0.95 |
This lists the average rate of inserts/s for the tests that do inserts concurrent with queries. For such tests the query rate is listed in the table above. The read+write tests are setup so that the insert rate should match the target rate every second. Cells that are not at least 95% of the target have a red background to indicate a failure to satisfy the target.
| dbms | q100.1 | q500.1 | q1000.1 |
|---|---|---|---|
| fbmy5635_202203072101.cy9c5_u | 2390 | 11947 | 23910 |
| fbmy5635_202304122154.cy9c5_u | 2387 | 11935 | 23871 |
| fbmy5635_202305292102.cy9c5_u | 2386 | 11934 | 23867 |
| fbmy5635_jun23_7e40af67.cy9c5_u | 2387 | 11935 | 23867 |
| target | 2400 | 12000 | 24000 |
l.i0
l.i0: load without secondary indexes. Graphs for performance per 1-second interval are here.
Average throughput:
Insert response time histogram: each cell has the percentage of responses that take <= the time in the header and max is the max response time in seconds. For the max column values in the top 25% of the range have a red background and in the bottom 25% of the range have a green background. The red background is not used when the min value is within 80% of the max value.
| dbms | 256us | 1ms | 4ms | 16ms | 64ms | 256ms | 1s | 4s | 16s | gt | max |
|---|---|---|---|---|---|---|---|---|---|---|---|
| fbmy5635_202203072101.cy9c5_u | 0.013 | 75.039 | 24.904 | 0.003 | 0.041 | nonzero | 0.372 | ||||
| fbmy5635_202304122154.cy9c5_u | 0.008 | 74.799 | 25.149 | 0.003 | 0.041 | 0.225 | |||||
| fbmy5635_202305292102.cy9c5_u | 0.007 | 75.443 | 24.506 | 0.004 | 0.040 | 0.237 | |||||
| fbmy5635_jun23_7e40af67.cy9c5_u | 0.006 | 74.843 | 25.106 | 0.003 | 0.042 | 0.229 |
Performance metrics for the DBMS listed above. Some are normalized by throughput, others are not. Legend for results is here.
ips	qps	rps	rmbps	wps	wmbps	rpq	rkbpq	wpi	wkbpi	csps	cpups	cspq	cpupq	dbgb1	dbgb2	rss	maxop	p50	p99	tag
634316	0	11	0.2	3278.2	361.0	0.000	0.000	0.005	0.583	487544	42.2	0.769	53	376.5	377.8	167.6	0.372	26573	17782	12000m.fbmy5635_202203072101.cy9c5_u
632411	0	40	0.4	2129.2	231.3	0.000	0.001	0.003	0.375	255535	35.8	0.404	45	376.3	377.7	98.4	0.225	26773	20879	12000m.fbmy5635_202304122154.cy9c5_u
633513	0	42	0.5	2138.1	233.5	0.000	0.001	0.003	0.377	280518	36.8	0.443	46	376.3	377.7	98.7	0.237	26773	21279	12000m.fbmy5635_202305292102.cy9c5_u
631114	0	37	0.4	2132.0	232.6	0.000	0.001	0.003	0.377	285589	36.8	0.453	47	376.2	377.6	98.7	0.229	26773	20482	12000m.fbmy5635_jun23_7e40af67.cy9c5_u
l.x
l.x: create secondary indexes.
Average throughput:
Performance metrics for the DBMS listed above. Some are normalized by throughput, others are not. Legend for results is here.
ips	qps	rps	rmbps	wps	wmbps	rpq	rkbpq	wpi	wkbpi	csps	cpups	cspq	cpupq	dbgb1	dbgb2	rss	maxop	p50	p99	tag
1429775	0	8047	210.1	1742.0	178.4	0.006	0.150	0.001	0.128	40258	30.2	0.028	17	772.0	773.3	207.1	0.003	NA	NA	12000m.fbmy5635_202203072101.cy9c5_u
1382182	0	7345	203.6	1689.0	167.8	0.005	0.151	0.001	0.124	41303	30.0	0.030	17	771.8	773.2	208.7	0.003	NA	NA	12000m.fbmy5635_202304122154.cy9c5_u
1401062	0	6476	204.1	1712.0	167.8	0.005	0.149	0.001	0.123	42201	30.1	0.030	17	771.8	773.2	208.7	0.002	NA	NA	12000m.fbmy5635_202305292102.cy9c5_u
1411942	0	5575	210.5	1723.8	171.5	0.004	0.153	0.001	0.124	42357	30.3	0.030	17	771.7	773.1	208.7	0.002	NA	NA	12000m.fbmy5635_jun23_7e40af67.cy9c5_u
l.i1
l.i1: continue load after secondary indexes created. Graphs for performance per 1-second interval are here.
Average throughput:
Insert response time histogram: each cell has the percentage of responses that take <= the time in the header and max is the max response time in seconds. For the max column values in the top 25% of the range have a red background and in the bottom 25% of the range have a green background. The red background is not used when the min value is within 80% of the max value.
| dbms | 256us | 1ms | 4ms | 16ms | 64ms | 256ms | 1s | 4s | 16s | gt | max |
|---|---|---|---|---|---|---|---|---|---|---|---|
| fbmy5635_202203072101.cy9c5_u | 0.042 | 27.582 | 72.369 | 0.007 | 0.190 | ||||||
| fbmy5635_202304122154.cy9c5_u | 0.034 | 11.742 | 88.212 | 0.013 | 0.170 | ||||||
| fbmy5635_202305292102.cy9c5_u | 0.030 | 11.844 | 88.110 | 0.016 | 0.211 | ||||||
| fbmy5635_jun23_7e40af67.cy9c5_u | 0.040 | 11.682 | 88.263 | 0.014 | 0.227 |
Delete response time histogram: each cell has the percentage of responses that take <= the time in the header and max is the max response time in seconds. For the max column values in the top 25% of the range have a red background and in the bottom 25% of the range have a green background. The red background is not used when the min value is within 80% of the max value.
| dbms | 256us | 1ms | 4ms | 16ms | 64ms | 256ms | 1s | 4s | 16s | gt | max |
|---|---|---|---|---|---|---|---|---|---|---|---|
| fbmy5635_202203072101.cy9c5_u | 0.003 | 0.041 | 30.015 | 69.934 | 0.007 | nonzero | 0.361 | ||||
| fbmy5635_202304122154.cy9c5_u | nonzero | 0.034 | 11.486 | 88.466 | 0.013 | nonzero | 0.333 | ||||
| fbmy5635_202305292102.cy9c5_u | nonzero | 0.031 | 11.400 | 88.552 | 0.017 | 0.216 | |||||
| fbmy5635_jun23_7e40af67.cy9c5_u | nonzero | 0.041 | 11.400 | 88.543 | 0.016 | nonzero | 0.303 |
Performance metrics for the DBMS listed above. Some are normalized by throughput, others are not. Legend for results is here.
ips	qps	rps	rmbps	wps	wmbps	rpq	rkbpq	wpi	wkbpi	csps	cpups	cspq	cpupq	dbgb1	dbgb2	rss	maxop	p50	p99	tag
67923	0	1069	22.1	2489.0	285.2	0.016	0.333	0.037	4.299	146646	17.6	2.159	207	838.1	838.4	180.3	0.190	2847	2498	12000m.fbmy5635_202203072101.cy9c5_u
57977	0	765	14.2	1679.7	190.1	0.013	0.251	0.029	3.358	116175	15.9	2.004	219	841.7	842.1	182.0	0.170	2448	1849	12000m.fbmy5635_202304122154.cy9c5_u
57837	0	788	14.5	1671.4	188.2	0.014	0.256	0.029	3.333	115501	16.2	1.997	224	845.5	845.9	181.9	0.211	2447	1848	12000m.fbmy5635_202305292102.cy9c5_u
57670	0	803	14.6	1666.0	187.5	0.014	0.259	0.029	3.329	115251	16.2	1.998	225	840.1	840.5	181.9	0.227	2447	1798	12000m.fbmy5635_jun23_7e40af67.cy9c5_u
q100.1
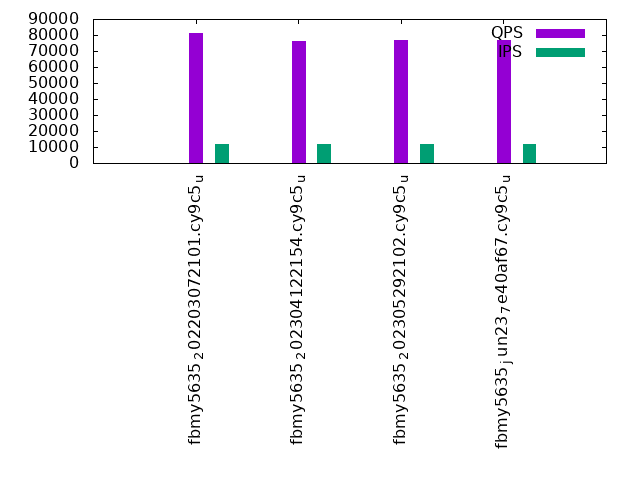
q100.1: range queries with 100 insert/s per client. Graphs for performance per 1-second interval are here.
Average throughput:
Query response time histogram: each cell has the percentage of responses that take <= the time in the header and max is the max response time in seconds. For max values in the top 25% of the range have a red background and in the bottom 25% of the range have a green background. The red background is not used when the min value is within 80% of the max value.
| dbms | 256us | 1ms | 4ms | 16ms | 64ms | 256ms | 1s | 4s | 16s | gt | max |
|---|---|---|---|---|---|---|---|---|---|---|---|
| fbmy5635_202203072101.cy9c5_u | 56.624 | 43.332 | 0.041 | 0.002 | nonzero | nonzero | 0.105 | ||||
| fbmy5635_202304122154.cy9c5_u | 49.211 | 50.731 | 0.049 | 0.007 | 0.002 | nonzero | 0.108 | ||||
| fbmy5635_202305292102.cy9c5_u | 49.749 | 50.207 | 0.035 | 0.005 | 0.003 | nonzero | 0.080 | ||||
| fbmy5635_jun23_7e40af67.cy9c5_u | 49.352 | 50.598 | 0.041 | 0.006 | 0.003 | nonzero | 0.087 |
Insert response time histogram: each cell has the percentage of responses that take <= the time in the header and max is the max response time in seconds. For max values in the top 25% of the range have a red background and in the bottom 25% of the range have a green background. The red background is not used when the min value is within 80% of the max value.
| dbms | 256us | 1ms | 4ms | 16ms | 64ms | 256ms | 1s | 4s | 16s | gt | max |
|---|---|---|---|---|---|---|---|---|---|---|---|
| fbmy5635_202203072101.cy9c5_u | 99.962 | 0.035 | 0.002 | 0.001 | 0.075 | ||||||
| fbmy5635_202304122154.cy9c5_u | 0.012 | 99.773 | 0.186 | 0.029 | 0.058 | ||||||
| fbmy5635_202305292102.cy9c5_u | 0.003 | 99.756 | 0.195 | 0.045 | nonzero | 0.069 | |||||
| fbmy5635_jun23_7e40af67.cy9c5_u | 0.006 | 99.690 | 0.249 | 0.055 | 0.001 | 0.077 |
Delete response time histogram: each cell has the percentage of responses that take <= the time in the header and max is the max response time in seconds. For max values in the top 25% of the range have a red background and in the bottom 25% of the range have a green background. The red background is not used when the min value is within 80% of the max value.
| dbms | 256us | 1ms | 4ms | 16ms | 64ms | 256ms | 1s | 4s | 16s | gt | max |
|---|---|---|---|---|---|---|---|---|---|---|---|
| fbmy5635_202203072101.cy9c5_u | 0.056 | 99.897 | 0.036 | 0.008 | 0.003 | 0.077 | |||||
| fbmy5635_202304122154.cy9c5_u | 0.001 | 99.759 | 0.198 | 0.041 | 0.001 | 0.075 | |||||
| fbmy5635_202305292102.cy9c5_u | 99.732 | 0.206 | 0.061 | 0.002 | 0.077 | ||||||
| fbmy5635_jun23_7e40af67.cy9c5_u | 99.681 | 0.252 | 0.066 | 0.002 | 0.077 |
Performance metrics for the DBMS listed above. Some are normalized by throughput, others are not. Legend for results is here.
ips	qps	rps	rmbps	wps	wmbps	rpq	rkbpq	wpi	wkbpi	csps	cpups	cspq	cpupq	dbgb1	dbgb2	rss	maxop	p50	p99	tag
2390	86676	1872	14.8	111.6	12.1	0.022	0.175	0.047	5.176	418343	31.4	4.827	290	834.9	836.8	183.4	0.105	3678	2765	12000m.fbmy5635_202203072101.cy9c5_u
2387	82914	1605	14.2	102.4	10.8	0.019	0.176	0.043	4.634	386786	31.4	4.665	303	841.0	841.0	184.3	0.108	3437	2398	12000m.fbmy5635_202304122154.cy9c5_u
2386	83496	1521	13.6	97.3	10.0	0.018	0.167	0.041	4.301	390160	31.3	4.673	300	840.4	840.5	184.0	0.080	3500	2350	12000m.fbmy5635_202305292102.cy9c5_u
2387	83102	1529	13.5	97.0	10.2	0.018	0.166	0.041	4.371	388137	31.4	4.671	302	839.8	839.9	184.1	0.087	3517	2349	12000m.fbmy5635_jun23_7e40af67.cy9c5_u
q500.1
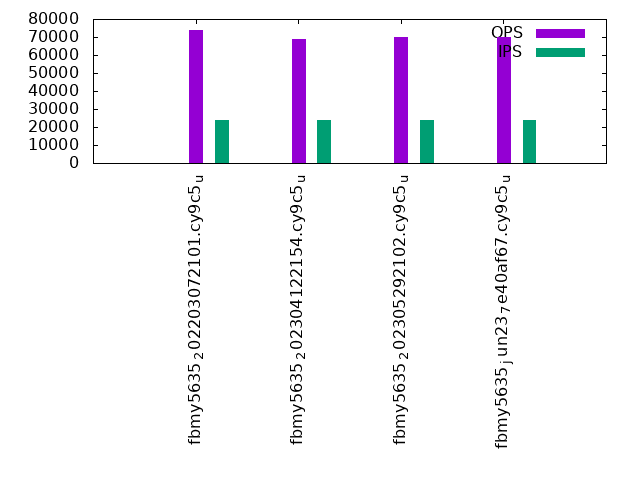
q500.1: range queries with 500 insert/s per client. Graphs for performance per 1-second interval are here.
Average throughput:
Query response time histogram: each cell has the percentage of responses that take <= the time in the header and max is the max response time in seconds. For max values in the top 25% of the range have a red background and in the bottom 25% of the range have a green background. The red background is not used when the min value is within 80% of the max value.
| dbms | 256us | 1ms | 4ms | 16ms | 64ms | 256ms | 1s | 4s | 16s | gt | max |
|---|---|---|---|---|---|---|---|---|---|---|---|
| fbmy5635_202203072101.cy9c5_u | 45.145 | 54.830 | 0.013 | 0.011 | nonzero | 0.043 | |||||
| fbmy5635_202304122154.cy9c5_u | 37.262 | 62.674 | 0.028 | 0.018 | 0.019 | 0.050 | |||||
| fbmy5635_202305292102.cy9c5_u | 38.561 | 61.376 | 0.025 | 0.015 | 0.024 | nonzero | 0.102 | ||||
| fbmy5635_jun23_7e40af67.cy9c5_u | 38.659 | 61.278 | 0.025 | 0.015 | 0.022 | nonzero | 0.081 |
Insert response time histogram: each cell has the percentage of responses that take <= the time in the header and max is the max response time in seconds. For max values in the top 25% of the range have a red background and in the bottom 25% of the range have a green background. The red background is not used when the min value is within 80% of the max value.
| dbms | 256us | 1ms | 4ms | 16ms | 64ms | 256ms | 1s | 4s | 16s | gt | max |
|---|---|---|---|---|---|---|---|---|---|---|---|
| fbmy5635_202203072101.cy9c5_u | 98.838 | 1.160 | 0.002 | 0.044 | |||||||
| fbmy5635_202304122154.cy9c5_u | 0.003 | 99.401 | 0.432 | 0.164 | 0.047 | ||||||
| fbmy5635_202305292102.cy9c5_u | 0.003 | 99.563 | 0.260 | 0.174 | nonzero | 0.068 | |||||
| fbmy5635_jun23_7e40af67.cy9c5_u | 0.001 | 99.480 | 0.334 | 0.185 | 0.039 |
Delete response time histogram: each cell has the percentage of responses that take <= the time in the header and max is the max response time in seconds. For max values in the top 25% of the range have a red background and in the bottom 25% of the range have a green background. The red background is not used when the min value is within 80% of the max value.
| dbms | 256us | 1ms | 4ms | 16ms | 64ms | 256ms | 1s | 4s | 16s | gt | max |
|---|---|---|---|---|---|---|---|---|---|---|---|
| fbmy5635_202203072101.cy9c5_u | 0.017 | 99.062 | 0.911 | 0.008 | 0.002 | 0.108 | |||||
| fbmy5635_202304122154.cy9c5_u | nonzero | 99.420 | 0.399 | 0.181 | 0.047 | ||||||
| fbmy5635_202305292102.cy9c5_u | 99.537 | 0.273 | 0.190 | nonzero | 0.068 | ||||||
| fbmy5635_jun23_7e40af67.cy9c5_u | 99.441 | 0.358 | 0.201 | 0.045 |
Performance metrics for the DBMS listed above. Some are normalized by throughput, others are not. Legend for results is here.
ips	qps	rps	rmbps	wps	wmbps	rpq	rkbpq	wpi	wkbpi	csps	cpups	cspq	cpupq	dbgb1	dbgb2	rss	maxop	p50	p99	tag
11947	81096	1316	9.4	490.2	55.3	0.016	0.119	0.041	4.736	415028	33.5	5.118	330	836.0	836.5	186.4	0.043	3405	2975	12000m.fbmy5635_202203072101.cy9c5_u
11935	76386	606	6.6	384.6	42.7	0.008	0.088	0.032	3.665	371726	33.3	4.866	349	846.5	847.0	186.4	0.050	3180	2302	12000m.fbmy5635_202304122154.cy9c5_u
11934	77048	587	7.5	394.0	43.3	0.008	0.099	0.033	3.718	375415	33.3	4.872	346	842.3	842.8	186.7	0.102	3212	2317	12000m.fbmy5635_202305292102.cy9c5_u
11935	76926	624	7.4	394.4	43.6	0.008	0.099	0.033	3.736	373978	33.4	4.862	347	843.5	844.1	186.4	0.081	3261	2382	12000m.fbmy5635_jun23_7e40af67.cy9c5_u
q1000.1
q1000.1: range queries with 1000 insert/s per client. Graphs for performance per 1-second interval are here.
Average throughput:
Query response time histogram: each cell has the percentage of responses that take <= the time in the header and max is the max response time in seconds. For max values in the top 25% of the range have a red background and in the bottom 25% of the range have a green background. The red background is not used when the min value is within 80% of the max value.
| dbms | 256us | 1ms | 4ms | 16ms | 64ms | 256ms | 1s | 4s | 16s | gt | max |
|---|---|---|---|---|---|---|---|---|---|---|---|
| fbmy5635_202203072101.cy9c5_u | 30.256 | 69.675 | 0.044 | 0.025 | nonzero | nonzero | 0.065 | ||||
| fbmy5635_202304122154.cy9c5_u | 22.618 | 77.294 | 0.035 | 0.020 | 0.032 | nonzero | 0.152 | ||||
| fbmy5635_202305292102.cy9c5_u | 24.733 | 75.189 | 0.028 | 0.020 | 0.031 | nonzero | 0.098 | ||||
| fbmy5635_jun23_7e40af67.cy9c5_u | 23.949 | 75.972 | 0.029 | 0.019 | 0.032 | nonzero | 0.091 |
Insert response time histogram: each cell has the percentage of responses that take <= the time in the header and max is the max response time in seconds. For max values in the top 25% of the range have a red background and in the bottom 25% of the range have a green background. The red background is not used when the min value is within 80% of the max value.
| dbms | 256us | 1ms | 4ms | 16ms | 64ms | 256ms | 1s | 4s | 16s | gt | max |
|---|---|---|---|---|---|---|---|---|---|---|---|
| fbmy5635_202203072101.cy9c5_u | 10.961 | 32.717 | 56.322 | 0.063 | |||||||
| fbmy5635_202304122154.cy9c5_u | 13.135 | 42.468 | 44.370 | 0.027 | 0.092 | ||||||
| fbmy5635_202305292102.cy9c5_u | 18.475 | 79.973 | 1.538 | 0.015 | 0.097 | ||||||
| fbmy5635_jun23_7e40af67.cy9c5_u | 11.270 | 85.194 | 3.526 | 0.010 | 0.115 |
Delete response time histogram: each cell has the percentage of responses that take <= the time in the header and max is the max response time in seconds. For max values in the top 25% of the range have a red background and in the bottom 25% of the range have a green background. The red background is not used when the min value is within 80% of the max value.
| dbms | 256us | 1ms | 4ms | 16ms | 64ms | 256ms | 1s | 4s | 16s | gt | max |
|---|---|---|---|---|---|---|---|---|---|---|---|
| fbmy5635_202203072101.cy9c5_u | nonzero | 11.167 | 33.503 | 55.329 | 0.001 | 0.111 | |||||
| fbmy5635_202304122154.cy9c5_u | 13.137 | 41.727 | 45.108 | 0.028 | 0.123 | ||||||
| fbmy5635_202305292102.cy9c5_u | 17.942 | 80.417 | 1.626 | 0.016 | 0.097 | ||||||
| fbmy5635_jun23_7e40af67.cy9c5_u | 10.742 | 85.563 | 3.685 | 0.010 | 0.115 |
Performance metrics for the DBMS listed above. Some are normalized by throughput, others are not. Legend for results is here.
ips	qps	rps	rmbps	wps	wmbps	rpq	rkbpq	wpi	wkbpi	csps	cpups	cspq	cpupq	dbgb1	dbgb2	rss	maxop	p50	p99	tag
23910	73796	2434	19.3	980.5	111.9	0.033	0.268	0.041	4.794	420788	37.3	5.702	404	835.9	837.3	188.3	0.065	3037	2605	12000m.fbmy5635_202203072101.cy9c5_u
23871	68814	1219	14.6	821.6	92.4	0.018	0.218	0.034	3.965	365873	37.4	5.317	435	846.0	847.5	187.9	0.152	2829	1902	12000m.fbmy5635_202304122154.cy9c5_u
23867	69935	1032	12.6	791.9	88.6	0.015	0.184	0.033	3.800	369884	37.0	5.289	423	849.9	851.5	188.2	0.098	2893	1918	12000m.fbmy5635_202305292102.cy9c5_u
23867	69760	1031	13.0	804.1	89.7	0.015	0.191	0.034	3.850	368995	37.2	5.289	427	849.6	851.1	188.3	0.091	2925	1950	12000m.fbmy5635_jun23_7e40af67.cy9c5_u
l.i0
l.i0: load without secondary indexes
Performance metrics for all DBMS, not just the ones listed above. Some are normalized by throughput, others are not. Legend for results is here.
ips	qps	rps	rmbps	wps	wmbps	rpq	rkbpq	wpi	wkbpi	csps	cpups	cspq	cpupq	dbgb1	dbgb2	rss	maxop	p50	p99	tag
634316	0	11	0.2	3278.2	361.0	0.000	0.000	0.005	0.583	487544	42.2	0.769	53	376.5	377.8	167.6	0.372	26573	17782	12000m.fbmy5635_202203072101.cy9c5_u
632411	0	40	0.4	2129.2	231.3	0.000	0.001	0.003	0.375	255535	35.8	0.404	45	376.3	377.7	98.4	0.225	26773	20879	12000m.fbmy5635_202304122154.cy9c5_u
633513	0	42	0.5	2138.1	233.5	0.000	0.001	0.003	0.377	280518	36.8	0.443	46	376.3	377.7	98.7	0.237	26773	21279	12000m.fbmy5635_202305292102.cy9c5_u
631114	0	37	0.4	2132.0	232.6	0.000	0.001	0.003	0.377	285589	36.8	0.453	47	376.2	377.6	98.7	0.229	26773	20482	12000m.fbmy5635_jun23_7e40af67.cy9c5_u
l.x
l.x: create secondary indexes
Performance metrics for all DBMS, not just the ones listed above. Some are normalized by throughput, others are not. Legend for results is here.
ips	qps	rps	rmbps	wps	wmbps	rpq	rkbpq	wpi	wkbpi	csps	cpups	cspq	cpupq	dbgb1	dbgb2	rss	maxop	p50	p99	tag
1429775	0	8047	210.1	1742.0	178.4	0.006	0.150	0.001	0.128	40258	30.2	0.028	17	772.0	773.3	207.1	0.003	NA	NA	12000m.fbmy5635_202203072101.cy9c5_u
1382182	0	7345	203.6	1689.0	167.8	0.005	0.151	0.001	0.124	41303	30.0	0.030	17	771.8	773.2	208.7	0.003	NA	NA	12000m.fbmy5635_202304122154.cy9c5_u
1401062	0	6476	204.1	1712.0	167.8	0.005	0.149	0.001	0.123	42201	30.1	0.030	17	771.8	773.2	208.7	0.002	NA	NA	12000m.fbmy5635_202305292102.cy9c5_u
1411942	0	5575	210.5	1723.8	171.5	0.004	0.153	0.001	0.124	42357	30.3	0.030	17	771.7	773.1	208.7	0.002	NA	NA	12000m.fbmy5635_jun23_7e40af67.cy9c5_u
l.i1
l.i1: continue load after secondary indexes created
Performance metrics for all DBMS, not just the ones listed above. Some are normalized by throughput, others are not. Legend for results is here.
ips	qps	rps	rmbps	wps	wmbps	rpq	rkbpq	wpi	wkbpi	csps	cpups	cspq	cpupq	dbgb1	dbgb2	rss	maxop	p50	p99	tag
67923	0	1069	22.1	2489.0	285.2	0.016	0.333	0.037	4.299	146646	17.6	2.159	207	838.1	838.4	180.3	0.190	2847	2498	12000m.fbmy5635_202203072101.cy9c5_u
57977	0	765	14.2	1679.7	190.1	0.013	0.251	0.029	3.358	116175	15.9	2.004	219	841.7	842.1	182.0	0.170	2448	1849	12000m.fbmy5635_202304122154.cy9c5_u
57837	0	788	14.5	1671.4	188.2	0.014	0.256	0.029	3.333	115501	16.2	1.997	224	845.5	845.9	181.9	0.211	2447	1848	12000m.fbmy5635_202305292102.cy9c5_u
57670	0	803	14.6	1666.0	187.5	0.014	0.259	0.029	3.329	115251	16.2	1.998	225	840.1	840.5	181.9	0.227	2447	1798	12000m.fbmy5635_jun23_7e40af67.cy9c5_u
q100.1
q100.1: range queries with 100 insert/s per client
Performance metrics for all DBMS, not just the ones listed above. Some are normalized by throughput, others are not. Legend for results is here.
ips	qps	rps	rmbps	wps	wmbps	rpq	rkbpq	wpi	wkbpi	csps	cpups	cspq	cpupq	dbgb1	dbgb2	rss	maxop	p50	p99	tag
2390	86676	1872	14.8	111.6	12.1	0.022	0.175	0.047	5.176	418343	31.4	4.827	290	834.9	836.8	183.4	0.105	3678	2765	12000m.fbmy5635_202203072101.cy9c5_u
2387	82914	1605	14.2	102.4	10.8	0.019	0.176	0.043	4.634	386786	31.4	4.665	303	841.0	841.0	184.3	0.108	3437	2398	12000m.fbmy5635_202304122154.cy9c5_u
2386	83496	1521	13.6	97.3	10.0	0.018	0.167	0.041	4.301	390160	31.3	4.673	300	840.4	840.5	184.0	0.080	3500	2350	12000m.fbmy5635_202305292102.cy9c5_u
2387	83102	1529	13.5	97.0	10.2	0.018	0.166	0.041	4.371	388137	31.4	4.671	302	839.8	839.9	184.1	0.087	3517	2349	12000m.fbmy5635_jun23_7e40af67.cy9c5_u
q500.1
q500.1: range queries with 500 insert/s per client
Performance metrics for all DBMS, not just the ones listed above. Some are normalized by throughput, others are not. Legend for results is here.
ips	qps	rps	rmbps	wps	wmbps	rpq	rkbpq	wpi	wkbpi	csps	cpups	cspq	cpupq	dbgb1	dbgb2	rss	maxop	p50	p99	tag
11947	81096	1316	9.4	490.2	55.3	0.016	0.119	0.041	4.736	415028	33.5	5.118	330	836.0	836.5	186.4	0.043	3405	2975	12000m.fbmy5635_202203072101.cy9c5_u
11935	76386	606	6.6	384.6	42.7	0.008	0.088	0.032	3.665	371726	33.3	4.866	349	846.5	847.0	186.4	0.050	3180	2302	12000m.fbmy5635_202304122154.cy9c5_u
11934	77048	587	7.5	394.0	43.3	0.008	0.099	0.033	3.718	375415	33.3	4.872	346	842.3	842.8	186.7	0.102	3212	2317	12000m.fbmy5635_202305292102.cy9c5_u
11935	76926	624	7.4	394.4	43.6	0.008	0.099	0.033	3.736	373978	33.4	4.862	347	843.5	844.1	186.4	0.081	3261	2382	12000m.fbmy5635_jun23_7e40af67.cy9c5_u
q1000.1
q1000.1: range queries with 1000 insert/s per client
Performance metrics for all DBMS, not just the ones listed above. Some are normalized by throughput, others are not. Legend for results is here.
ips	qps	rps	rmbps	wps	wmbps	rpq	rkbpq	wpi	wkbpi	csps	cpups	cspq	cpupq	dbgb1	dbgb2	rss	maxop	p50	p99	tag
23910	73796	2434	19.3	980.5	111.9	0.033	0.268	0.041	4.794	420788	37.3	5.702	404	835.9	837.3	188.3	0.065	3037	2605	12000m.fbmy5635_202203072101.cy9c5_u
23871	68814	1219	14.6	821.6	92.4	0.018	0.218	0.034	3.965	365873	37.4	5.317	435	846.0	847.5	187.9	0.152	2829	1902	12000m.fbmy5635_202304122154.cy9c5_u
23867	69935	1032	12.6	791.9	88.6	0.015	0.184	0.033	3.800	369884	37.0	5.289	423	849.9	851.5	188.2	0.098	2893	1918	12000m.fbmy5635_202305292102.cy9c5_u
23867	69760	1031	13.0	804.1	89.7	0.015	0.191	0.034	3.850	368995	37.2	5.289	427	849.6	851.1	188.3	0.091	2925	1950	12000m.fbmy5635_jun23_7e40af67.cy9c5_u
l.i0
- l.i0: load without secondary indexes
- Legend for results is here.
- Each entry lists the percentage of responses that fit in that bucket (slower than max time for previous bucket, faster than min time for next bucket).
Insert response time histogram
256us	1ms	4ms	16ms	64ms	256ms	1s	4s	16s	gt	max	tag
0.000	0.013	75.039	24.904	0.003	0.041	nonzero	0.000	0.000	0.000	0.372	fbmy5635_202203072101.cy9c5_u
0.000	0.008	74.799	25.149	0.003	0.041	0.000	0.000	0.000	0.000	0.225	fbmy5635_202304122154.cy9c5_u
0.000	0.007	75.443	24.506	0.004	0.040	0.000	0.000	0.000	0.000	0.237	fbmy5635_202305292102.cy9c5_u
0.000	0.006	74.843	25.106	0.003	0.042	0.000	0.000	0.000	0.000	0.229	fbmy5635_jun23_7e40af67.cy9c5_u
l.x
- l.x: create secondary indexes
- Legend for results is here.
- Each entry lists the percentage of responses that fit in that bucket (slower than max time for previous bucket, faster than min time for next bucket).
TODO - determine whether there is data for create index response time
l.i1
- l.i1: continue load after secondary indexes created
- Legend for results is here.
- Each entry lists the percentage of responses that fit in that bucket (slower than max time for previous bucket, faster than min time for next bucket).
Insert response time histogram
256us	1ms	4ms	16ms	64ms	256ms	1s	4s	16s	gt	max	tag
0.000	0.000	0.042	27.582	72.369	0.007	0.000	0.000	0.000	0.000	0.190	fbmy5635_202203072101.cy9c5_u
0.000	0.000	0.034	11.742	88.212	0.013	0.000	0.000	0.000	0.000	0.170	fbmy5635_202304122154.cy9c5_u
0.000	0.000	0.030	11.844	88.110	0.016	0.000	0.000	0.000	0.000	0.211	fbmy5635_202305292102.cy9c5_u
0.000	0.000	0.040	11.682	88.263	0.014	0.000	0.000	0.000	0.000	0.227	fbmy5635_jun23_7e40af67.cy9c5_u
Delete response time histogram
256us	1ms	4ms	16ms	64ms	256ms	1s	4s	16s	gt	max	tag
0.000	0.003	0.041	30.015	69.934	0.007	nonzero	0.000	0.000	0.000	0.361	fbmy5635_202203072101.cy9c5_u
0.000	nonzero	0.034	11.486	88.466	0.013	nonzero	0.000	0.000	0.000	0.333	fbmy5635_202304122154.cy9c5_u
0.000	nonzero	0.031	11.400	88.552	0.017	0.000	0.000	0.000	0.000	0.216	fbmy5635_202305292102.cy9c5_u
0.000	nonzero	0.041	11.400	88.543	0.016	nonzero	0.000	0.000	0.000	0.303	fbmy5635_jun23_7e40af67.cy9c5_u
q100.1
- q100.1: range queries with 100 insert/s per client
- Legend for results is here.
- Each entry lists the percentage of responses that fit in that bucket (slower than max time for previous bucket, faster than min time for next bucket).
Query response time histogram
256us	1ms	4ms	16ms	64ms	256ms	1s	4s	16s	gt	max	tag
56.624	43.332	0.041	0.002	nonzero	nonzero	0.000	0.000	0.000	0.000	0.105	fbmy5635_202203072101.cy9c5_u
49.211	50.731	0.049	0.007	0.002	nonzero	0.000	0.000	0.000	0.000	0.108	fbmy5635_202304122154.cy9c5_u
49.749	50.207	0.035	0.005	0.003	nonzero	0.000	0.000	0.000	0.000	0.080	fbmy5635_202305292102.cy9c5_u
49.352	50.598	0.041	0.006	0.003	nonzero	0.000	0.000	0.000	0.000	0.087	fbmy5635_jun23_7e40af67.cy9c5_u
Insert response time histogram
256us	1ms	4ms	16ms	64ms	256ms	1s	4s	16s	gt	max	tag
0.000	0.000	99.962	0.035	0.002	0.001	0.000	0.000	0.000	0.000	0.075	fbmy5635_202203072101.cy9c5_u
0.000	0.012	99.773	0.186	0.029	0.000	0.000	0.000	0.000	0.000	0.058	fbmy5635_202304122154.cy9c5_u
0.000	0.003	99.756	0.195	0.045	nonzero	0.000	0.000	0.000	0.000	0.069	fbmy5635_202305292102.cy9c5_u
0.000	0.006	99.690	0.249	0.055	0.001	0.000	0.000	0.000	0.000	0.077	fbmy5635_jun23_7e40af67.cy9c5_u
Delete response time histogram
256us	1ms	4ms	16ms	64ms	256ms	1s	4s	16s	gt	max	tag
0.000	0.056	99.897	0.036	0.008	0.003	0.000	0.000	0.000	0.000	0.077	fbmy5635_202203072101.cy9c5_u
0.000	0.001	99.759	0.198	0.041	0.001	0.000	0.000	0.000	0.000	0.075	fbmy5635_202304122154.cy9c5_u
0.000	0.000	99.732	0.206	0.061	0.002	0.000	0.000	0.000	0.000	0.077	fbmy5635_202305292102.cy9c5_u
0.000	0.000	99.681	0.252	0.066	0.002	0.000	0.000	0.000	0.000	0.077	fbmy5635_jun23_7e40af67.cy9c5_u
q500.1
- q500.1: range queries with 500 insert/s per client
- Legend for results is here.
- Each entry lists the percentage of responses that fit in that bucket (slower than max time for previous bucket, faster than min time for next bucket).
Query response time histogram
256us	1ms	4ms	16ms	64ms	256ms	1s	4s	16s	gt	max	tag
45.145	54.830	0.013	0.011	nonzero	0.000	0.000	0.000	0.000	0.000	0.043	fbmy5635_202203072101.cy9c5_u
37.262	62.674	0.028	0.018	0.019	0.000	0.000	0.000	0.000	0.000	0.050	fbmy5635_202304122154.cy9c5_u
38.561	61.376	0.025	0.015	0.024	nonzero	0.000	0.000	0.000	0.000	0.102	fbmy5635_202305292102.cy9c5_u
38.659	61.278	0.025	0.015	0.022	nonzero	0.000	0.000	0.000	0.000	0.081	fbmy5635_jun23_7e40af67.cy9c5_u
Insert response time histogram
256us	1ms	4ms	16ms	64ms	256ms	1s	4s	16s	gt	max	tag
0.000	0.000	98.838	1.160	0.002	0.000	0.000	0.000	0.000	0.000	0.044	fbmy5635_202203072101.cy9c5_u
0.000	0.003	99.401	0.432	0.164	0.000	0.000	0.000	0.000	0.000	0.047	fbmy5635_202304122154.cy9c5_u
0.000	0.003	99.563	0.260	0.174	nonzero	0.000	0.000	0.000	0.000	0.068	fbmy5635_202305292102.cy9c5_u
0.000	0.001	99.480	0.334	0.185	0.000	0.000	0.000	0.000	0.000	0.039	fbmy5635_jun23_7e40af67.cy9c5_u
Delete response time histogram
256us	1ms	4ms	16ms	64ms	256ms	1s	4s	16s	gt	max	tag
0.000	0.017	99.062	0.911	0.008	0.002	0.000	0.000	0.000	0.000	0.108	fbmy5635_202203072101.cy9c5_u
0.000	nonzero	99.420	0.399	0.181	0.000	0.000	0.000	0.000	0.000	0.047	fbmy5635_202304122154.cy9c5_u
0.000	0.000	99.537	0.273	0.190	nonzero	0.000	0.000	0.000	0.000	0.068	fbmy5635_202305292102.cy9c5_u
0.000	0.000	99.441	0.358	0.201	0.000	0.000	0.000	0.000	0.000	0.045	fbmy5635_jun23_7e40af67.cy9c5_u
q1000.1
- q1000.1: range queries with 1000 insert/s per client
- Legend for results is here.
- Each entry lists the percentage of responses that fit in that bucket (slower than max time for previous bucket, faster than min time for next bucket).
Query response time histogram
256us	1ms	4ms	16ms	64ms	256ms	1s	4s	16s	gt	max	tag
30.256	69.675	0.044	0.025	nonzero	nonzero	0.000	0.000	0.000	0.000	0.065	fbmy5635_202203072101.cy9c5_u
22.618	77.294	0.035	0.020	0.032	nonzero	0.000	0.000	0.000	0.000	0.152	fbmy5635_202304122154.cy9c5_u
24.733	75.189	0.028	0.020	0.031	nonzero	0.000	0.000	0.000	0.000	0.098	fbmy5635_202305292102.cy9c5_u
23.949	75.972	0.029	0.019	0.032	nonzero	0.000	0.000	0.000	0.000	0.091	fbmy5635_jun23_7e40af67.cy9c5_u
Insert response time histogram
256us	1ms	4ms	16ms	64ms	256ms	1s	4s	16s	gt	max	tag
0.000	0.000	10.961	32.717	56.322	0.000	0.000	0.000	0.000	0.000	0.063	fbmy5635_202203072101.cy9c5_u
0.000	0.000	13.135	42.468	44.370	0.027	0.000	0.000	0.000	0.000	0.092	fbmy5635_202304122154.cy9c5_u
0.000	0.000	18.475	79.973	1.538	0.015	0.000	0.000	0.000	0.000	0.097	fbmy5635_202305292102.cy9c5_u
0.000	0.000	11.270	85.194	3.526	0.010	0.000	0.000	0.000	0.000	0.115	fbmy5635_jun23_7e40af67.cy9c5_u
Delete response time histogram
256us	1ms	4ms	16ms	64ms	256ms	1s	4s	16s	gt	max	tag
0.000	nonzero	11.167	33.503	55.329	0.001	0.000	0.000	0.000	0.000	0.111	fbmy5635_202203072101.cy9c5_u
0.000	0.000	13.137	41.727	45.108	0.028	0.000	0.000	0.000	0.000	0.123	fbmy5635_202304122154.cy9c5_u
0.000	0.000	17.942	80.417	1.626	0.016	0.000	0.000	0.000	0.000	0.097	fbmy5635_202305292102.cy9c5_u
0.000	0.000	10.742	85.563	3.685	0.010	0.000	0.000	0.000	0.000	0.115	fbmy5635_jun23_7e40af67.cy9c5_u