Introduction
This is a report for the insert benchmark with 4000M docs and 8 client(s). It is generated by scripts (bash, awk, sed) and Tufte might not be impressed. An overview of the insert benchmark is here and a short update is here. Below, by DBMS, I mean DBMS+version.config. An example is my8020.c10b40 where my means MySQL, 8020 is version 8.0.20 and c10b40 is the name for the configuration file.
The test server is a c2-standard-30 from GCP with 15 cores, hyperthreads disabled, 120G RAM, XFS + SW RAID 0 on 4 NVMe devices (1.5TB). The benchmark was run with 8 client and there were 1 or 3 connections per client (1 for queries or inserts without rate limits, 1+1 for rate limited inserts+deletes). There are 8 tables, client per table. It loads 4000M rows without secondary indexes, creates secondary indexes, then inserts 80M rows with a delete per insert to avoid growing the table. It then does 3 read+write tests for 1800s each that do queries as fast as possible with 100, 500 and then 1000 inserts/second/client concurrent with the queries and 1000 deletes/second to avoid growing the table. The database is larger than memory.
The tested DBMS are:
- my5651_rel.cy10a_gcp_c2s30 - InnoDB and MySQL 5.6.51, rel build, cy10a_gcp_c2s30 config, compiled with CMAKE_BUILD_TYPE=Release -O2, base config
- my5740_rel_lto.cy10a_gcp_c2s30 - InnoDB and MySQL 5.7.40, rel_lto build, cy10a_gcp_c2s30 config, compiled with CMAKE_BUILD_TYPE=Release -O2, base config
- my8033_rel_lto.cy10a_gcp_c2s30 - InnoDB and MySQL 8.0.33, rel_lto build, cy10a_gcp_c2s30 config, compiled with CMAKE_BUILD_TYPE=Release -O2, base config
Contents
- Summary
- l.i0: load without secondary indexes
- l.x: create secondary indexes
- l.i1: continue load after secondary indexes created
- q100.1: range queries with 100 insert/s per client
- q500.1: range queries with 500 insert/s per client
- q1000.1: range queries with 1000 insert/s per client
Summary
The numbers are inserts/s for l.i0 and l.i1, indexed docs (or rows) /s for l.x and queries/s for q*.2. The values are the average rate over the entire test for inserts (IPS) and queries (QPS). The range of values for IPS and QPS is split into 3 parts: bottom 25%, middle 50%, top 25%. Values in the bottom 25% have a red background, values in the top 25% have a green background and values in the middle have no color. A gray background is used for values that can be ignored because the DBMS did not sustain the target insert rate. Red backgrounds are not used when the minimum value is within 80% of the max value.
| dbms | l.i0 | l.x | l.i1 | q100.1 | q500.1 | q1000.1 |
|---|---|---|---|---|---|---|
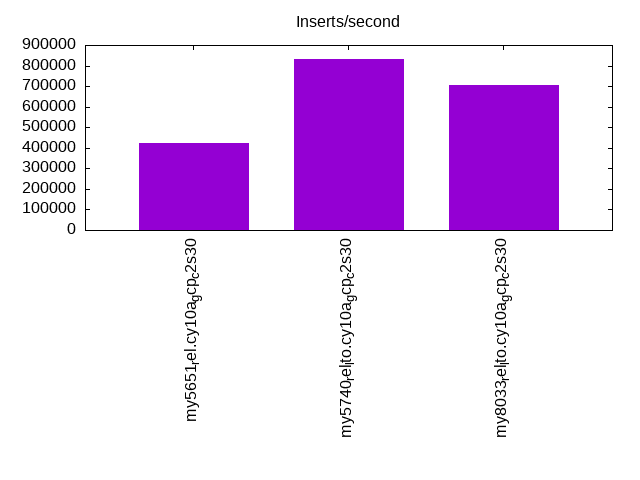
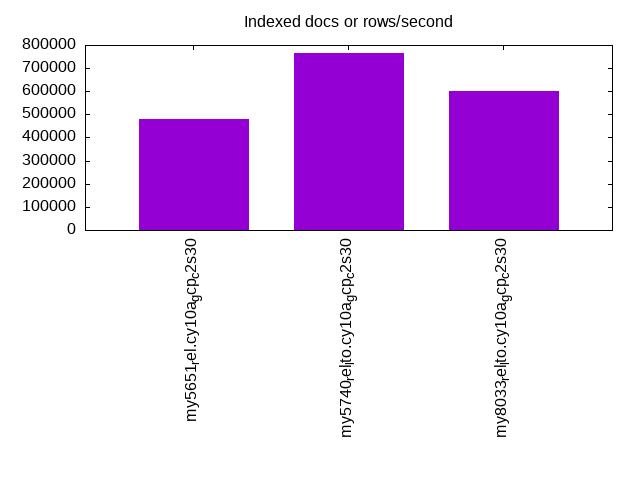
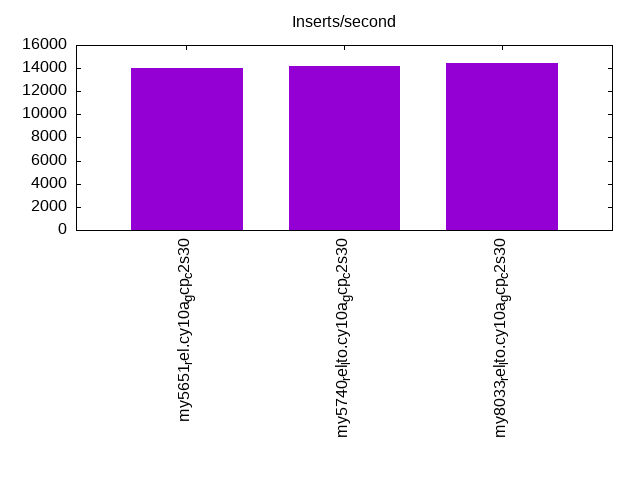
| my5651_rel.cy10a_gcp_c2s30 | 424133 | 478195 | 14035 | 3183 | 3513 | 3362 |
| my5740_rel_lto.cy10a_gcp_c2s30 | 833854 | 764253 | 14167 | 3835 | 4268 | 4019 |
| my8033_rel_lto.cy10a_gcp_c2s30 | 706964 | 603060 | 14409 | 3665 | 4303 | 4103 |
This table has relative throughput, throughput for the DBMS relative to the DBMS in the first line, using the absolute throughput from the previous table. Values less than 0.95 have a yellow background. Values greater than 1.05 have a blue background.
| dbms | l.i0 | l.x | l.i1 | q100.1 | q500.1 | q1000.1 |
|---|---|---|---|---|---|---|
| my5651_rel.cy10a_gcp_c2s30 | 1.00 | 1.00 | 1.00 | 1.00 | 1.00 | 1.00 |
| my5740_rel_lto.cy10a_gcp_c2s30 | 1.97 | 1.60 | 1.01 | 1.20 | 1.21 | 1.20 |
| my8033_rel_lto.cy10a_gcp_c2s30 | 1.67 | 1.26 | 1.03 | 1.15 | 1.22 | 1.22 |
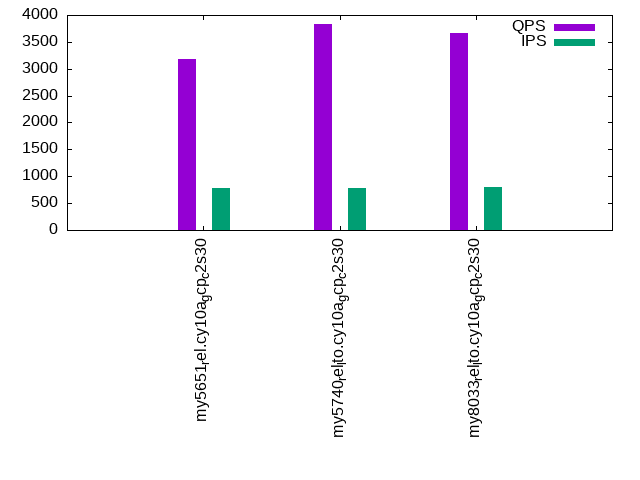
This lists the average rate of inserts/s for the tests that do inserts concurrent with queries. For such tests the query rate is listed in the table above. The read+write tests are setup so that the insert rate should match the target rate every second. Cells that are not at least 95% of the target have a red background to indicate a failure to satisfy the target.
| dbms | q100.1 | q500.1 | q1000.1 |
|---|---|---|---|
| my5651_rel.cy10a_gcp_c2s30 | 789 | 3965 | 7930 |
| my5740_rel_lto.cy10a_gcp_c2s30 | 789 | 3969 | 7943 |
| my8033_rel_lto.cy10a_gcp_c2s30 | 792 | 3958 | 7908 |
| target | 800 | 4000 | 8000 |
l.i0
l.i0: load without secondary indexes. Graphs for performance per 1-second interval are here.
Average throughput:
Insert response time histogram: each cell has the percentage of responses that take <= the time in the header and max is the max response time in seconds. For the max column values in the top 25% of the range have a red background and in the bottom 25% of the range have a green background. The red background is not used when the min value is within 80% of the max value.
| dbms | 256us | 1ms | 4ms | 16ms | 64ms | 256ms | 1s | 4s | 16s | gt | max |
|---|---|---|---|---|---|---|---|---|---|---|---|
| my5651_rel.cy10a_gcp_c2s30 | 0.158 | 99.517 | 0.141 | 0.169 | 0.014 | nonzero | nonzero | nonzero | 5.979 | ||
| my5740_rel_lto.cy10a_gcp_c2s30 | 94.985 | 4.937 | 0.046 | 0.016 | 0.015 | 0.001 | nonzero | 1.626 | |||
| my8033_rel_lto.cy10a_gcp_c2s30 | 9.653 | 90.247 | 0.066 | 0.019 | 0.014 | 0.001 | 0.400 |
Performance metrics for the DBMS listed above. Some are normalized by throughput, others are not. Legend for results is here.
ips	qps	rps	rmbps	wps	wmbps	rpq	rkbpq	wpi	wkbpi	csps	cpups	cspq	cpupq	dbgb1	dbgb2	rss	maxop	p50	p99	tag
424133	0	3330	13.0	2021.6	119.1	0.008	0.031	0.005	0.287	89571	42.6	0.211	15	263.1	391.6	85.7	5.979	54141	13898	4000m.my5651_rel.cy10a_gcp_c2s30
833854	0	0	0.0	4013.5	233.9	0.000	0.000	0.005	0.287	85613	73.2	0.103	13	263.1	391.6	86.8	1.626	107384	82111	4000m.my5740_rel_lto.cy10a_gcp_c2s30
706964	0	0	0.0	3705.8	202.7	0.000	0.000	0.005	0.294	172612	76.8	0.244	16	262.1	390.7	86.9	0.400	90802	69625	4000m.my8033_rel_lto.cy10a_gcp_c2s30
l.x
l.x: create secondary indexes.
Average throughput:
Performance metrics for the DBMS listed above. Some are normalized by throughput, others are not. Legend for results is here.
ips	qps	rps	rmbps	wps	wmbps	rpq	rkbpq	wpi	wkbpi	csps	cpups	cspq	cpupq	dbgb1	dbgb2	rss	maxop	p50	p99	tag
478195	0	2714	349.3	5299.5	594.0	0.006	0.748	0.011	1.272	14859	33.0	0.031	10	542.2	670.7	85.7	0.002	NA	NA	4000m.my5651_rel.cy10a_gcp_c2s30
764253	0	4027	672.1	7717.6	864.1	0.005	0.900	0.010	1.158	27488	29.5	0.036	6	588.3	716.8	87.3	0.033	NA	NA	4000m.my5740_rel_lto.cy10a_gcp_c2s30
603060	0	7642	649.2	12691.7	773.2	0.013	1.102	0.021	1.313	55738	57.3	0.092	14	586.1	714.7	86.9	0.004	NA	NA	4000m.my8033_rel_lto.cy10a_gcp_c2s30
l.i1
l.i1: continue load after secondary indexes created. Graphs for performance per 1-second interval are here.
Average throughput:
Insert response time histogram: each cell has the percentage of responses that take <= the time in the header and max is the max response time in seconds. For the max column values in the top 25% of the range have a red background and in the bottom 25% of the range have a green background. The red background is not used when the min value is within 80% of the max value.
| dbms | 256us | 1ms | 4ms | 16ms | 64ms | 256ms | 1s | 4s | 16s | gt | max |
|---|---|---|---|---|---|---|---|---|---|---|---|
| my5651_rel.cy10a_gcp_c2s30 | 0.904 | 59.370 | 28.048 | 11.558 | 0.119 | 0.001 | nonzero | 4.794 | |||
| my5740_rel_lto.cy10a_gcp_c2s30 | 2.418 | 58.267 | 27.289 | 11.991 | 0.035 | 0.337 | |||||
| my8033_rel_lto.cy10a_gcp_c2s30 | 0.284 | 58.228 | 30.087 | 11.341 | 0.059 | 0.001 | 1.173 |
Delete response time histogram: each cell has the percentage of responses that take <= the time in the header and max is the max response time in seconds. For the max column values in the top 25% of the range have a red background and in the bottom 25% of the range have a green background. The red background is not used when the min value is within 80% of the max value.
| dbms | 256us | 1ms | 4ms | 16ms | 64ms | 256ms | 1s | 4s | 16s | gt | max |
|---|---|---|---|---|---|---|---|---|---|---|---|
| my5651_rel.cy10a_gcp_c2s30 | 6.144 | 81.264 | 12.463 | 0.127 | 0.001 | 0.001 | nonzero | 4.080 | |||
| my5740_rel_lto.cy10a_gcp_c2s30 | 29.605 | 66.350 | 3.903 | 0.143 | 0.179 | ||||||
| my8033_rel_lto.cy10a_gcp_c2s30 | 20.029 | 75.873 | 3.865 | 0.232 | nonzero | 0.328 |
Performance metrics for the DBMS listed above. Some are normalized by throughput, others are not. Legend for results is here.
ips	qps	rps	rmbps	wps	wmbps	rpq	rkbpq	wpi	wkbpi	csps	cpups	cspq	cpupq	dbgb1	dbgb2	rss	maxop	p50	p99	tag
14035	0	14160	215.8	26901.3	679.9	1.009	15.748	1.917	49.606	110393	23.9	7.866	255	812.6	979.6	85.7	4.794	849	250	4000m.my5651_rel.cy10a_gcp_c2s30
14167	0	15840	247.5	31321.4	730.8	1.118	17.889	2.211	52.821	129654	28.2	9.152	299	812.3	979.0	87.1	0.337	749	250	4000m.my5740_rel_lto.cy10a_gcp_c2s30
14409	0	17044	266.3	34543.3	775.6	1.183	18.926	2.397	55.118	175995	37.2	12.214	387	809.0	975.5	86.9	1.173	999	250	4000m.my8033_rel_lto.cy10a_gcp_c2s30
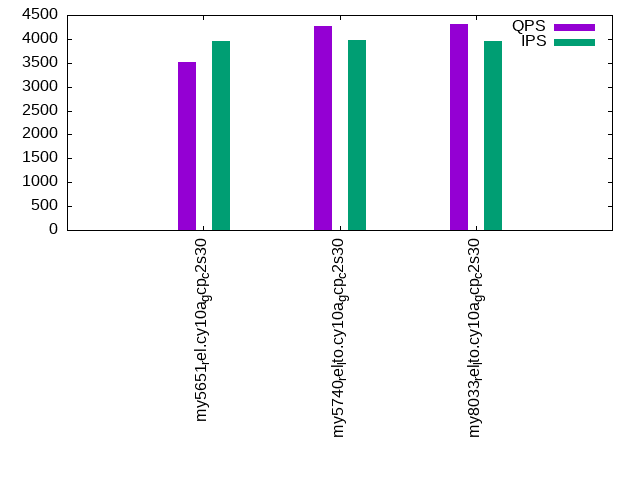
q100.1
q100.1: range queries with 100 insert/s per client. Graphs for performance per 1-second interval are here.
Average throughput:
Query response time histogram: each cell has the percentage of responses that take <= the time in the header and max is the max response time in seconds. For max values in the top 25% of the range have a red background and in the bottom 25% of the range have a green background. The red background is not used when the min value is within 80% of the max value.
| dbms | 256us | 1ms | 4ms | 16ms | 64ms | 256ms | 1s | 4s | 16s | gt | max |
|---|---|---|---|---|---|---|---|---|---|---|---|
| my5651_rel.cy10a_gcp_c2s30 | 37.880 | 3.009 | 35.165 | 23.892 | 0.053 | nonzero | 0.082 | ||||
| my5740_rel_lto.cy10a_gcp_c2s30 | 38.995 | 2.272 | 46.436 | 12.267 | 0.030 | nonzero | 0.074 | ||||
| my8033_rel_lto.cy10a_gcp_c2s30 | 33.094 | 6.511 | 48.426 | 11.633 | 0.331 | 0.006 | nonzero | 0.256 |
Insert response time histogram: each cell has the percentage of responses that take <= the time in the header and max is the max response time in seconds. For max values in the top 25% of the range have a red background and in the bottom 25% of the range have a green background. The red background is not used when the min value is within 80% of the max value.
| dbms | 256us | 1ms | 4ms | 16ms | 64ms | 256ms | 1s | 4s | 16s | gt | max |
|---|---|---|---|---|---|---|---|---|---|---|---|
| my5651_rel.cy10a_gcp_c2s30 | 18.715 | 74.146 | 7.139 | 0.058 | |||||||
| my5740_rel_lto.cy10a_gcp_c2s30 | 27.243 | 71.983 | 0.771 | 0.003 | 0.072 | ||||||
| my8033_rel_lto.cy10a_gcp_c2s30 | 9.101 | 83.910 | 6.306 | 0.670 | 0.014 | 0.419 |
Delete response time histogram: each cell has the percentage of responses that take <= the time in the header and max is the max response time in seconds. For max values in the top 25% of the range have a red background and in the bottom 25% of the range have a green background. The red background is not used when the min value is within 80% of the max value.
| dbms | 256us | 1ms | 4ms | 16ms | 64ms | 256ms | 1s | 4s | 16s | gt | max |
|---|---|---|---|---|---|---|---|---|---|---|---|
| my5651_rel.cy10a_gcp_c2s30 | 20.562 | 72.771 | 6.667 | 0.054 | |||||||
| my5740_rel_lto.cy10a_gcp_c2s30 | 37.878 | 61.493 | 0.625 | 0.003 | 0.072 | ||||||
| my8033_rel_lto.cy10a_gcp_c2s30 | 17.757 | 76.295 | 5.337 | 0.594 | 0.017 | 0.419 |
Performance metrics for the DBMS listed above. Some are normalized by throughput, others are not. Legend for results is here.
ips	qps	rps	rmbps	wps	wmbps	rpq	rkbpq	wpi	wkbpi	csps	cpups	cspq	cpupq	dbgb1	dbgb2	rss	maxop	p50	p99	tag
789	3183	24350	380.1	20926.0	432.5	7.650	122.296	26.522	561.291	106329	17.7	33.406	834	812.6	979.6	85.7	0.082	416	208	4000m.my5651_rel.cy10a_gcp_c2s30
789	3835	30976	484.0	22554.2	551.0	8.076	129.221	28.571	714.715	130370	20.0	33.991	782	812.3	979.0	87.0	0.074	511	224	4000m.my5740_rel_lto.cy10a_gcp_c2s30
792	3665	30582	477.8	24325.8	544.8	8.343	133.495	30.714	704.402	158387	24.1	43.211	986	809.0	975.5	86.9	0.256	495	112	4000m.my8033_rel_lto.cy10a_gcp_c2s30
q500.1
q500.1: range queries with 500 insert/s per client. Graphs for performance per 1-second interval are here.
Average throughput:
Query response time histogram: each cell has the percentage of responses that take <= the time in the header and max is the max response time in seconds. For max values in the top 25% of the range have a red background and in the bottom 25% of the range have a green background. The red background is not used when the min value is within 80% of the max value.
| dbms | 256us | 1ms | 4ms | 16ms | 64ms | 256ms | 1s | 4s | 16s | gt | max |
|---|---|---|---|---|---|---|---|---|---|---|---|
| my5651_rel.cy10a_gcp_c2s30 | 38.305 | 3.475 | 38.797 | 19.398 | 0.024 | nonzero | 0.079 | ||||
| my5740_rel_lto.cy10a_gcp_c2s30 | 39.177 | 2.650 | 50.461 | 7.704 | 0.007 | nonzero | 0.066 | ||||
| my8033_rel_lto.cy10a_gcp_c2s30 | 36.753 | 5.215 | 51.309 | 6.640 | 0.083 | nonzero | 0.099 |
Insert response time histogram: each cell has the percentage of responses that take <= the time in the header and max is the max response time in seconds. For max values in the top 25% of the range have a red background and in the bottom 25% of the range have a green background. The red background is not used when the min value is within 80% of the max value.
| dbms | 256us | 1ms | 4ms | 16ms | 64ms | 256ms | 1s | 4s | 16s | gt | max |
|---|---|---|---|---|---|---|---|---|---|---|---|
| my5651_rel.cy10a_gcp_c2s30 | 41.917 | 55.125 | 2.958 | 0.061 | |||||||
| my5740_rel_lto.cy10a_gcp_c2s30 | 47.357 | 52.433 | 0.210 | 0.033 | |||||||
| my8033_rel_lto.cy10a_gcp_c2s30 | 30.751 | 68.299 | 0.934 | 0.017 | 0.139 |
Delete response time histogram: each cell has the percentage of responses that take <= the time in the header and max is the max response time in seconds. For max values in the top 25% of the range have a red background and in the bottom 25% of the range have a green background. The red background is not used when the min value is within 80% of the max value.
| dbms | 256us | 1ms | 4ms | 16ms | 64ms | 256ms | 1s | 4s | 16s | gt | max |
|---|---|---|---|---|---|---|---|---|---|---|---|
| my5651_rel.cy10a_gcp_c2s30 | 49.202 | 48.400 | 2.398 | 0.062 | |||||||
| my5740_rel_lto.cy10a_gcp_c2s30 | 70.837 | 29.073 | 0.090 | 0.034 | |||||||
| my8033_rel_lto.cy10a_gcp_c2s30 | 57.223 | 42.228 | 0.537 | 0.011 | 0.132 |
Performance metrics for the DBMS listed above. Some are normalized by throughput, others are not. Legend for results is here.
ips	qps	rps	rmbps	wps	wmbps	rpq	rkbpq	wpi	wkbpi	csps	cpups	cspq	cpupq	dbgb1	dbgb2	rss	maxop	p50	p99	tag
3965	3513	25385	395.1	17897.8	376.7	7.226	115.159	4.514	97.304	106839	20.1	30.412	858	812.6	979.6	85.7	0.079	448	384	4000m.my5651_rel.cy10a_gcp_c2s30
3969	4268	33534	524.0	20684.4	528.4	7.857	125.716	5.211	136.322	136167	21.9	31.905	770	812.3	979.0	86.9	0.066	543	479	4000m.my5740_rel_lto.cy10a_gcp_c2s30
3958	4303	34140	533.4	24469.5	553.1	7.935	126.954	6.182	143.085	167528	25.7	38.936	896	809.0	975.7	86.9	0.099	543	176	4000m.my8033_rel_lto.cy10a_gcp_c2s30
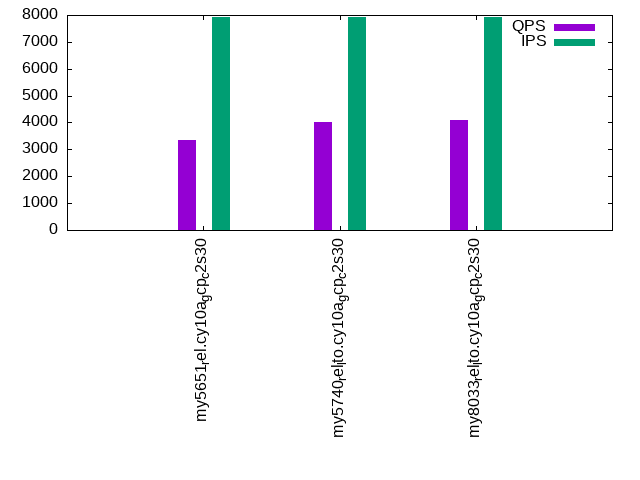
q1000.1
q1000.1: range queries with 1000 insert/s per client. Graphs for performance per 1-second interval are here.
Average throughput:
Query response time histogram: each cell has the percentage of responses that take <= the time in the header and max is the max response time in seconds. For max values in the top 25% of the range have a red background and in the bottom 25% of the range have a green background. The red background is not used when the min value is within 80% of the max value.
| dbms | 256us | 1ms | 4ms | 16ms | 64ms | 256ms | 1s | 4s | 16s | gt | max |
|---|---|---|---|---|---|---|---|---|---|---|---|
| my5651_rel.cy10a_gcp_c2s30 | 37.854 | 3.013 | 37.892 | 21.192 | 0.049 | 0.001 | 0.098 | ||||
| my5740_rel_lto.cy10a_gcp_c2s30 | 38.713 | 2.527 | 48.355 | 10.389 | 0.016 | 0.063 | |||||
| my8033_rel_lto.cy10a_gcp_c2s30 | 35.539 | 5.793 | 50.047 | 8.574 | 0.037 | 0.008 | 0.001 | 0.740 |
Insert response time histogram: each cell has the percentage of responses that take <= the time in the header and max is the max response time in seconds. For max values in the top 25% of the range have a red background and in the bottom 25% of the range have a green background. The red background is not used when the min value is within 80% of the max value.
| dbms | 256us | 1ms | 4ms | 16ms | 64ms | 256ms | 1s | 4s | 16s | gt | max |
|---|---|---|---|---|---|---|---|---|---|---|---|
| my5651_rel.cy10a_gcp_c2s30 | 31.002 | 64.813 | 4.183 | 0.002 | nonzero | 0.299 | |||||
| my5740_rel_lto.cy10a_gcp_c2s30 | 46.219 | 53.477 | 0.304 | 0.049 | |||||||
| my8033_rel_lto.cy10a_gcp_c2s30 | 29.947 | 69.198 | 0.637 | 0.174 | 0.044 | 0.885 |
Delete response time histogram: each cell has the percentage of responses that take <= the time in the header and max is the max response time in seconds. For max values in the top 25% of the range have a red background and in the bottom 25% of the range have a green background. The red background is not used when the min value is within 80% of the max value.
| dbms | 256us | 1ms | 4ms | 16ms | 64ms | 256ms | 1s | 4s | 16s | gt | max |
|---|---|---|---|---|---|---|---|---|---|---|---|
| my5651_rel.cy10a_gcp_c2s30 | 36.843 | 59.622 | 3.531 | 0.003 | nonzero | 0.333 | |||||
| my5740_rel_lto.cy10a_gcp_c2s30 | 67.314 | 32.538 | 0.148 | nonzero | 0.073 | ||||||
| my8033_rel_lto.cy10a_gcp_c2s30 | 54.875 | 44.455 | 0.493 | 0.138 | 0.040 | 0.732 |
Performance metrics for the DBMS listed above. Some are normalized by throughput, others are not. Legend for results is here.
ips	qps	rps	rmbps	wps	wmbps	rpq	rkbpq	wpi	wkbpi	csps	cpups	cspq	cpupq	dbgb1	dbgb2	rss	maxop	p50	p99	tag
7930	3362	24500	379.8	20512.3	424.5	7.288	115.676	2.587	54.817	115497	22.6	34.356	1008	812.9	980.5	85.7	0.098	432	368	4000m.my5651_rel.cy10a_gcp_c2s30
7943	4019	31423	491.0	22910.8	558.9	7.818	125.090	2.885	72.054	138359	25.1	34.424	937	812.3	979.1	86.9	0.063	511	448	4000m.my5740_rel_lto.cy10a_gcp_c2s30
7908	4103	32433	506.8	26669.8	584.5	7.904	126.464	3.373	75.694	170991	29.7	41.671	1086	809.0	976.5	86.9	0.740	512	96	4000m.my8033_rel_lto.cy10a_gcp_c2s30
l.i0
l.i0: load without secondary indexes
Performance metrics for all DBMS, not just the ones listed above. Some are normalized by throughput, others are not. Legend for results is here.
ips	qps	rps	rmbps	wps	wmbps	rpq	rkbpq	wpi	wkbpi	csps	cpups	cspq	cpupq	dbgb1	dbgb2	rss	maxop	p50	p99	tag
424133	0	3330	13.0	2021.6	119.1	0.008	0.031	0.005	0.287	89571	42.6	0.211	15	263.1	391.6	85.7	5.979	54141	13898	4000m.my5651_rel.cy10a_gcp_c2s30
833854	0	0	0.0	4013.5	233.9	0.000	0.000	0.005	0.287	85613	73.2	0.103	13	263.1	391.6	86.8	1.626	107384	82111	4000m.my5740_rel_lto.cy10a_gcp_c2s30
706964	0	0	0.0	3705.8	202.7	0.000	0.000	0.005	0.294	172612	76.8	0.244	16	262.1	390.7	86.9	0.400	90802	69625	4000m.my8033_rel_lto.cy10a_gcp_c2s30
l.x
l.x: create secondary indexes
Performance metrics for all DBMS, not just the ones listed above. Some are normalized by throughput, others are not. Legend for results is here.
ips	qps	rps	rmbps	wps	wmbps	rpq	rkbpq	wpi	wkbpi	csps	cpups	cspq	cpupq	dbgb1	dbgb2	rss	maxop	p50	p99	tag
478195	0	2714	349.3	5299.5	594.0	0.006	0.748	0.011	1.272	14859	33.0	0.031	10	542.2	670.7	85.7	0.002	NA	NA	4000m.my5651_rel.cy10a_gcp_c2s30
764253	0	4027	672.1	7717.6	864.1	0.005	0.900	0.010	1.158	27488	29.5	0.036	6	588.3	716.8	87.3	0.033	NA	NA	4000m.my5740_rel_lto.cy10a_gcp_c2s30
603060	0	7642	649.2	12691.7	773.2	0.013	1.102	0.021	1.313	55738	57.3	0.092	14	586.1	714.7	86.9	0.004	NA	NA	4000m.my8033_rel_lto.cy10a_gcp_c2s30
l.i1
l.i1: continue load after secondary indexes created
Performance metrics for all DBMS, not just the ones listed above. Some are normalized by throughput, others are not. Legend for results is here.
ips	qps	rps	rmbps	wps	wmbps	rpq	rkbpq	wpi	wkbpi	csps	cpups	cspq	cpupq	dbgb1	dbgb2	rss	maxop	p50	p99	tag
14035	0	14160	215.8	26901.3	679.9	1.009	15.748	1.917	49.606	110393	23.9	7.866	255	812.6	979.6	85.7	4.794	849	250	4000m.my5651_rel.cy10a_gcp_c2s30
14167	0	15840	247.5	31321.4	730.8	1.118	17.889	2.211	52.821	129654	28.2	9.152	299	812.3	979.0	87.1	0.337	749	250	4000m.my5740_rel_lto.cy10a_gcp_c2s30
14409	0	17044	266.3	34543.3	775.6	1.183	18.926	2.397	55.118	175995	37.2	12.214	387	809.0	975.5	86.9	1.173	999	250	4000m.my8033_rel_lto.cy10a_gcp_c2s30
q100.1
q100.1: range queries with 100 insert/s per client
Performance metrics for all DBMS, not just the ones listed above. Some are normalized by throughput, others are not. Legend for results is here.
ips	qps	rps	rmbps	wps	wmbps	rpq	rkbpq	wpi	wkbpi	csps	cpups	cspq	cpupq	dbgb1	dbgb2	rss	maxop	p50	p99	tag
789	3183	24350	380.1	20926.0	432.5	7.650	122.296	26.522	561.291	106329	17.7	33.406	834	812.6	979.6	85.7	0.082	416	208	4000m.my5651_rel.cy10a_gcp_c2s30
789	3835	30976	484.0	22554.2	551.0	8.076	129.221	28.571	714.715	130370	20.0	33.991	782	812.3	979.0	87.0	0.074	511	224	4000m.my5740_rel_lto.cy10a_gcp_c2s30
792	3665	30582	477.8	24325.8	544.8	8.343	133.495	30.714	704.402	158387	24.1	43.211	986	809.0	975.5	86.9	0.256	495	112	4000m.my8033_rel_lto.cy10a_gcp_c2s30
q500.1
q500.1: range queries with 500 insert/s per client
Performance metrics for all DBMS, not just the ones listed above. Some are normalized by throughput, others are not. Legend for results is here.
ips	qps	rps	rmbps	wps	wmbps	rpq	rkbpq	wpi	wkbpi	csps	cpups	cspq	cpupq	dbgb1	dbgb2	rss	maxop	p50	p99	tag
3965	3513	25385	395.1	17897.8	376.7	7.226	115.159	4.514	97.304	106839	20.1	30.412	858	812.6	979.6	85.7	0.079	448	384	4000m.my5651_rel.cy10a_gcp_c2s30
3969	4268	33534	524.0	20684.4	528.4	7.857	125.716	5.211	136.322	136167	21.9	31.905	770	812.3	979.0	86.9	0.066	543	479	4000m.my5740_rel_lto.cy10a_gcp_c2s30
3958	4303	34140	533.4	24469.5	553.1	7.935	126.954	6.182	143.085	167528	25.7	38.936	896	809.0	975.7	86.9	0.099	543	176	4000m.my8033_rel_lto.cy10a_gcp_c2s30
q1000.1
q1000.1: range queries with 1000 insert/s per client
Performance metrics for all DBMS, not just the ones listed above. Some are normalized by throughput, others are not. Legend for results is here.
ips	qps	rps	rmbps	wps	wmbps	rpq	rkbpq	wpi	wkbpi	csps	cpups	cspq	cpupq	dbgb1	dbgb2	rss	maxop	p50	p99	tag
7930	3362	24500	379.8	20512.3	424.5	7.288	115.676	2.587	54.817	115497	22.6	34.356	1008	812.9	980.5	85.7	0.098	432	368	4000m.my5651_rel.cy10a_gcp_c2s30
7943	4019	31423	491.0	22910.8	558.9	7.818	125.090	2.885	72.054	138359	25.1	34.424	937	812.3	979.1	86.9	0.063	511	448	4000m.my5740_rel_lto.cy10a_gcp_c2s30
7908	4103	32433	506.8	26669.8	584.5	7.904	126.464	3.373	75.694	170991	29.7	41.671	1086	809.0	976.5	86.9	0.740	512	96	4000m.my8033_rel_lto.cy10a_gcp_c2s30
l.i0
- l.i0: load without secondary indexes
- Legend for results is here.
- Each entry lists the percentage of responses that fit in that bucket (slower than max time for previous bucket, faster than min time for next bucket).
Insert response time histogram
256us	1ms	4ms	16ms	64ms	256ms	1s	4s	16s	gt	max	tag
0.000	0.158	99.517	0.141	0.169	0.014	nonzero	nonzero	nonzero	0.000	5.979	my5651_rel.cy10a_gcp_c2s30
0.000	94.985	4.937	0.046	0.016	0.015	0.001	nonzero	0.000	0.000	1.626	my5740_rel_lto.cy10a_gcp_c2s30
0.000	9.653	90.247	0.066	0.019	0.014	0.001	0.000	0.000	0.000	0.400	my8033_rel_lto.cy10a_gcp_c2s30
l.x
- l.x: create secondary indexes
- Legend for results is here.
- Each entry lists the percentage of responses that fit in that bucket (slower than max time for previous bucket, faster than min time for next bucket).
TODO - determine whether there is data for create index response time
l.i1
- l.i1: continue load after secondary indexes created
- Legend for results is here.
- Each entry lists the percentage of responses that fit in that bucket (slower than max time for previous bucket, faster than min time for next bucket).
Insert response time histogram
256us	1ms	4ms	16ms	64ms	256ms	1s	4s	16s	gt	max	tag
0.000	0.000	0.904	59.370	28.048	11.558	0.119	0.001	nonzero	0.000	4.794	my5651_rel.cy10a_gcp_c2s30
0.000	0.000	2.418	58.267	27.289	11.991	0.035	0.000	0.000	0.000	0.337	my5740_rel_lto.cy10a_gcp_c2s30
0.000	0.000	0.284	58.228	30.087	11.341	0.059	0.001	0.000	0.000	1.173	my8033_rel_lto.cy10a_gcp_c2s30
Delete response time histogram
256us	1ms	4ms	16ms	64ms	256ms	1s	4s	16s	gt	max	tag
0.000	0.000	6.144	81.264	12.463	0.127	0.001	0.001	nonzero	0.000	4.080	my5651_rel.cy10a_gcp_c2s30
0.000	0.000	29.605	66.350	3.903	0.143	0.000	0.000	0.000	0.000	0.179	my5740_rel_lto.cy10a_gcp_c2s30
0.000	0.000	20.029	75.873	3.865	0.232	nonzero	0.000	0.000	0.000	0.328	my8033_rel_lto.cy10a_gcp_c2s30
q100.1
- q100.1: range queries with 100 insert/s per client
- Legend for results is here.
- Each entry lists the percentage of responses that fit in that bucket (slower than max time for previous bucket, faster than min time for next bucket).
Query response time histogram
256us	1ms	4ms	16ms	64ms	256ms	1s	4s	16s	gt	max	tag
37.880	3.009	35.165	23.892	0.053	nonzero	0.000	0.000	0.000	0.000	0.082	my5651_rel.cy10a_gcp_c2s30
38.995	2.272	46.436	12.267	0.030	nonzero	0.000	0.000	0.000	0.000	0.074	my5740_rel_lto.cy10a_gcp_c2s30
33.094	6.511	48.426	11.633	0.331	0.006	nonzero	0.000	0.000	0.000	0.256	my8033_rel_lto.cy10a_gcp_c2s30
Insert response time histogram
256us	1ms	4ms	16ms	64ms	256ms	1s	4s	16s	gt	max	tag
0.000	0.000	18.715	74.146	7.139	0.000	0.000	0.000	0.000	0.000	0.058	my5651_rel.cy10a_gcp_c2s30
0.000	0.000	27.243	71.983	0.771	0.003	0.000	0.000	0.000	0.000	0.072	my5740_rel_lto.cy10a_gcp_c2s30
0.000	0.000	9.101	83.910	6.306	0.670	0.014	0.000	0.000	0.000	0.419	my8033_rel_lto.cy10a_gcp_c2s30
Delete response time histogram
256us	1ms	4ms	16ms	64ms	256ms	1s	4s	16s	gt	max	tag
0.000	0.000	20.562	72.771	6.667	0.000	0.000	0.000	0.000	0.000	0.054	my5651_rel.cy10a_gcp_c2s30
0.000	0.000	37.878	61.493	0.625	0.003	0.000	0.000	0.000	0.000	0.072	my5740_rel_lto.cy10a_gcp_c2s30
0.000	0.000	17.757	76.295	5.337	0.594	0.017	0.000	0.000	0.000	0.419	my8033_rel_lto.cy10a_gcp_c2s30
q500.1
- q500.1: range queries with 500 insert/s per client
- Legend for results is here.
- Each entry lists the percentage of responses that fit in that bucket (slower than max time for previous bucket, faster than min time for next bucket).
Query response time histogram
256us	1ms	4ms	16ms	64ms	256ms	1s	4s	16s	gt	max	tag
38.305	3.475	38.797	19.398	0.024	nonzero	0.000	0.000	0.000	0.000	0.079	my5651_rel.cy10a_gcp_c2s30
39.177	2.650	50.461	7.704	0.007	nonzero	0.000	0.000	0.000	0.000	0.066	my5740_rel_lto.cy10a_gcp_c2s30
36.753	5.215	51.309	6.640	0.083	nonzero	0.000	0.000	0.000	0.000	0.099	my8033_rel_lto.cy10a_gcp_c2s30
Insert response time histogram
256us	1ms	4ms	16ms	64ms	256ms	1s	4s	16s	gt	max	tag
0.000	0.000	41.917	55.125	2.958	0.000	0.000	0.000	0.000	0.000	0.061	my5651_rel.cy10a_gcp_c2s30
0.000	0.000	47.357	52.433	0.210	0.000	0.000	0.000	0.000	0.000	0.033	my5740_rel_lto.cy10a_gcp_c2s30
0.000	0.000	30.751	68.299	0.934	0.017	0.000	0.000	0.000	0.000	0.139	my8033_rel_lto.cy10a_gcp_c2s30
Delete response time histogram
256us	1ms	4ms	16ms	64ms	256ms	1s	4s	16s	gt	max	tag
0.000	0.000	49.202	48.400	2.398	0.000	0.000	0.000	0.000	0.000	0.062	my5651_rel.cy10a_gcp_c2s30
0.000	0.000	70.837	29.073	0.090	0.000	0.000	0.000	0.000	0.000	0.034	my5740_rel_lto.cy10a_gcp_c2s30
0.000	0.000	57.223	42.228	0.537	0.011	0.000	0.000	0.000	0.000	0.132	my8033_rel_lto.cy10a_gcp_c2s30
q1000.1
- q1000.1: range queries with 1000 insert/s per client
- Legend for results is here.
- Each entry lists the percentage of responses that fit in that bucket (slower than max time for previous bucket, faster than min time for next bucket).
Query response time histogram
256us	1ms	4ms	16ms	64ms	256ms	1s	4s	16s	gt	max	tag
37.854	3.013	37.892	21.192	0.049	0.001	0.000	0.000	0.000	0.000	0.098	my5651_rel.cy10a_gcp_c2s30
38.713	2.527	48.355	10.389	0.016	0.000	0.000	0.000	0.000	0.000	0.063	my5740_rel_lto.cy10a_gcp_c2s30
35.539	5.793	50.047	8.574	0.037	0.008	0.001	0.000	0.000	0.000	0.740	my8033_rel_lto.cy10a_gcp_c2s30
Insert response time histogram
256us	1ms	4ms	16ms	64ms	256ms	1s	4s	16s	gt	max	tag
0.000	0.000	31.002	64.813	4.183	0.002	nonzero	0.000	0.000	0.000	0.299	my5651_rel.cy10a_gcp_c2s30
0.000	0.000	46.219	53.477	0.304	0.000	0.000	0.000	0.000	0.000	0.049	my5740_rel_lto.cy10a_gcp_c2s30
0.000	0.000	29.947	69.198	0.637	0.174	0.044	0.000	0.000	0.000	0.885	my8033_rel_lto.cy10a_gcp_c2s30
Delete response time histogram
256us	1ms	4ms	16ms	64ms	256ms	1s	4s	16s	gt	max	tag
0.000	0.000	36.843	59.622	3.531	0.003	nonzero	0.000	0.000	0.000	0.333	my5651_rel.cy10a_gcp_c2s30
0.000	0.000	67.314	32.538	0.148	nonzero	0.000	0.000	0.000	0.000	0.073	my5740_rel_lto.cy10a_gcp_c2s30
0.000	0.000	54.875	44.455	0.493	0.138	0.040	0.000	0.000	0.000	0.732	my8033_rel_lto.cy10a_gcp_c2s30