Introduction
This is a report for the insert benchmark with 160M docs and 8 client(s). It is generated by scripts (bash, awk, sed) and Tufte might not be impressed. An overview of the insert benchmark is here and a short update is here. Below, by DBMS, I mean DBMS+version.config. An example is my8020.c10b40 where my means MySQL, 8020 is version 8.0.20 and c10b40 is the name for the configuration file.
The test server is a c2-standard-30 from GCP with 15 cores, hyperthreads disabled, 120G RAM, XFS + SW RAID 0 on 4 NVMe devices (1.5TB). The benchmark was run with 8 client and there were 1 or 3 connections per client (1 for queries or inserts without rate limits, 1+1 for rate limited inserts+deletes). There are 8 tables, client per table. It loads 160M rows without secondary indexes, creates secondary indexes, then inserts 800M rows with a delete per insert to avoid growing the table. It then does 3 read+write tests for 1800s each that do queries as fast as possible with 100, 500 and then 1000 inserts/second/client concurrent with the queries and 1000 deletes/second to avoid growing the table. The database is cached by InnoDB.
The tested DBMS are:
- my5651_rel.cy10a_gcp_c2s30 - InnoDB and MySQL 5.6.51, rel build, cy10a_gcp_c2s30 config, compiled with CMAKE_BUILD_TYPE=Release -O2, base config
- my5740_rel_lto.cy10a_gcp_c2s30 - InnoDB and MySQL 5.7.40, rel_lto build, cy10a_gcp_c2s30 config, compiled with CMAKE_BUILD_TYPE=Release -O2, base config
- my8033_rel_lto.cy10a_gcp_c2s30 - InnoDB and MySQL 8.0.33, rel_lto build, cy10a_gcp_c2s30 config, compiled with CMAKE_BUILD_TYPE=Release -O2, base config
Contents
- Summary
- l.i0: load without secondary indexes
- l.x: create secondary indexes
- l.i1: continue load after secondary indexes created
- q100.1: range queries with 100 insert/s per client
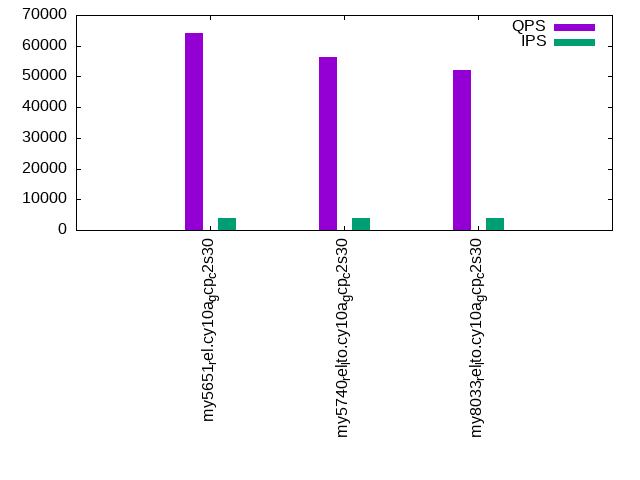
- q500.1: range queries with 500 insert/s per client
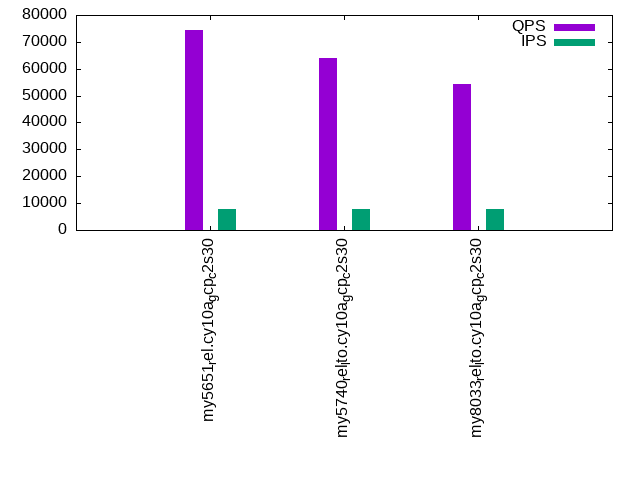
- q1000.1: range queries with 1000 insert/s per client
Summary
The numbers are inserts/s for l.i0 and l.i1, indexed docs (or rows) /s for l.x and queries/s for q*.2. The values are the average rate over the entire test for inserts (IPS) and queries (QPS). The range of values for IPS and QPS is split into 3 parts: bottom 25%, middle 50%, top 25%. Values in the bottom 25% have a red background, values in the top 25% have a green background and values in the middle have no color. A gray background is used for values that can be ignored because the DBMS did not sustain the target insert rate. Red backgrounds are not used when the minimum value is within 80% of the max value.
| dbms | l.i0 | l.x | l.i1 | q100.1 | q500.1 | q1000.1 |
|---|---|---|---|---|---|---|
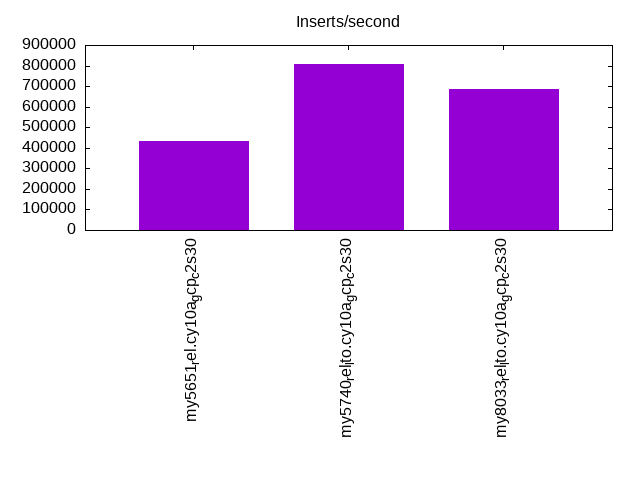
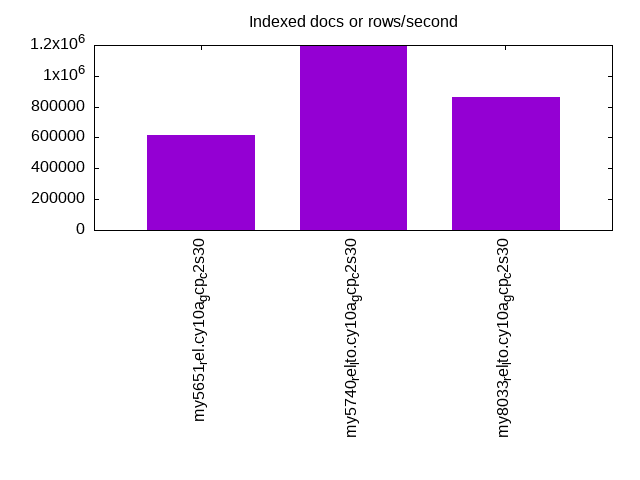
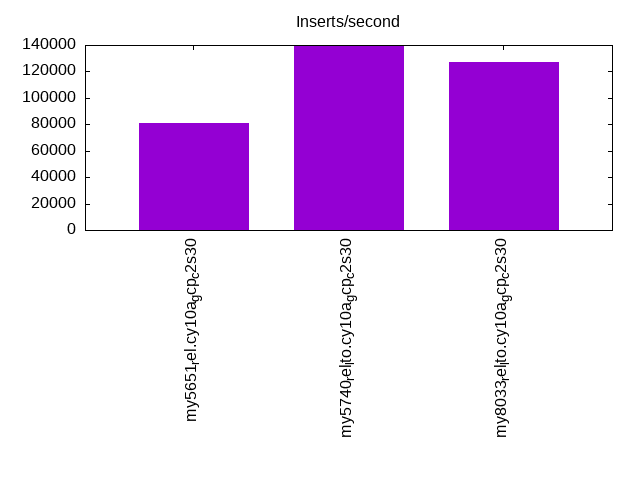
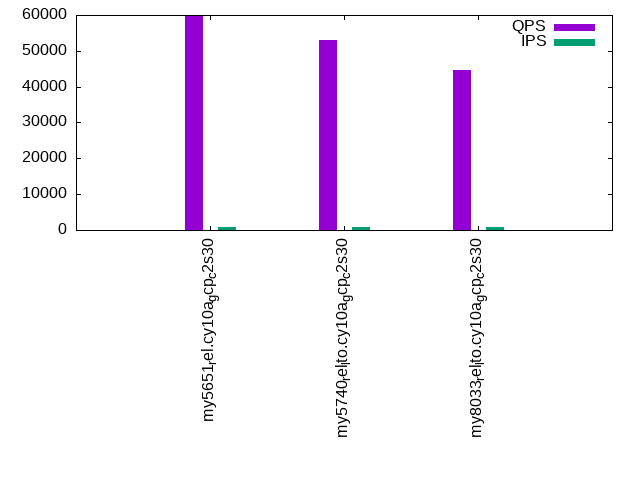
| my5651_rel.cy10a_gcp_c2s30 | 433604 | 618147 | 81202 | 59927 | 64203 | 74452 |
| my5740_rel_lto.cy10a_gcp_c2s30 | 808081 | 1194776 | 139519 | 53059 | 56220 | 63902 |
| my8033_rel_lto.cy10a_gcp_c2s30 | 686695 | 865405 | 127024 | 44591 | 51950 | 54333 |
This table has relative throughput, throughput for the DBMS relative to the DBMS in the first line, using the absolute throughput from the previous table. Values less than 0.95 have a yellow background. Values greater than 1.05 have a blue background.
| dbms | l.i0 | l.x | l.i1 | q100.1 | q500.1 | q1000.1 |
|---|---|---|---|---|---|---|
| my5651_rel.cy10a_gcp_c2s30 | 1.00 | 1.00 | 1.00 | 1.00 | 1.00 | 1.00 |
| my5740_rel_lto.cy10a_gcp_c2s30 | 1.86 | 1.93 | 1.72 | 0.89 | 0.88 | 0.86 |
| my8033_rel_lto.cy10a_gcp_c2s30 | 1.58 | 1.40 | 1.56 | 0.74 | 0.81 | 0.73 |
This lists the average rate of inserts/s for the tests that do inserts concurrent with queries. For such tests the query rate is listed in the table above. The read+write tests are setup so that the insert rate should match the target rate every second. Cells that are not at least 95% of the target have a red background to indicate a failure to satisfy the target.
| dbms | q100.1 | q500.1 | q1000.1 |
|---|---|---|---|
| my5651_rel.cy10a_gcp_c2s30 | 783 | 3962 | 7960 |
| my5740_rel_lto.cy10a_gcp_c2s30 | 783 | 3967 | 7956 |
| my8033_rel_lto.cy10a_gcp_c2s30 | 794 | 3980 | 7960 |
| target | 800 | 4000 | 8000 |
l.i0
l.i0: load without secondary indexes. Graphs for performance per 1-second interval are here.
Average throughput:
Insert response time histogram: each cell has the percentage of responses that take <= the time in the header and max is the max response time in seconds. For the max column values in the top 25% of the range have a red background and in the bottom 25% of the range have a green background. The red background is not used when the min value is within 80% of the max value.
| dbms | 256us | 1ms | 4ms | 16ms | 64ms | 256ms | 1s | 4s | 16s | gt | max |
|---|---|---|---|---|---|---|---|---|---|---|---|
| my5651_rel.cy10a_gcp_c2s30 | 2.235 | 97.528 | 0.066 | 0.156 | 0.014 | 0.240 | |||||
| my5740_rel_lto.cy10a_gcp_c2s30 | 97.481 | 2.458 | 0.033 | 0.012 | 0.015 | 0.238 | |||||
| my8033_rel_lto.cy10a_gcp_c2s30 | 30.288 | 69.638 | 0.033 | 0.026 | 0.014 | 0.253 |
Performance metrics for the DBMS listed above. Some are normalized by throughput, others are not. Legend for results is here.
ips	qps	rps	rmbps	wps	wmbps	rpq	rkbpq	wpi	wkbpi	csps	cpups	cspq	cpupq	dbgb1	dbgb2	rss	maxop	p50	p99	tag
433604	0	3422	13.4	627.6	79.4	0.008	0.032	0.001	0.188	88654	42.2	0.204	15	10.6	139.1	16.1	0.240	57038	42454	160m.my5651_rel.cy10a_gcp_c2s30
808081	0	0	0.0	1486.7	156.7	0.000	0.000	0.002	0.199	80587	69.7	0.100	13	10.6	139.1	17.2	0.238	112878	86207	160m.my5740_rel_lto.cy10a_gcp_c2s30
686695	0	0	0.0	1130.5	127.5	0.000	0.000	0.002	0.190	175781	72.6	0.256	16	10.6	139.1	17.3	0.253	93499	70524	160m.my8033_rel_lto.cy10a_gcp_c2s30
l.x
l.x: create secondary indexes.
Average throughput:
Performance metrics for the DBMS listed above. Some are normalized by throughput, others are not. Legend for results is here.
ips	qps	rps	rmbps	wps	wmbps	rpq	rkbpq	wpi	wkbpi	csps	cpups	cspq	cpupq	dbgb1	dbgb2	rss	maxop	p50	p99	tag
618147	0	310	1.2	7973.7	647.5	0.001	0.002	0.013	1.073	19056	37.5	0.031	9	21.7	150.2	27.4	0.001	NA	NA	160m.my5651_rel.cy10a_gcp_c2s30
1194776	0	0	0.0	14503.2	1069.3	0.000	0.000	0.012	0.916	47853	35.9	0.040	5	23.6	152.1	28.6	0.030	NA	NA	160m.my5740_rel_lto.cy10a_gcp_c2s30
865405	0	4333	275.4	17602.6	842.7	0.005	0.326	0.020	0.997	123381	81.7	0.143	14	23.5	152.1	27.0	0.015	NA	NA	160m.my8033_rel_lto.cy10a_gcp_c2s30
l.i1
l.i1: continue load after secondary indexes created. Graphs for performance per 1-second interval are here.
Average throughput:
Insert response time histogram: each cell has the percentage of responses that take <= the time in the header and max is the max response time in seconds. For the max column values in the top 25% of the range have a red background and in the bottom 25% of the range have a green background. The red background is not used when the min value is within 80% of the max value.
| dbms | 256us | 1ms | 4ms | 16ms | 64ms | 256ms | 1s | 4s | 16s | gt | max |
|---|---|---|---|---|---|---|---|---|---|---|---|
| my5651_rel.cy10a_gcp_c2s30 | nonzero | 29.748 | 69.655 | 0.578 | 0.019 | nonzero | 0.456 | ||||
| my5740_rel_lto.cy10a_gcp_c2s30 | 89.927 | 10.006 | 0.051 | 0.016 | nonzero | 0.492 | |||||
| my8033_rel_lto.cy10a_gcp_c2s30 | 86.480 | 13.402 | 0.098 | 0.020 | 0.001 | 0.396 |
Delete response time histogram: each cell has the percentage of responses that take <= the time in the header and max is the max response time in seconds. For the max column values in the top 25% of the range have a red background and in the bottom 25% of the range have a green background. The red background is not used when the min value is within 80% of the max value.
| dbms | 256us | 1ms | 4ms | 16ms | 64ms | 256ms | 1s | 4s | 16s | gt | max |
|---|---|---|---|---|---|---|---|---|---|---|---|
| my5651_rel.cy10a_gcp_c2s30 | 0.002 | 55.074 | 44.406 | 0.501 | 0.016 | 0.001 | 0.462 | ||||
| my5740_rel_lto.cy10a_gcp_c2s30 | nonzero | 88.750 | 11.177 | 0.056 | 0.016 | nonzero | 0.494 | ||||
| my8033_rel_lto.cy10a_gcp_c2s30 | 87.467 | 12.431 | 0.086 | 0.014 | 0.001 | 0.287 |
Performance metrics for the DBMS listed above. Some are normalized by throughput, others are not. Legend for results is here.
ips	qps	rps	rmbps	wps	wmbps	rpq	rkbpq	wpi	wkbpi	csps	cpups	cspq	cpupq	dbgb1	dbgb2	rss	maxop	p50	p99	tag
81202	0	2640	12.6	4393.5	167.4	0.033	0.159	0.054	2.111	171699	62.0	2.114	115	94.0	251.9	85.7	0.456	10389	6793	160m.my5651_rel.cy10a_gcp_c2s30
139519	0	293	4.6	7157.8	276.7	0.002	0.034	0.051	2.031	56189	87.2	0.403	94	93.7	251.4	86.9	0.492	17681	13633	160m.my5740_rel_lto.cy10a_gcp_c2s30
127024	0	309	4.8	7524.8	276.0	0.002	0.039	0.059	2.225	183257	85.4	1.443	101	72.9	220.1	86.9	0.396	16034	11987	160m.my8033_rel_lto.cy10a_gcp_c2s30
q100.1
q100.1: range queries with 100 insert/s per client. Graphs for performance per 1-second interval are here.
Average throughput:
Query response time histogram: each cell has the percentage of responses that take <= the time in the header and max is the max response time in seconds. For max values in the top 25% of the range have a red background and in the bottom 25% of the range have a green background. The red background is not used when the min value is within 80% of the max value.
| dbms | 256us | 1ms | 4ms | 16ms | 64ms | 256ms | 1s | 4s | 16s | gt | max |
|---|---|---|---|---|---|---|---|---|---|---|---|
| my5651_rel.cy10a_gcp_c2s30 | 99.706 | 0.234 | 0.056 | 0.005 | nonzero | nonzero | 0.084 | ||||
| my5740_rel_lto.cy10a_gcp_c2s30 | 99.614 | 0.376 | 0.009 | nonzero | nonzero | nonzero | 0.083 | ||||
| my8033_rel_lto.cy10a_gcp_c2s30 | 98.885 | 1.110 | 0.005 | nonzero | nonzero | 0.025 |
Insert response time histogram: each cell has the percentage of responses that take <= the time in the header and max is the max response time in seconds. For max values in the top 25% of the range have a red background and in the bottom 25% of the range have a green background. The red background is not used when the min value is within 80% of the max value.
| dbms | 256us | 1ms | 4ms | 16ms | 64ms | 256ms | 1s | 4s | 16s | gt | max |
|---|---|---|---|---|---|---|---|---|---|---|---|
| my5651_rel.cy10a_gcp_c2s30 | 87.983 | 11.920 | 0.097 | 0.037 | |||||||
| my5740_rel_lto.cy10a_gcp_c2s30 | 94.542 | 5.406 | 0.052 | 0.026 | |||||||
| my8033_rel_lto.cy10a_gcp_c2s30 | 97.962 | 2.028 | 0.010 | 0.025 |
Delete response time histogram: each cell has the percentage of responses that take <= the time in the header and max is the max response time in seconds. For max values in the top 25% of the range have a red background and in the bottom 25% of the range have a green background. The red background is not used when the min value is within 80% of the max value.
| dbms | 256us | 1ms | 4ms | 16ms | 64ms | 256ms | 1s | 4s | 16s | gt | max |
|---|---|---|---|---|---|---|---|---|---|---|---|
| my5651_rel.cy10a_gcp_c2s30 | 0.205 | 90.292 | 9.410 | 0.094 | 0.036 | ||||||
| my5740_rel_lto.cy10a_gcp_c2s30 | 95.677 | 4.274 | 0.049 | 0.047 | |||||||
| my8033_rel_lto.cy10a_gcp_c2s30 | 98.031 | 1.969 | 0.015 |
Performance metrics for the DBMS listed above. Some are normalized by throughput, others are not. Legend for results is here.
ips	qps	rps	rmbps	wps	wmbps	rpq	rkbpq	wpi	wkbpi	csps	cpups	cspq	cpupq	dbgb1	dbgb2	rss	maxop	p50	p99	tag
783	59927	1728	26.6	3748.0	116.8	0.029	0.454	4.789	152.802	209424	69.1	3.495	173	94.0	251.9	85.7	0.084	7672	7339	160m.my5651_rel.cy10a_gcp_c2s30
783	53059	1527	23.9	3558.4	108.9	0.029	0.460	4.545	142.467	181462	71.5	3.420	202	93.7	251.4	86.9	0.083	6777	6507	160m.my5740_rel_lto.cy10a_gcp_c2s30
794	44591	653	10.2	3914.9	118.8	0.015	0.234	4.929	153.226	162889	71.9	3.653	242	72.9	220.2	86.9	0.025	5579	5340	160m.my8033_rel_lto.cy10a_gcp_c2s30
q500.1
q500.1: range queries with 500 insert/s per client. Graphs for performance per 1-second interval are here.
Average throughput:
Query response time histogram: each cell has the percentage of responses that take <= the time in the header and max is the max response time in seconds. For max values in the top 25% of the range have a red background and in the bottom 25% of the range have a green background. The red background is not used when the min value is within 80% of the max value.
| dbms | 256us | 1ms | 4ms | 16ms | 64ms | 256ms | 1s | 4s | 16s | gt | max |
|---|---|---|---|---|---|---|---|---|---|---|---|
| my5651_rel.cy10a_gcp_c2s30 | 99.626 | 0.294 | 0.073 | 0.008 | nonzero | nonzero | 0.078 | ||||
| my5740_rel_lto.cy10a_gcp_c2s30 | 99.701 | 0.284 | 0.014 | 0.001 | nonzero | nonzero | 0.108 | ||||
| my8033_rel_lto.cy10a_gcp_c2s30 | 99.494 | 0.483 | 0.021 | 0.002 | nonzero | 0.026 |
Insert response time histogram: each cell has the percentage of responses that take <= the time in the header and max is the max response time in seconds. For max values in the top 25% of the range have a red background and in the bottom 25% of the range have a green background. The red background is not used when the min value is within 80% of the max value.
| dbms | 256us | 1ms | 4ms | 16ms | 64ms | 256ms | 1s | 4s | 16s | gt | max |
|---|---|---|---|---|---|---|---|---|---|---|---|
| my5651_rel.cy10a_gcp_c2s30 | 0.026 | 96.237 | 3.662 | 0.074 | 0.058 | ||||||
| my5740_rel_lto.cy10a_gcp_c2s30 | 95.542 | 4.438 | 0.020 | 0.030 | |||||||
| my8033_rel_lto.cy10a_gcp_c2s30 | 74.484 | 24.806 | 0.710 | 0.039 |
Delete response time histogram: each cell has the percentage of responses that take <= the time in the header and max is the max response time in seconds. For max values in the top 25% of the range have a red background and in the bottom 25% of the range have a green background. The red background is not used when the min value is within 80% of the max value.
| dbms | 256us | 1ms | 4ms | 16ms | 64ms | 256ms | 1s | 4s | 16s | gt | max |
|---|---|---|---|---|---|---|---|---|---|---|---|
| my5651_rel.cy10a_gcp_c2s30 | 0.751 | 96.558 | 2.624 | 0.067 | 0.054 | ||||||
| my5740_rel_lto.cy10a_gcp_c2s30 | 0.054 | 97.059 | 2.872 | 0.015 | 0.048 | ||||||
| my8033_rel_lto.cy10a_gcp_c2s30 | 80.290 | 19.254 | 0.456 | 0.035 |
Performance metrics for the DBMS listed above. Some are normalized by throughput, others are not. Legend for results is here.
ips	qps	rps	rmbps	wps	wmbps	rpq	rkbpq	wpi	wkbpi	csps	cpups	cspq	cpupq	dbgb1	dbgb2	rss	maxop	p50	p99	tag
3962	64203	1070	15.1	3703.6	122.9	0.017	0.241	0.935	31.753	220353	69.2	3.432	162	94.0	251.9	85.7	0.078	8007	7384	160m.my5651_rel.cy10a_gcp_c2s30
3967	56220	999	15.6	3949.9	130.7	0.018	0.284	0.996	33.737	178196	74.2	3.170	198	93.7	251.4	86.9	0.108	7080	6651	160m.my5740_rel_lto.cy10a_gcp_c2s30
3980	51950	28	0.4	1789.5	54.5	0.001	0.009	0.450	14.017	200223	61.1	3.854	176	72.9	201.6	86.9	0.026	6920	5451	160m.my8033_rel_lto.cy10a_gcp_c2s30
q1000.1
q1000.1: range queries with 1000 insert/s per client. Graphs for performance per 1-second interval are here.
Average throughput:
Query response time histogram: each cell has the percentage of responses that take <= the time in the header and max is the max response time in seconds. For max values in the top 25% of the range have a red background and in the bottom 25% of the range have a green background. The red background is not used when the min value is within 80% of the max value.
| dbms | 256us | 1ms | 4ms | 16ms | 64ms | 256ms | 1s | 4s | 16s | gt | max |
|---|---|---|---|---|---|---|---|---|---|---|---|
| my5651_rel.cy10a_gcp_c2s30 | 99.508 | 0.441 | 0.046 | 0.004 | nonzero | 0.031 | |||||
| my5740_rel_lto.cy10a_gcp_c2s30 | 99.797 | 0.180 | 0.019 | 0.003 | nonzero | 0.025 | |||||
| my8033_rel_lto.cy10a_gcp_c2s30 | 99.629 | 0.317 | 0.048 | 0.005 | nonzero | 0.044 |
Insert response time histogram: each cell has the percentage of responses that take <= the time in the header and max is the max response time in seconds. For max values in the top 25% of the range have a red background and in the bottom 25% of the range have a green background. The red background is not used when the min value is within 80% of the max value.
| dbms | 256us | 1ms | 4ms | 16ms | 64ms | 256ms | 1s | 4s | 16s | gt | max |
|---|---|---|---|---|---|---|---|---|---|---|---|
| my5651_rel.cy10a_gcp_c2s30 | 0.001 | 46.743 | 52.613 | 0.643 | 0.034 | ||||||
| my5740_rel_lto.cy10a_gcp_c2s30 | 95.443 | 4.494 | 0.064 | 0.029 | |||||||
| my8033_rel_lto.cy10a_gcp_c2s30 | 72.777 | 26.270 | 0.953 | 0.043 |
Delete response time histogram: each cell has the percentage of responses that take <= the time in the header and max is the max response time in seconds. For max values in the top 25% of the range have a red background and in the bottom 25% of the range have a green background. The red background is not used when the min value is within 80% of the max value.
| dbms | 256us | 1ms | 4ms | 16ms | 64ms | 256ms | 1s | 4s | 16s | gt | max |
|---|---|---|---|---|---|---|---|---|---|---|---|
| my5651_rel.cy10a_gcp_c2s30 | 0.022 | 54.626 | 44.981 | 0.372 | 0.033 | ||||||
| my5740_rel_lto.cy10a_gcp_c2s30 | 0.077 | 96.115 | 3.753 | 0.054 | 0.031 | ||||||
| my8033_rel_lto.cy10a_gcp_c2s30 | 78.028 | 21.264 | 0.709 | 0.049 |
Performance metrics for the DBMS listed above. Some are normalized by throughput, others are not. Legend for results is here.
ips	qps	rps	rmbps	wps	wmbps	rpq	rkbpq	wpi	wkbpi	csps	cpups	cspq	cpupq	dbgb1	dbgb2	rss	maxop	p50	p99	tag
7960	74452	334	2.5	1410.6	45.8	0.004	0.035	0.177	5.889	285371	57.3	3.833	115	94.0	251.9	85.7	0.031	9366	9030	160m.my5651_rel.cy10a_gcp_c2s30
7956	63902	131	2.0	1786.9	58.7	0.002	0.033	0.225	7.557	236311	62.1	3.698	146	93.7	251.4	86.9	0.025	8311	6747	160m.my5740_rel_lto.cy10a_gcp_c2s30
7960	54333	48	0.8	874.7	28.4	0.001	0.014	0.110	3.651	207556	58.1	3.820	160	72.9	201.6	86.9	0.044	6811	6675	160m.my8033_rel_lto.cy10a_gcp_c2s30
l.i0
l.i0: load without secondary indexes
Performance metrics for all DBMS, not just the ones listed above. Some are normalized by throughput, others are not. Legend for results is here.
ips	qps	rps	rmbps	wps	wmbps	rpq	rkbpq	wpi	wkbpi	csps	cpups	cspq	cpupq	dbgb1	dbgb2	rss	maxop	p50	p99	tag
433604	0	3422	13.4	627.6	79.4	0.008	0.032	0.001	0.188	88654	42.2	0.204	15	10.6	139.1	16.1	0.240	57038	42454	160m.my5651_rel.cy10a_gcp_c2s30
808081	0	0	0.0	1486.7	156.7	0.000	0.000	0.002	0.199	80587	69.7	0.100	13	10.6	139.1	17.2	0.238	112878	86207	160m.my5740_rel_lto.cy10a_gcp_c2s30
686695	0	0	0.0	1130.5	127.5	0.000	0.000	0.002	0.190	175781	72.6	0.256	16	10.6	139.1	17.3	0.253	93499	70524	160m.my8033_rel_lto.cy10a_gcp_c2s30
l.x
l.x: create secondary indexes
Performance metrics for all DBMS, not just the ones listed above. Some are normalized by throughput, others are not. Legend for results is here.
ips	qps	rps	rmbps	wps	wmbps	rpq	rkbpq	wpi	wkbpi	csps	cpups	cspq	cpupq	dbgb1	dbgb2	rss	maxop	p50	p99	tag
618147	0	310	1.2	7973.7	647.5	0.001	0.002	0.013	1.073	19056	37.5	0.031	9	21.7	150.2	27.4	0.001	NA	NA	160m.my5651_rel.cy10a_gcp_c2s30
1194776	0	0	0.0	14503.2	1069.3	0.000	0.000	0.012	0.916	47853	35.9	0.040	5	23.6	152.1	28.6	0.030	NA	NA	160m.my5740_rel_lto.cy10a_gcp_c2s30
865405	0	4333	275.4	17602.6	842.7	0.005	0.326	0.020	0.997	123381	81.7	0.143	14	23.5	152.1	27.0	0.015	NA	NA	160m.my8033_rel_lto.cy10a_gcp_c2s30
l.i1
l.i1: continue load after secondary indexes created
Performance metrics for all DBMS, not just the ones listed above. Some are normalized by throughput, others are not. Legend for results is here.
ips	qps	rps	rmbps	wps	wmbps	rpq	rkbpq	wpi	wkbpi	csps	cpups	cspq	cpupq	dbgb1	dbgb2	rss	maxop	p50	p99	tag
81202	0	2640	12.6	4393.5	167.4	0.033	0.159	0.054	2.111	171699	62.0	2.114	115	94.0	251.9	85.7	0.456	10389	6793	160m.my5651_rel.cy10a_gcp_c2s30
139519	0	293	4.6	7157.8	276.7	0.002	0.034	0.051	2.031	56189	87.2	0.403	94	93.7	251.4	86.9	0.492	17681	13633	160m.my5740_rel_lto.cy10a_gcp_c2s30
127024	0	309	4.8	7524.8	276.0	0.002	0.039	0.059	2.225	183257	85.4	1.443	101	72.9	220.1	86.9	0.396	16034	11987	160m.my8033_rel_lto.cy10a_gcp_c2s30
q100.1
q100.1: range queries with 100 insert/s per client
Performance metrics for all DBMS, not just the ones listed above. Some are normalized by throughput, others are not. Legend for results is here.
ips	qps	rps	rmbps	wps	wmbps	rpq	rkbpq	wpi	wkbpi	csps	cpups	cspq	cpupq	dbgb1	dbgb2	rss	maxop	p50	p99	tag
783	59927	1728	26.6	3748.0	116.8	0.029	0.454	4.789	152.802	209424	69.1	3.495	173	94.0	251.9	85.7	0.084	7672	7339	160m.my5651_rel.cy10a_gcp_c2s30
783	53059	1527	23.9	3558.4	108.9	0.029	0.460	4.545	142.467	181462	71.5	3.420	202	93.7	251.4	86.9	0.083	6777	6507	160m.my5740_rel_lto.cy10a_gcp_c2s30
794	44591	653	10.2	3914.9	118.8	0.015	0.234	4.929	153.226	162889	71.9	3.653	242	72.9	220.2	86.9	0.025	5579	5340	160m.my8033_rel_lto.cy10a_gcp_c2s30
q500.1
q500.1: range queries with 500 insert/s per client
Performance metrics for all DBMS, not just the ones listed above. Some are normalized by throughput, others are not. Legend for results is here.
ips	qps	rps	rmbps	wps	wmbps	rpq	rkbpq	wpi	wkbpi	csps	cpups	cspq	cpupq	dbgb1	dbgb2	rss	maxop	p50	p99	tag
3962	64203	1070	15.1	3703.6	122.9	0.017	0.241	0.935	31.753	220353	69.2	3.432	162	94.0	251.9	85.7	0.078	8007	7384	160m.my5651_rel.cy10a_gcp_c2s30
3967	56220	999	15.6	3949.9	130.7	0.018	0.284	0.996	33.737	178196	74.2	3.170	198	93.7	251.4	86.9	0.108	7080	6651	160m.my5740_rel_lto.cy10a_gcp_c2s30
3980	51950	28	0.4	1789.5	54.5	0.001	0.009	0.450	14.017	200223	61.1	3.854	176	72.9	201.6	86.9	0.026	6920	5451	160m.my8033_rel_lto.cy10a_gcp_c2s30
q1000.1
q1000.1: range queries with 1000 insert/s per client
Performance metrics for all DBMS, not just the ones listed above. Some are normalized by throughput, others are not. Legend for results is here.
ips	qps	rps	rmbps	wps	wmbps	rpq	rkbpq	wpi	wkbpi	csps	cpups	cspq	cpupq	dbgb1	dbgb2	rss	maxop	p50	p99	tag
7960	74452	334	2.5	1410.6	45.8	0.004	0.035	0.177	5.889	285371	57.3	3.833	115	94.0	251.9	85.7	0.031	9366	9030	160m.my5651_rel.cy10a_gcp_c2s30
7956	63902	131	2.0	1786.9	58.7	0.002	0.033	0.225	7.557	236311	62.1	3.698	146	93.7	251.4	86.9	0.025	8311	6747	160m.my5740_rel_lto.cy10a_gcp_c2s30
7960	54333	48	0.8	874.7	28.4	0.001	0.014	0.110	3.651	207556	58.1	3.820	160	72.9	201.6	86.9	0.044	6811	6675	160m.my8033_rel_lto.cy10a_gcp_c2s30
l.i0
- l.i0: load without secondary indexes
- Legend for results is here.
- Each entry lists the percentage of responses that fit in that bucket (slower than max time for previous bucket, faster than min time for next bucket).
Insert response time histogram
256us	1ms	4ms	16ms	64ms	256ms	1s	4s	16s	gt	max	tag
0.000	2.235	97.528	0.066	0.156	0.014	0.000	0.000	0.000	0.000	0.240	my5651_rel.cy10a_gcp_c2s30
0.000	97.481	2.458	0.033	0.012	0.015	0.000	0.000	0.000	0.000	0.238	my5740_rel_lto.cy10a_gcp_c2s30
0.000	30.288	69.638	0.033	0.026	0.014	0.000	0.000	0.000	0.000	0.253	my8033_rel_lto.cy10a_gcp_c2s30
l.x
- l.x: create secondary indexes
- Legend for results is here.
- Each entry lists the percentage of responses that fit in that bucket (slower than max time for previous bucket, faster than min time for next bucket).
TODO - determine whether there is data for create index response time
l.i1
- l.i1: continue load after secondary indexes created
- Legend for results is here.
- Each entry lists the percentage of responses that fit in that bucket (slower than max time for previous bucket, faster than min time for next bucket).
Insert response time histogram
256us	1ms	4ms	16ms	64ms	256ms	1s	4s	16s	gt	max	tag
0.000	nonzero	29.748	69.655	0.578	0.019	nonzero	0.000	0.000	0.000	0.456	my5651_rel.cy10a_gcp_c2s30
0.000	0.000	89.927	10.006	0.051	0.016	nonzero	0.000	0.000	0.000	0.492	my5740_rel_lto.cy10a_gcp_c2s30
0.000	0.000	86.480	13.402	0.098	0.020	0.001	0.000	0.000	0.000	0.396	my8033_rel_lto.cy10a_gcp_c2s30
Delete response time histogram
256us	1ms	4ms	16ms	64ms	256ms	1s	4s	16s	gt	max	tag
0.000	0.002	55.074	44.406	0.501	0.016	0.001	0.000	0.000	0.000	0.462	my5651_rel.cy10a_gcp_c2s30
0.000	nonzero	88.750	11.177	0.056	0.016	nonzero	0.000	0.000	0.000	0.494	my5740_rel_lto.cy10a_gcp_c2s30
0.000	0.000	87.467	12.431	0.086	0.014	0.001	0.000	0.000	0.000	0.287	my8033_rel_lto.cy10a_gcp_c2s30
q100.1
- q100.1: range queries with 100 insert/s per client
- Legend for results is here.
- Each entry lists the percentage of responses that fit in that bucket (slower than max time for previous bucket, faster than min time for next bucket).
Query response time histogram
256us	1ms	4ms	16ms	64ms	256ms	1s	4s	16s	gt	max	tag
99.706	0.234	0.056	0.005	nonzero	nonzero	0.000	0.000	0.000	0.000	0.084	my5651_rel.cy10a_gcp_c2s30
99.614	0.376	0.009	nonzero	nonzero	nonzero	0.000	0.000	0.000	0.000	0.083	my5740_rel_lto.cy10a_gcp_c2s30
98.885	1.110	0.005	nonzero	nonzero	0.000	0.000	0.000	0.000	0.000	0.025	my8033_rel_lto.cy10a_gcp_c2s30
Insert response time histogram
256us	1ms	4ms	16ms	64ms	256ms	1s	4s	16s	gt	max	tag
0.000	0.000	87.983	11.920	0.097	0.000	0.000	0.000	0.000	0.000	0.037	my5651_rel.cy10a_gcp_c2s30
0.000	0.000	94.542	5.406	0.052	0.000	0.000	0.000	0.000	0.000	0.026	my5740_rel_lto.cy10a_gcp_c2s30
0.000	0.000	97.962	2.028	0.010	0.000	0.000	0.000	0.000	0.000	0.025	my8033_rel_lto.cy10a_gcp_c2s30
Delete response time histogram
256us	1ms	4ms	16ms	64ms	256ms	1s	4s	16s	gt	max	tag
0.000	0.205	90.292	9.410	0.094	0.000	0.000	0.000	0.000	0.000	0.036	my5651_rel.cy10a_gcp_c2s30
0.000	0.000	95.677	4.274	0.049	0.000	0.000	0.000	0.000	0.000	0.047	my5740_rel_lto.cy10a_gcp_c2s30
0.000	0.000	98.031	1.969	0.000	0.000	0.000	0.000	0.000	0.000	0.015	my8033_rel_lto.cy10a_gcp_c2s30
q500.1
- q500.1: range queries with 500 insert/s per client
- Legend for results is here.
- Each entry lists the percentage of responses that fit in that bucket (slower than max time for previous bucket, faster than min time for next bucket).
Query response time histogram
256us	1ms	4ms	16ms	64ms	256ms	1s	4s	16s	gt	max	tag
99.626	0.294	0.073	0.008	nonzero	nonzero	0.000	0.000	0.000	0.000	0.078	my5651_rel.cy10a_gcp_c2s30
99.701	0.284	0.014	0.001	nonzero	nonzero	0.000	0.000	0.000	0.000	0.108	my5740_rel_lto.cy10a_gcp_c2s30
99.494	0.483	0.021	0.002	nonzero	0.000	0.000	0.000	0.000	0.000	0.026	my8033_rel_lto.cy10a_gcp_c2s30
Insert response time histogram
256us	1ms	4ms	16ms	64ms	256ms	1s	4s	16s	gt	max	tag
0.000	0.026	96.237	3.662	0.074	0.000	0.000	0.000	0.000	0.000	0.058	my5651_rel.cy10a_gcp_c2s30
0.000	0.000	95.542	4.438	0.020	0.000	0.000	0.000	0.000	0.000	0.030	my5740_rel_lto.cy10a_gcp_c2s30
0.000	0.000	74.484	24.806	0.710	0.000	0.000	0.000	0.000	0.000	0.039	my8033_rel_lto.cy10a_gcp_c2s30
Delete response time histogram
256us	1ms	4ms	16ms	64ms	256ms	1s	4s	16s	gt	max	tag
0.000	0.751	96.558	2.624	0.067	0.000	0.000	0.000	0.000	0.000	0.054	my5651_rel.cy10a_gcp_c2s30
0.000	0.054	97.059	2.872	0.015	0.000	0.000	0.000	0.000	0.000	0.048	my5740_rel_lto.cy10a_gcp_c2s30
0.000	0.000	80.290	19.254	0.456	0.000	0.000	0.000	0.000	0.000	0.035	my8033_rel_lto.cy10a_gcp_c2s30
q1000.1
- q1000.1: range queries with 1000 insert/s per client
- Legend for results is here.
- Each entry lists the percentage of responses that fit in that bucket (slower than max time for previous bucket, faster than min time for next bucket).
Query response time histogram
256us	1ms	4ms	16ms	64ms	256ms	1s	4s	16s	gt	max	tag
99.508	0.441	0.046	0.004	nonzero	0.000	0.000	0.000	0.000	0.000	0.031	my5651_rel.cy10a_gcp_c2s30
99.797	0.180	0.019	0.003	nonzero	0.000	0.000	0.000	0.000	0.000	0.025	my5740_rel_lto.cy10a_gcp_c2s30
99.629	0.317	0.048	0.005	nonzero	0.000	0.000	0.000	0.000	0.000	0.044	my8033_rel_lto.cy10a_gcp_c2s30
Insert response time histogram
256us	1ms	4ms	16ms	64ms	256ms	1s	4s	16s	gt	max	tag
0.000	0.001	46.743	52.613	0.643	0.000	0.000	0.000	0.000	0.000	0.034	my5651_rel.cy10a_gcp_c2s30
0.000	0.000	95.443	4.494	0.064	0.000	0.000	0.000	0.000	0.000	0.029	my5740_rel_lto.cy10a_gcp_c2s30
0.000	0.000	72.777	26.270	0.953	0.000	0.000	0.000	0.000	0.000	0.043	my8033_rel_lto.cy10a_gcp_c2s30
Delete response time histogram
256us	1ms	4ms	16ms	64ms	256ms	1s	4s	16s	gt	max	tag
0.000	0.022	54.626	44.981	0.372	0.000	0.000	0.000	0.000	0.000	0.033	my5651_rel.cy10a_gcp_c2s30
0.000	0.077	96.115	3.753	0.054	0.000	0.000	0.000	0.000	0.000	0.031	my5740_rel_lto.cy10a_gcp_c2s30
0.000	0.000	78.028	21.264	0.709	0.000	0.000	0.000	0.000	0.000	0.049	my8033_rel_lto.cy10a_gcp_c2s30