Introduction
This is a report for the insert benchmark with 160M docs and 8 client(s). It is generated by scripts (bash, awk, sed) and Tufte might not be impressed. An overview of the insert benchmark is here and a short update is here. Below, by DBMS, I mean DBMS+version.config. An example is my8020.c10b40 where my means MySQL, 8020 is version 8.0.20 and c10b40 is the name for the configuration file.
The test server is a c2-standard-30 from GCP with 15 cores, hyperthreads disabled, 120G RAM, XFS + SW RAID 0 on 4 NVMe devices (1.5TB). The benchmark was run with 8 client and there were 1 or 3 connections per client (1 for queries or inserts without rate limits, 1+1 for rate limited inserts+deletes). There are 8 tables, client per table. It loads 160M rows without secondary indexes, creates secondary indexes, then inserts 800M rows with a delete per insert to avoid growing the table. It then does 3 read+write tests for 1800s each that do queries as fast as possible with 100, 500 and then 1000 inserts/second/client concurrent with the queries and 1000 deletes/second to avoid growing the table. The database is cached by InnoDB and the only IO is for writes.
The tested DBMS are:
- my5740_rel_lto.cy10a_gcp_c2s30 - InnoDB and MySQL 5.7.40, rel_lto build, cy10a_gcp_c2s30 config, compiled with CMAKE_BUILD_TYPE=Release -O2, base config
- my5740_rel_lto.cy10a1_gcp_c2s30 - InnoDB and MySQL 5.7.40, rel_lto build, cy10a_gcp_c2s30 config, compiled with CMAKE_BUILD_TYPE=Release -O2, adds innodb_use_native_aio=off
- my5740_rel_lto.cy10a2_gcp_c2s30 - InnoDB and MySQL 5.7.40, rel_lto build, cy10a_gcp_c2s30 config, compiled with CMAKE_BUILD_TYPE=Release -O2, adds innodb_io_capacity=20k, innodb_io_capacity_max=40k
- my5740_rel_lto.cy10a3_gcp_c2s30 - InnoDB and MySQL 5.7.40, rel_lto build, cy10a_gcp_c2s30 config, compiled with CMAKE_BUILD_TYPE=Release -O2, adds innodb_io_capacity=20k, innodb_io_capacity_max=40k, innodb_flush_sync=OFF
- my5740_rel_lto.cy10a4_gcp_c2s30 - InnoDB and MySQL 5.7.40, rel_lto build, cy10a_gcp_c2s30 config, compiled with CMAKE_BUILD_TYPE=Release -O2, adds innodb_flush_method=fsync
Contents
- Summary
- l.i0: load without secondary indexes
- l.x: create secondary indexes
- l.i1: continue load after secondary indexes created
- q100.1: range queries with 100 insert/s per client
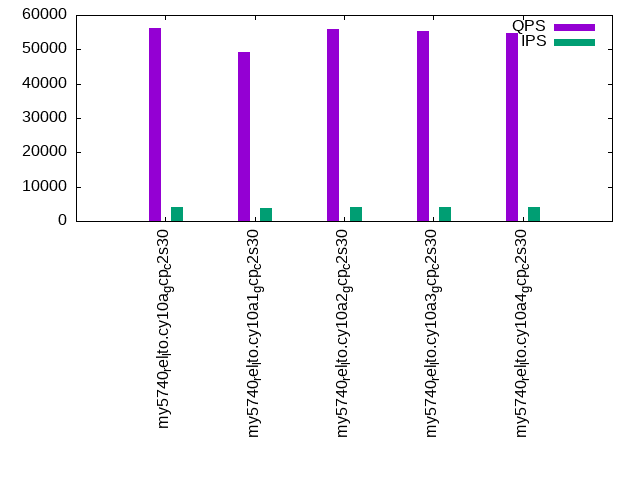
- q500.1: range queries with 500 insert/s per client
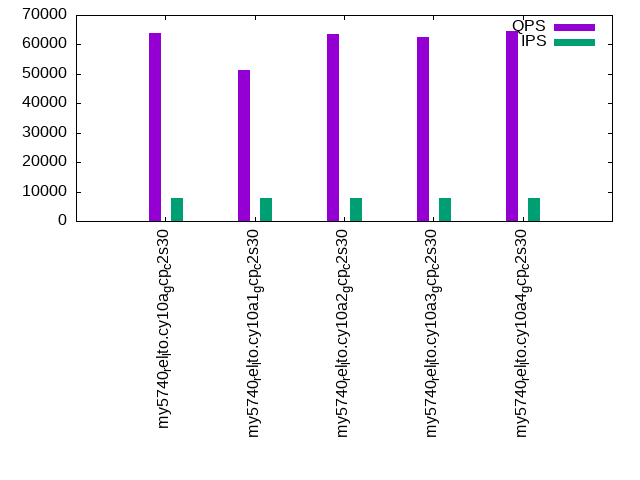
- q1000.1: range queries with 1000 insert/s per client
Summary
The numbers are inserts/s for l.i0 and l.i1, indexed docs (or rows) /s for l.x and queries/s for q*.2. The values are the average rate over the entire test for inserts (IPS) and queries (QPS). The range of values for IPS and QPS is split into 3 parts: bottom 25%, middle 50%, top 25%. Values in the bottom 25% have a red background, values in the top 25% have a green background and values in the middle have no color. A gray background is used for values that can be ignored because the DBMS did not sustain the target insert rate. Red backgrounds are not used when the minimum value is within 80% of the max value.
| dbms | l.i0 | l.x | l.i1 | q100.1 | q500.1 | q1000.1 |
|---|---|---|---|---|---|---|
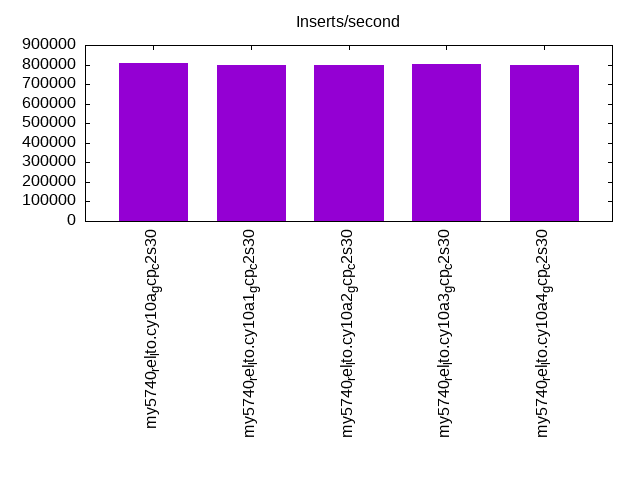
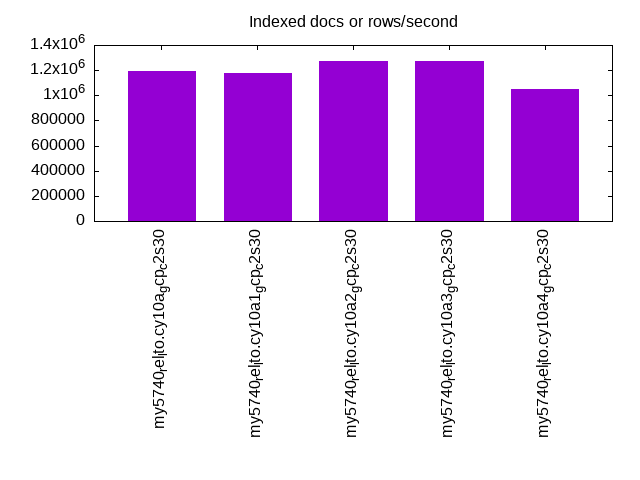
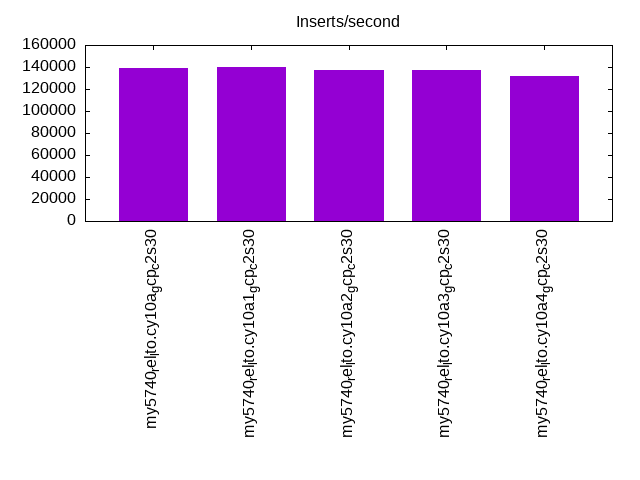
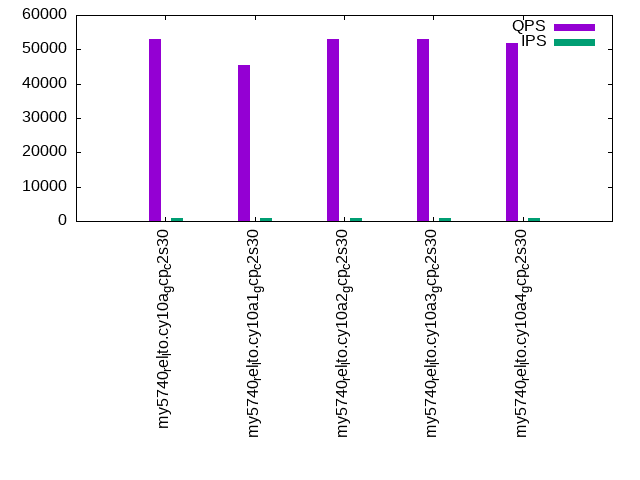
| my5740_rel_lto.cy10a_gcp_c2s30 | 808081 | 1194776 | 139519 | 53059 | 56220 | 63902 |
| my5740_rel_lto.cy10a1_gcp_c2s30 | 796020 | 1177206 | 140449 | 45383 | 49240 | 51420 |
| my5740_rel_lto.cy10a2_gcp_c2s30 | 800000 | 1270635 | 137717 | 52964 | 55932 | 63449 |
| my5740_rel_lto.cy10a3_gcp_c2s30 | 804020 | 1270635 | 137221 | 53114 | 55418 | 62525 |
| my5740_rel_lto.cy10a4_gcp_c2s30 | 800000 | 1046405 | 131406 | 51872 | 54827 | 64620 |
This table has relative throughput, throughput for the DBMS relative to the DBMS in the first line, using the absolute throughput from the previous table. Values less than 0.95 have a yellow background. Values greater than 1.05 have a blue background.
| dbms | l.i0 | l.x | l.i1 | q100.1 | q500.1 | q1000.1 |
|---|---|---|---|---|---|---|
| my5740_rel_lto.cy10a_gcp_c2s30 | 1.00 | 1.00 | 1.00 | 1.00 | 1.00 | 1.00 |
| my5740_rel_lto.cy10a1_gcp_c2s30 | 0.99 | 0.99 | 1.01 | 0.86 | 0.88 | 0.80 |
| my5740_rel_lto.cy10a2_gcp_c2s30 | 0.99 | 1.06 | 0.99 | 1.00 | 0.99 | 0.99 |
| my5740_rel_lto.cy10a3_gcp_c2s30 | 0.99 | 1.06 | 0.98 | 1.00 | 0.99 | 0.98 |
| my5740_rel_lto.cy10a4_gcp_c2s30 | 0.99 | 0.88 | 0.94 | 0.98 | 0.98 | 1.01 |
This lists the average rate of inserts/s for the tests that do inserts concurrent with queries. For such tests the query rate is listed in the table above. The read+write tests are setup so that the insert rate should match the target rate every second. Cells that are not at least 95% of the target have a red background to indicate a failure to satisfy the target.
| dbms | q100.1 | q500.1 | q1000.1 |
|---|---|---|---|
| my5740_rel_lto.cy10a_gcp_c2s30 | 783 | 3967 | 7956 |
| my5740_rel_lto.cy10a1_gcp_c2s30 | 741 | 3785 | 7725 |
| my5740_rel_lto.cy10a2_gcp_c2s30 | 786 | 3967 | 7956 |
| my5740_rel_lto.cy10a3_gcp_c2s30 | 785 | 3965 | 7960 |
| my5740_rel_lto.cy10a4_gcp_c2s30 | 765 | 3965 | 7960 |
| target | 800 | 4000 | 8000 |
l.i0
l.i0: load without secondary indexes. Graphs for performance per 1-second interval are here.
Average throughput:
Insert response time histogram: each cell has the percentage of responses that take <= the time in the header and max is the max response time in seconds. For the max column values in the top 25% of the range have a red background and in the bottom 25% of the range have a green background. The red background is not used when the min value is within 80% of the max value.
| dbms | 256us | 1ms | 4ms | 16ms | 64ms | 256ms | 1s | 4s | 16s | gt | max |
|---|---|---|---|---|---|---|---|---|---|---|---|
| my5740_rel_lto.cy10a_gcp_c2s30 | 97.481 | 2.458 | 0.033 | 0.012 | 0.015 | 0.238 | |||||
| my5740_rel_lto.cy10a1_gcp_c2s30 | 96.085 | 3.846 | 0.040 | 0.014 | 0.015 | 0.248 | |||||
| my5740_rel_lto.cy10a2_gcp_c2s30 | 96.366 | 3.571 | 0.037 | 0.013 | 0.014 | nonzero | 0.256 | ||||
| my5740_rel_lto.cy10a3_gcp_c2s30 | 96.686 | 3.241 | 0.041 | 0.015 | 0.017 | 0.234 | |||||
| my5740_rel_lto.cy10a4_gcp_c2s30 | 96.658 | 3.099 | 0.208 | 0.021 | 0.014 | 0.249 |
Performance metrics for the DBMS listed above. Some are normalized by throughput, others are not. Legend for results is here.
ips	qps	rps	rmbps	wps	wmbps	rpq	rkbpq	wpi	wkbpi	csps	cpups	cspq	cpupq	dbgb1	dbgb2	rss	maxop	p50	p99	tag
808081	0	0	0.0	1486.7	156.7	0.000	0.000	0.002	0.199	80587	69.7	0.100	13	10.6	139.1	17.2	0.238	112878	86207	160m.my5740_rel_lto.cy10a_gcp_c2s30
796020	0	0	0.0	1466.7	153.1	0.000	0.000	0.002	0.197	80648	69.4	0.101	13	10.6	139.1	17.2	0.248	110080	82511	160m.my5740_rel_lto.cy10a1_gcp_c2s30
800000	0	0	0.0	1544.2	155.9	0.000	0.000	0.002	0.200	79085	69.2	0.099	13	10.6	139.1	17.2	0.256	110581	82611	160m.my5740_rel_lto.cy10a2_gcp_c2s30
804020	0	0	0.0	1523.8	156.5	0.000	0.000	0.002	0.199	79931	69.8	0.099	13	10.6	139.1	17.2	0.234	110919	76318	160m.my5740_rel_lto.cy10a3_gcp_c2s30
800000	0	0	0.0	586.7	154.1	0.000	0.000	0.001	0.197	81289	69.9	0.102	13	10.6	139.1	17.2	0.249	111680	84608	160m.my5740_rel_lto.cy10a4_gcp_c2s30
l.x
l.x: create secondary indexes.
Average throughput:
Performance metrics for the DBMS listed above. Some are normalized by throughput, others are not. Legend for results is here.
ips	qps	rps	rmbps	wps	wmbps	rpq	rkbpq	wpi	wkbpi	csps	cpups	cspq	cpupq	dbgb1	dbgb2	rss	maxop	p50	p99	tag
1194776	0	0	0.0	14503.2	1069.3	0.000	0.000	0.012	0.916	47853	35.9	0.040	5	23.6	152.1	28.6	0.030	NA	NA	160m.my5740_rel_lto.cy10a_gcp_c2s30
1177206	0	0	0.0	13970.4	1063.1	0.000	0.000	0.012	0.925	84025	37.3	0.071	5	23.6	152.1	28.6	0.030	NA	NA	160m.my5740_rel_lto.cy10a1_gcp_c2s30
1270635	0	0	0.0	14336.7	1146.3	0.000	0.000	0.011	0.924	36946	35.7	0.029	4	23.6	152.1	28.6	0.030	NA	NA	160m.my5740_rel_lto.cy10a2_gcp_c2s30
1270635	0	0	0.0	14332.8	1147.4	0.000	0.000	0.011	0.925	38145	35.6	0.030	4	23.6	152.1	28.6	0.030	NA	NA	160m.my5740_rel_lto.cy10a3_gcp_c2s30
1046405	0	0	0.0	3825.7	925.8	0.000	0.000	0.004	0.906	48724	31.9	0.047	5	23.6	152.1	28.6	0.030	NA	NA	160m.my5740_rel_lto.cy10a4_gcp_c2s30
l.i1
l.i1: continue load after secondary indexes created. Graphs for performance per 1-second interval are here.
Average throughput:
Insert response time histogram: each cell has the percentage of responses that take <= the time in the header and max is the max response time in seconds. For the max column values in the top 25% of the range have a red background and in the bottom 25% of the range have a green background. The red background is not used when the min value is within 80% of the max value.
| dbms | 256us | 1ms | 4ms | 16ms | 64ms | 256ms | 1s | 4s | 16s | gt | max |
|---|---|---|---|---|---|---|---|---|---|---|---|
| my5740_rel_lto.cy10a_gcp_c2s30 | 89.927 | 10.006 | 0.051 | 0.016 | nonzero | 0.492 | |||||
| my5740_rel_lto.cy10a1_gcp_c2s30 | 91.415 | 8.525 | 0.045 | 0.016 | 0.242 | ||||||
| my5740_rel_lto.cy10a2_gcp_c2s30 | 89.200 | 10.748 | 0.036 | 0.015 | nonzero | 0.526 | |||||
| my5740_rel_lto.cy10a3_gcp_c2s30 | nonzero | 89.048 | 10.893 | 0.044 | 0.016 | nonzero | 0.529 | ||||
| my5740_rel_lto.cy10a4_gcp_c2s30 | 85.181 | 14.711 | 0.085 | 0.022 | nonzero | 0.370 |
Delete response time histogram: each cell has the percentage of responses that take <= the time in the header and max is the max response time in seconds. For the max column values in the top 25% of the range have a red background and in the bottom 25% of the range have a green background. The red background is not used when the min value is within 80% of the max value.
| dbms | 256us | 1ms | 4ms | 16ms | 64ms | 256ms | 1s | 4s | 16s | gt | max |
|---|---|---|---|---|---|---|---|---|---|---|---|
| my5740_rel_lto.cy10a_gcp_c2s30 | nonzero | 88.750 | 11.177 | 0.056 | 0.016 | nonzero | 0.494 | ||||
| my5740_rel_lto.cy10a1_gcp_c2s30 | nonzero | 91.211 | 8.723 | 0.051 | 0.015 | 0.240 | |||||
| my5740_rel_lto.cy10a2_gcp_c2s30 | nonzero | 88.258 | 11.684 | 0.042 | 0.016 | nonzero | 0.264 | ||||
| my5740_rel_lto.cy10a3_gcp_c2s30 | 0.001 | 88.088 | 11.847 | 0.047 | 0.016 | 0.001 | 0.531 | ||||
| my5740_rel_lto.cy10a4_gcp_c2s30 | 0.031 | 88.743 | 11.155 | 0.052 | 0.019 | nonzero | 0.296 |
Performance metrics for the DBMS listed above. Some are normalized by throughput, others are not. Legend for results is here.
ips	qps	rps	rmbps	wps	wmbps	rpq	rkbpq	wpi	wkbpi	csps	cpups	cspq	cpupq	dbgb1	dbgb2	rss	maxop	p50	p99	tag
139519	0	293	4.6	7157.8	276.7	0.002	0.034	0.051	2.031	56189	87.2	0.403	94	93.7	251.4	86.9	0.492	17681	13633	160m.my5740_rel_lto.cy10a_gcp_c2s30
140449	0	437	6.8	8137.9	313.5	0.003	0.050	0.058	2.286	68994	86.7	0.491	93	135.1	304.0	87.0	0.242	17787	13935	160m.my5740_rel_lto.cy10a1_gcp_c2s30
137717	0	294	4.6	8799.2	325.6	0.002	0.034	0.064	2.421	58399	87.1	0.424	95	94.0	251.9	87.0	0.526	17381	13540	160m.my5740_rel_lto.cy10a2_gcp_c2s30
137221	0	299	4.7	8713.4	322.8	0.002	0.035	0.063	2.409	58849	86.9	0.429	95	94.4	252.6	87.0	0.529	17381	13335	160m.my5740_rel_lto.cy10a3_gcp_c2s30
131406	0	34	5.4	5976.1	252.0	0.000	0.042	0.045	1.964	54881	84.5	0.418	96	94.1	252.0	86.9	0.370	16732	10838	160m.my5740_rel_lto.cy10a4_gcp_c2s30
q100.1
q100.1: range queries with 100 insert/s per client. Graphs for performance per 1-second interval are here.
Average throughput:
Query response time histogram: each cell has the percentage of responses that take <= the time in the header and max is the max response time in seconds. For max values in the top 25% of the range have a red background and in the bottom 25% of the range have a green background. The red background is not used when the min value is within 80% of the max value.
| dbms | 256us | 1ms | 4ms | 16ms | 64ms | 256ms | 1s | 4s | 16s | gt | max |
|---|---|---|---|---|---|---|---|---|---|---|---|
| my5740_rel_lto.cy10a_gcp_c2s30 | 99.614 | 0.376 | 0.009 | nonzero | nonzero | nonzero | 0.083 | ||||
| my5740_rel_lto.cy10a1_gcp_c2s30 | 98.639 | 1.249 | 0.111 | 0.001 | nonzero | nonzero | 0.188 | ||||
| my5740_rel_lto.cy10a2_gcp_c2s30 | 99.588 | 0.401 | 0.011 | nonzero | nonzero | nonzero | 0.081 | ||||
| my5740_rel_lto.cy10a3_gcp_c2s30 | 99.594 | 0.394 | 0.011 | 0.001 | nonzero | nonzero | 0.086 | ||||
| my5740_rel_lto.cy10a4_gcp_c2s30 | 99.576 | 0.361 | 0.054 | 0.007 | 0.002 | 0.001 | nonzero | nonzero | 2.009 |
Insert response time histogram: each cell has the percentage of responses that take <= the time in the header and max is the max response time in seconds. For max values in the top 25% of the range have a red background and in the bottom 25% of the range have a green background. The red background is not used when the min value is within 80% of the max value.
| dbms | 256us | 1ms | 4ms | 16ms | 64ms | 256ms | 1s | 4s | 16s | gt | max |
|---|---|---|---|---|---|---|---|---|---|---|---|
| my5740_rel_lto.cy10a_gcp_c2s30 | 94.542 | 5.406 | 0.052 | 0.026 | |||||||
| my5740_rel_lto.cy10a1_gcp_c2s30 | 93.535 | 6.372 | 0.090 | 0.003 | 0.065 | ||||||
| my5740_rel_lto.cy10a2_gcp_c2s30 | 95.750 | 4.215 | 0.035 | 0.023 | |||||||
| my5740_rel_lto.cy10a3_gcp_c2s30 | 94.924 | 5.031 | 0.045 | 0.022 | |||||||
| my5740_rel_lto.cy10a4_gcp_c2s30 | 88.271 | 11.062 | 0.510 | 0.135 | 0.021 | 0.363 |
Delete response time histogram: each cell has the percentage of responses that take <= the time in the header and max is the max response time in seconds. For max values in the top 25% of the range have a red background and in the bottom 25% of the range have a green background. The red background is not used when the min value is within 80% of the max value.
| dbms | 256us | 1ms | 4ms | 16ms | 64ms | 256ms | 1s | 4s | 16s | gt | max |
|---|---|---|---|---|---|---|---|---|---|---|---|
| my5740_rel_lto.cy10a_gcp_c2s30 | 95.677 | 4.274 | 0.049 | 0.047 | |||||||
| my5740_rel_lto.cy10a1_gcp_c2s30 | 97.587 | 2.354 | 0.059 | 0.032 | |||||||
| my5740_rel_lto.cy10a2_gcp_c2s30 | 96.306 | 3.670 | 0.024 | 0.023 | |||||||
| my5740_rel_lto.cy10a3_gcp_c2s30 | 95.431 | 4.538 | 0.031 | 0.022 | |||||||
| my5740_rel_lto.cy10a4_gcp_c2s30 | 0.010 | 90.934 | 8.649 | 0.337 | 0.066 | 0.003 | 0.270 |
Performance metrics for the DBMS listed above. Some are normalized by throughput, others are not. Legend for results is here.
ips	qps	rps	rmbps	wps	wmbps	rpq	rkbpq	wpi	wkbpi	csps	cpups	cspq	cpupq	dbgb1	dbgb2	rss	maxop	p50	p99	tag
783	53059	1527	23.9	3558.4	108.9	0.029	0.460	4.545	142.467	181462	71.5	3.420	202	93.7	251.4	86.9	0.083	6777	6507	160m.my5740_rel_lto.cy10a_gcp_c2s30
741	45383	2678	41.8	8247.1	233.9	0.059	0.944	11.128	323.242	181292	66.7	3.995	220	135.1	304.1	86.9	0.188	6249	1822	160m.my5740_rel_lto.cy10a1_gcp_c2s30
786	52964	1547	24.2	3611.1	112.6	0.029	0.467	4.592	146.565	181219	71.5	3.422	202	94.0	251.9	86.9	0.081	6729	6459	160m.my5740_rel_lto.cy10a2_gcp_c2s30
785	53114	1591	24.9	3638.5	112.6	0.030	0.479	4.634	146.927	179960	72.0	3.388	203	94.4	252.6	86.9	0.086	6777	6521	160m.my5740_rel_lto.cy10a3_gcp_c2s30
765	51872	181	26.9	3286.2	108.3	0.003	0.531	4.297	145.088	173359	71.3	3.342	206	94.1	252.0	86.9	2.009	6777	4076	160m.my5740_rel_lto.cy10a4_gcp_c2s30
q500.1
q500.1: range queries with 500 insert/s per client. Graphs for performance per 1-second interval are here.
Average throughput:
Query response time histogram: each cell has the percentage of responses that take <= the time in the header and max is the max response time in seconds. For max values in the top 25% of the range have a red background and in the bottom 25% of the range have a green background. The red background is not used when the min value is within 80% of the max value.
| dbms | 256us | 1ms | 4ms | 16ms | 64ms | 256ms | 1s | 4s | 16s | gt | max |
|---|---|---|---|---|---|---|---|---|---|---|---|
| my5740_rel_lto.cy10a_gcp_c2s30 | 99.701 | 0.284 | 0.014 | 0.001 | nonzero | nonzero | 0.108 | ||||
| my5740_rel_lto.cy10a1_gcp_c2s30 | 99.447 | 0.538 | 0.013 | 0.002 | nonzero | nonzero | 0.081 | ||||
| my5740_rel_lto.cy10a2_gcp_c2s30 | 99.686 | 0.298 | 0.015 | 0.001 | nonzero | nonzero | 0.084 | ||||
| my5740_rel_lto.cy10a3_gcp_c2s30 | 99.655 | 0.328 | 0.016 | 0.001 | nonzero | 0.039 | |||||
| my5740_rel_lto.cy10a4_gcp_c2s30 | 99.657 | 0.312 | 0.028 | 0.003 | nonzero | nonzero | 0.091 |
Insert response time histogram: each cell has the percentage of responses that take <= the time in the header and max is the max response time in seconds. For max values in the top 25% of the range have a red background and in the bottom 25% of the range have a green background. The red background is not used when the min value is within 80% of the max value.
| dbms | 256us | 1ms | 4ms | 16ms | 64ms | 256ms | 1s | 4s | 16s | gt | max |
|---|---|---|---|---|---|---|---|---|---|---|---|
| my5740_rel_lto.cy10a_gcp_c2s30 | 95.542 | 4.438 | 0.020 | 0.030 | |||||||
| my5740_rel_lto.cy10a1_gcp_c2s30 | 96.222 | 3.710 | 0.068 | 0.040 | |||||||
| my5740_rel_lto.cy10a2_gcp_c2s30 | 94.293 | 5.658 | 0.047 | 0.001 | 0.087 | ||||||
| my5740_rel_lto.cy10a3_gcp_c2s30 | 96.848 | 3.138 | 0.015 | 0.038 | |||||||
| my5740_rel_lto.cy10a4_gcp_c2s30 | 92.628 | 7.185 | 0.184 | 0.002 | 0.114 |
Delete response time histogram: each cell has the percentage of responses that take <= the time in the header and max is the max response time in seconds. For max values in the top 25% of the range have a red background and in the bottom 25% of the range have a green background. The red background is not used when the min value is within 80% of the max value.
| dbms | 256us | 1ms | 4ms | 16ms | 64ms | 256ms | 1s | 4s | 16s | gt | max |
|---|---|---|---|---|---|---|---|---|---|---|---|
| my5740_rel_lto.cy10a_gcp_c2s30 | 0.054 | 97.059 | 2.872 | 0.015 | 0.048 | ||||||
| my5740_rel_lto.cy10a1_gcp_c2s30 | 97.989 | 1.986 | 0.025 | 0.036 | |||||||
| my5740_rel_lto.cy10a2_gcp_c2s30 | 0.040 | 96.330 | 3.597 | 0.033 | 0.001 | 0.091 | |||||
| my5740_rel_lto.cy10a3_gcp_c2s30 | 0.047 | 98.456 | 1.487 | 0.010 | 0.037 | ||||||
| my5740_rel_lto.cy10a4_gcp_c2s30 | 0.174 | 97.090 | 2.676 | 0.060 | 0.057 |
Performance metrics for the DBMS listed above. Some are normalized by throughput, others are not. Legend for results is here.
ips	qps	rps	rmbps	wps	wmbps	rpq	rkbpq	wpi	wkbpi	csps	cpups	cspq	cpupq	dbgb1	dbgb2	rss	maxop	p50	p99	tag
3967	56220	999	15.6	3949.9	130.7	0.018	0.284	0.996	33.737	178196	74.2	3.170	198	93.7	251.4	86.9	0.108	7080	6651	160m.my5740_rel_lto.cy10a_gcp_c2s30
3785	49240	1643	25.7	3806.8	108.7	0.033	0.534	1.006	29.413	180799	69.5	3.672	212	135.1	304.1	86.9	0.081	6537	6057	160m.my5740_rel_lto.cy10a1_gcp_c2s30
3967	55932	1007	15.7	4346.3	142.8	0.018	0.288	1.096	36.849	177895	74.2	3.181	199	94.0	251.9	86.9	0.084	7080	6665	160m.my5740_rel_lto.cy10a2_gcp_c2s30
3965	55418	984	15.4	4273.2	140.0	0.018	0.284	1.078	36.159	181803	73.1	3.281	198	94.4	252.6	86.9	0.039	6968	6617	160m.my5740_rel_lto.cy10a3_gcp_c2s30
3965	54827	92	12.2	3602.7	125.5	0.002	0.228	0.909	32.408	178224	74.4	3.251	204	94.1	252.0	86.9	0.091	6904	6505	160m.my5740_rel_lto.cy10a4_gcp_c2s30
q1000.1
q1000.1: range queries with 1000 insert/s per client. Graphs for performance per 1-second interval are here.
Average throughput:
Query response time histogram: each cell has the percentage of responses that take <= the time in the header and max is the max response time in seconds. For max values in the top 25% of the range have a red background and in the bottom 25% of the range have a green background. The red background is not used when the min value is within 80% of the max value.
| dbms | 256us | 1ms | 4ms | 16ms | 64ms | 256ms | 1s | 4s | 16s | gt | max |
|---|---|---|---|---|---|---|---|---|---|---|---|
| my5740_rel_lto.cy10a_gcp_c2s30 | 99.797 | 0.180 | 0.019 | 0.003 | nonzero | 0.025 | |||||
| my5740_rel_lto.cy10a1_gcp_c2s30 | 99.571 | 0.409 | 0.017 | 0.003 | nonzero | 0.062 | |||||
| my5740_rel_lto.cy10a2_gcp_c2s30 | 99.811 | 0.175 | 0.012 | 0.001 | nonzero | nonzero | 0.106 | ||||
| my5740_rel_lto.cy10a3_gcp_c2s30 | 99.756 | 0.212 | 0.026 | 0.005 | nonzero | 0.027 | |||||
| my5740_rel_lto.cy10a4_gcp_c2s30 | 99.804 | 0.168 | 0.023 | 0.005 | nonzero | nonzero | 0.092 |
Insert response time histogram: each cell has the percentage of responses that take <= the time in the header and max is the max response time in seconds. For max values in the top 25% of the range have a red background and in the bottom 25% of the range have a green background. The red background is not used when the min value is within 80% of the max value.
| dbms | 256us | 1ms | 4ms | 16ms | 64ms | 256ms | 1s | 4s | 16s | gt | max |
|---|---|---|---|---|---|---|---|---|---|---|---|
| my5740_rel_lto.cy10a_gcp_c2s30 | 95.443 | 4.494 | 0.064 | 0.029 | |||||||
| my5740_rel_lto.cy10a1_gcp_c2s30 | 95.927 | 4.013 | 0.060 | 0.033 | |||||||
| my5740_rel_lto.cy10a2_gcp_c2s30 | 98.575 | 1.403 | 0.022 | nonzero | 0.138 | ||||||
| my5740_rel_lto.cy10a3_gcp_c2s30 | 92.083 | 7.752 | 0.164 | 0.046 | |||||||
| my5740_rel_lto.cy10a4_gcp_c2s30 | 92.653 | 7.119 | 0.227 | nonzero | 0.122 |
Delete response time histogram: each cell has the percentage of responses that take <= the time in the header and max is the max response time in seconds. For max values in the top 25% of the range have a red background and in the bottom 25% of the range have a green background. The red background is not used when the min value is within 80% of the max value.
| dbms | 256us | 1ms | 4ms | 16ms | 64ms | 256ms | 1s | 4s | 16s | gt | max |
|---|---|---|---|---|---|---|---|---|---|---|---|
| my5740_rel_lto.cy10a_gcp_c2s30 | 0.077 | 96.115 | 3.753 | 0.054 | 0.031 | ||||||
| my5740_rel_lto.cy10a1_gcp_c2s30 | 0.011 | 97.423 | 2.528 | 0.038 | 0.030 | ||||||
| my5740_rel_lto.cy10a2_gcp_c2s30 | 0.092 | 98.753 | 1.136 | 0.018 | nonzero | 0.140 | |||||
| my5740_rel_lto.cy10a3_gcp_c2s30 | 0.014 | 93.374 | 6.477 | 0.135 | 0.035 | ||||||
| my5740_rel_lto.cy10a4_gcp_c2s30 | 0.271 | 95.397 | 4.203 | 0.130 | 0.059 |
Performance metrics for the DBMS listed above. Some are normalized by throughput, others are not. Legend for results is here.
ips	qps	rps	rmbps	wps	wmbps	rpq	rkbpq	wpi	wkbpi	csps	cpups	cspq	cpupq	dbgb1	dbgb2	rss	maxop	p50	p99	tag
7956	63902	131	2.0	1786.9	58.7	0.002	0.033	0.225	7.557	236311	62.1	3.698	146	93.7	251.4	86.9	0.025	8311	6747	160m.my5740_rel_lto.cy10a_gcp_c2s30
7725	51420	1167	18.2	3829.6	123.5	0.023	0.363	0.496	16.367	176258	72.4	3.428	211	135.1	304.1	86.9	0.062	6665	6409	160m.my5740_rel_lto.cy10a1_gcp_c2s30
7956	63449	151	2.4	2117.1	68.9	0.002	0.038	0.266	8.864	233781	62.7	3.685	148	94.0	251.9	86.9	0.106	8199	6856	160m.my5740_rel_lto.cy10a2_gcp_c2s30
7960	62525	184	2.9	2303.6	75.1	0.003	0.047	0.289	9.662	228581	63.8	3.656	153	94.4	252.6	86.9	0.027	8343	6681	160m.my5740_rel_lto.cy10a3_gcp_c2s30
7960	64620	51	1.9	1488.1	56.0	0.001	0.029	0.187	7.210	241241	61.4	3.733	143	94.1	252.0	86.9	0.092	8343	6636	160m.my5740_rel_lto.cy10a4_gcp_c2s30
l.i0
l.i0: load without secondary indexes
Performance metrics for all DBMS, not just the ones listed above. Some are normalized by throughput, others are not. Legend for results is here.
ips	qps	rps	rmbps	wps	wmbps	rpq	rkbpq	wpi	wkbpi	csps	cpups	cspq	cpupq	dbgb1	dbgb2	rss	maxop	p50	p99	tag
808081	0	0	0.0	1486.7	156.7	0.000	0.000	0.002	0.199	80587	69.7	0.100	13	10.6	139.1	17.2	0.238	112878	86207	160m.my5740_rel_lto.cy10a_gcp_c2s30
796020	0	0	0.0	1466.7	153.1	0.000	0.000	0.002	0.197	80648	69.4	0.101	13	10.6	139.1	17.2	0.248	110080	82511	160m.my5740_rel_lto.cy10a1_gcp_c2s30
800000	0	0	0.0	1544.2	155.9	0.000	0.000	0.002	0.200	79085	69.2	0.099	13	10.6	139.1	17.2	0.256	110581	82611	160m.my5740_rel_lto.cy10a2_gcp_c2s30
804020	0	0	0.0	1523.8	156.5	0.000	0.000	0.002	0.199	79931	69.8	0.099	13	10.6	139.1	17.2	0.234	110919	76318	160m.my5740_rel_lto.cy10a3_gcp_c2s30
800000	0	0	0.0	586.7	154.1	0.000	0.000	0.001	0.197	81289	69.9	0.102	13	10.6	139.1	17.2	0.249	111680	84608	160m.my5740_rel_lto.cy10a4_gcp_c2s30
l.x
l.x: create secondary indexes
Performance metrics for all DBMS, not just the ones listed above. Some are normalized by throughput, others are not. Legend for results is here.
ips	qps	rps	rmbps	wps	wmbps	rpq	rkbpq	wpi	wkbpi	csps	cpups	cspq	cpupq	dbgb1	dbgb2	rss	maxop	p50	p99	tag
1194776	0	0	0.0	14503.2	1069.3	0.000	0.000	0.012	0.916	47853	35.9	0.040	5	23.6	152.1	28.6	0.030	NA	NA	160m.my5740_rel_lto.cy10a_gcp_c2s30
1177206	0	0	0.0	13970.4	1063.1	0.000	0.000	0.012	0.925	84025	37.3	0.071	5	23.6	152.1	28.6	0.030	NA	NA	160m.my5740_rel_lto.cy10a1_gcp_c2s30
1270635	0	0	0.0	14336.7	1146.3	0.000	0.000	0.011	0.924	36946	35.7	0.029	4	23.6	152.1	28.6	0.030	NA	NA	160m.my5740_rel_lto.cy10a2_gcp_c2s30
1270635	0	0	0.0	14332.8	1147.4	0.000	0.000	0.011	0.925	38145	35.6	0.030	4	23.6	152.1	28.6	0.030	NA	NA	160m.my5740_rel_lto.cy10a3_gcp_c2s30
1046405	0	0	0.0	3825.7	925.8	0.000	0.000	0.004	0.906	48724	31.9	0.047	5	23.6	152.1	28.6	0.030	NA	NA	160m.my5740_rel_lto.cy10a4_gcp_c2s30
l.i1
l.i1: continue load after secondary indexes created
Performance metrics for all DBMS, not just the ones listed above. Some are normalized by throughput, others are not. Legend for results is here.
ips	qps	rps	rmbps	wps	wmbps	rpq	rkbpq	wpi	wkbpi	csps	cpups	cspq	cpupq	dbgb1	dbgb2	rss	maxop	p50	p99	tag
139519	0	293	4.6	7157.8	276.7	0.002	0.034	0.051	2.031	56189	87.2	0.403	94	93.7	251.4	86.9	0.492	17681	13633	160m.my5740_rel_lto.cy10a_gcp_c2s30
140449	0	437	6.8	8137.9	313.5	0.003	0.050	0.058	2.286	68994	86.7	0.491	93	135.1	304.0	87.0	0.242	17787	13935	160m.my5740_rel_lto.cy10a1_gcp_c2s30
137717	0	294	4.6	8799.2	325.6	0.002	0.034	0.064	2.421	58399	87.1	0.424	95	94.0	251.9	87.0	0.526	17381	13540	160m.my5740_rel_lto.cy10a2_gcp_c2s30
137221	0	299	4.7	8713.4	322.8	0.002	0.035	0.063	2.409	58849	86.9	0.429	95	94.4	252.6	87.0	0.529	17381	13335	160m.my5740_rel_lto.cy10a3_gcp_c2s30
131406	0	34	5.4	5976.1	252.0	0.000	0.042	0.045	1.964	54881	84.5	0.418	96	94.1	252.0	86.9	0.370	16732	10838	160m.my5740_rel_lto.cy10a4_gcp_c2s30
q100.1
q100.1: range queries with 100 insert/s per client
Performance metrics for all DBMS, not just the ones listed above. Some are normalized by throughput, others are not. Legend for results is here.
ips	qps	rps	rmbps	wps	wmbps	rpq	rkbpq	wpi	wkbpi	csps	cpups	cspq	cpupq	dbgb1	dbgb2	rss	maxop	p50	p99	tag
783	53059	1527	23.9	3558.4	108.9	0.029	0.460	4.545	142.467	181462	71.5	3.420	202	93.7	251.4	86.9	0.083	6777	6507	160m.my5740_rel_lto.cy10a_gcp_c2s30
741	45383	2678	41.8	8247.1	233.9	0.059	0.944	11.128	323.242	181292	66.7	3.995	220	135.1	304.1	86.9	0.188	6249	1822	160m.my5740_rel_lto.cy10a1_gcp_c2s30
786	52964	1547	24.2	3611.1	112.6	0.029	0.467	4.592	146.565	181219	71.5	3.422	202	94.0	251.9	86.9	0.081	6729	6459	160m.my5740_rel_lto.cy10a2_gcp_c2s30
785	53114	1591	24.9	3638.5	112.6	0.030	0.479	4.634	146.927	179960	72.0	3.388	203	94.4	252.6	86.9	0.086	6777	6521	160m.my5740_rel_lto.cy10a3_gcp_c2s30
765	51872	181	26.9	3286.2	108.3	0.003	0.531	4.297	145.088	173359	71.3	3.342	206	94.1	252.0	86.9	2.009	6777	4076	160m.my5740_rel_lto.cy10a4_gcp_c2s30
q500.1
q500.1: range queries with 500 insert/s per client
Performance metrics for all DBMS, not just the ones listed above. Some are normalized by throughput, others are not. Legend for results is here.
ips	qps	rps	rmbps	wps	wmbps	rpq	rkbpq	wpi	wkbpi	csps	cpups	cspq	cpupq	dbgb1	dbgb2	rss	maxop	p50	p99	tag
3967	56220	999	15.6	3949.9	130.7	0.018	0.284	0.996	33.737	178196	74.2	3.170	198	93.7	251.4	86.9	0.108	7080	6651	160m.my5740_rel_lto.cy10a_gcp_c2s30
3785	49240	1643	25.7	3806.8	108.7	0.033	0.534	1.006	29.413	180799	69.5	3.672	212	135.1	304.1	86.9	0.081	6537	6057	160m.my5740_rel_lto.cy10a1_gcp_c2s30
3967	55932	1007	15.7	4346.3	142.8	0.018	0.288	1.096	36.849	177895	74.2	3.181	199	94.0	251.9	86.9	0.084	7080	6665	160m.my5740_rel_lto.cy10a2_gcp_c2s30
3965	55418	984	15.4	4273.2	140.0	0.018	0.284	1.078	36.159	181803	73.1	3.281	198	94.4	252.6	86.9	0.039	6968	6617	160m.my5740_rel_lto.cy10a3_gcp_c2s30
3965	54827	92	12.2	3602.7	125.5	0.002	0.228	0.909	32.408	178224	74.4	3.251	204	94.1	252.0	86.9	0.091	6904	6505	160m.my5740_rel_lto.cy10a4_gcp_c2s30
q1000.1
q1000.1: range queries with 1000 insert/s per client
Performance metrics for all DBMS, not just the ones listed above. Some are normalized by throughput, others are not. Legend for results is here.
ips	qps	rps	rmbps	wps	wmbps	rpq	rkbpq	wpi	wkbpi	csps	cpups	cspq	cpupq	dbgb1	dbgb2	rss	maxop	p50	p99	tag
7956	63902	131	2.0	1786.9	58.7	0.002	0.033	0.225	7.557	236311	62.1	3.698	146	93.7	251.4	86.9	0.025	8311	6747	160m.my5740_rel_lto.cy10a_gcp_c2s30
7725	51420	1167	18.2	3829.6	123.5	0.023	0.363	0.496	16.367	176258	72.4	3.428	211	135.1	304.1	86.9	0.062	6665	6409	160m.my5740_rel_lto.cy10a1_gcp_c2s30
7956	63449	151	2.4	2117.1	68.9	0.002	0.038	0.266	8.864	233781	62.7	3.685	148	94.0	251.9	86.9	0.106	8199	6856	160m.my5740_rel_lto.cy10a2_gcp_c2s30
7960	62525	184	2.9	2303.6	75.1	0.003	0.047	0.289	9.662	228581	63.8	3.656	153	94.4	252.6	86.9	0.027	8343	6681	160m.my5740_rel_lto.cy10a3_gcp_c2s30
7960	64620	51	1.9	1488.1	56.0	0.001	0.029	0.187	7.210	241241	61.4	3.733	143	94.1	252.0	86.9	0.092	8343	6636	160m.my5740_rel_lto.cy10a4_gcp_c2s30
l.i0
- l.i0: load without secondary indexes
- Legend for results is here.
- Each entry lists the percentage of responses that fit in that bucket (slower than max time for previous bucket, faster than min time for next bucket).
Insert response time histogram
256us	1ms	4ms	16ms	64ms	256ms	1s	4s	16s	gt	max	tag
0.000	97.481	2.458	0.033	0.012	0.015	0.000	0.000	0.000	0.000	0.238	my5740_rel_lto.cy10a_gcp_c2s30
0.000	96.085	3.846	0.040	0.014	0.015	0.000	0.000	0.000	0.000	0.248	my5740_rel_lto.cy10a1_gcp_c2s30
0.000	96.366	3.571	0.037	0.013	0.014	nonzero	0.000	0.000	0.000	0.256	my5740_rel_lto.cy10a2_gcp_c2s30
0.000	96.686	3.241	0.041	0.015	0.017	0.000	0.000	0.000	0.000	0.234	my5740_rel_lto.cy10a3_gcp_c2s30
0.000	96.658	3.099	0.208	0.021	0.014	0.000	0.000	0.000	0.000	0.249	my5740_rel_lto.cy10a4_gcp_c2s30
l.x
- l.x: create secondary indexes
- Legend for results is here.
- Each entry lists the percentage of responses that fit in that bucket (slower than max time for previous bucket, faster than min time for next bucket).
TODO - determine whether there is data for create index response time
l.i1
- l.i1: continue load after secondary indexes created
- Legend for results is here.
- Each entry lists the percentage of responses that fit in that bucket (slower than max time for previous bucket, faster than min time for next bucket).
Insert response time histogram
256us	1ms	4ms	16ms	64ms	256ms	1s	4s	16s	gt	max	tag
0.000	0.000	89.927	10.006	0.051	0.016	nonzero	0.000	0.000	0.000	0.492	my5740_rel_lto.cy10a_gcp_c2s30
0.000	0.000	91.415	8.525	0.045	0.016	0.000	0.000	0.000	0.000	0.242	my5740_rel_lto.cy10a1_gcp_c2s30
0.000	0.000	89.200	10.748	0.036	0.015	nonzero	0.000	0.000	0.000	0.526	my5740_rel_lto.cy10a2_gcp_c2s30
0.000	nonzero	89.048	10.893	0.044	0.016	nonzero	0.000	0.000	0.000	0.529	my5740_rel_lto.cy10a3_gcp_c2s30
0.000	0.000	85.181	14.711	0.085	0.022	nonzero	0.000	0.000	0.000	0.370	my5740_rel_lto.cy10a4_gcp_c2s30
Delete response time histogram
256us	1ms	4ms	16ms	64ms	256ms	1s	4s	16s	gt	max	tag
0.000	nonzero	88.750	11.177	0.056	0.016	nonzero	0.000	0.000	0.000	0.494	my5740_rel_lto.cy10a_gcp_c2s30
0.000	nonzero	91.211	8.723	0.051	0.015	0.000	0.000	0.000	0.000	0.240	my5740_rel_lto.cy10a1_gcp_c2s30
0.000	nonzero	88.258	11.684	0.042	0.016	nonzero	0.000	0.000	0.000	0.264	my5740_rel_lto.cy10a2_gcp_c2s30
0.000	0.001	88.088	11.847	0.047	0.016	0.001	0.000	0.000	0.000	0.531	my5740_rel_lto.cy10a3_gcp_c2s30
0.000	0.031	88.743	11.155	0.052	0.019	nonzero	0.000	0.000	0.000	0.296	my5740_rel_lto.cy10a4_gcp_c2s30
q100.1
- q100.1: range queries with 100 insert/s per client
- Legend for results is here.
- Each entry lists the percentage of responses that fit in that bucket (slower than max time for previous bucket, faster than min time for next bucket).
Query response time histogram
256us	1ms	4ms	16ms	64ms	256ms	1s	4s	16s	gt	max	tag
99.614	0.376	0.009	nonzero	nonzero	nonzero	0.000	0.000	0.000	0.000	0.083	my5740_rel_lto.cy10a_gcp_c2s30
98.639	1.249	0.111	0.001	nonzero	nonzero	0.000	0.000	0.000	0.000	0.188	my5740_rel_lto.cy10a1_gcp_c2s30
99.588	0.401	0.011	nonzero	nonzero	nonzero	0.000	0.000	0.000	0.000	0.081	my5740_rel_lto.cy10a2_gcp_c2s30
99.594	0.394	0.011	0.001	nonzero	nonzero	0.000	0.000	0.000	0.000	0.086	my5740_rel_lto.cy10a3_gcp_c2s30
99.576	0.361	0.054	0.007	0.002	0.001	nonzero	nonzero	0.000	0.000	2.009	my5740_rel_lto.cy10a4_gcp_c2s30
Insert response time histogram
256us	1ms	4ms	16ms	64ms	256ms	1s	4s	16s	gt	max	tag
0.000	0.000	94.542	5.406	0.052	0.000	0.000	0.000	0.000	0.000	0.026	my5740_rel_lto.cy10a_gcp_c2s30
0.000	0.000	93.535	6.372	0.090	0.003	0.000	0.000	0.000	0.000	0.065	my5740_rel_lto.cy10a1_gcp_c2s30
0.000	0.000	95.750	4.215	0.035	0.000	0.000	0.000	0.000	0.000	0.023	my5740_rel_lto.cy10a2_gcp_c2s30
0.000	0.000	94.924	5.031	0.045	0.000	0.000	0.000	0.000	0.000	0.022	my5740_rel_lto.cy10a3_gcp_c2s30
0.000	0.000	88.271	11.062	0.510	0.135	0.021	0.000	0.000	0.000	0.363	my5740_rel_lto.cy10a4_gcp_c2s30
Delete response time histogram
256us	1ms	4ms	16ms	64ms	256ms	1s	4s	16s	gt	max	tag
0.000	0.000	95.677	4.274	0.049	0.000	0.000	0.000	0.000	0.000	0.047	my5740_rel_lto.cy10a_gcp_c2s30
0.000	0.000	97.587	2.354	0.059	0.000	0.000	0.000	0.000	0.000	0.032	my5740_rel_lto.cy10a1_gcp_c2s30
0.000	0.000	96.306	3.670	0.024	0.000	0.000	0.000	0.000	0.000	0.023	my5740_rel_lto.cy10a2_gcp_c2s30
0.000	0.000	95.431	4.538	0.031	0.000	0.000	0.000	0.000	0.000	0.022	my5740_rel_lto.cy10a3_gcp_c2s30
0.000	0.010	90.934	8.649	0.337	0.066	0.003	0.000	0.000	0.000	0.270	my5740_rel_lto.cy10a4_gcp_c2s30
q500.1
- q500.1: range queries with 500 insert/s per client
- Legend for results is here.
- Each entry lists the percentage of responses that fit in that bucket (slower than max time for previous bucket, faster than min time for next bucket).
Query response time histogram
256us	1ms	4ms	16ms	64ms	256ms	1s	4s	16s	gt	max	tag
99.701	0.284	0.014	0.001	nonzero	nonzero	0.000	0.000	0.000	0.000	0.108	my5740_rel_lto.cy10a_gcp_c2s30
99.447	0.538	0.013	0.002	nonzero	nonzero	0.000	0.000	0.000	0.000	0.081	my5740_rel_lto.cy10a1_gcp_c2s30
99.686	0.298	0.015	0.001	nonzero	nonzero	0.000	0.000	0.000	0.000	0.084	my5740_rel_lto.cy10a2_gcp_c2s30
99.655	0.328	0.016	0.001	nonzero	0.000	0.000	0.000	0.000	0.000	0.039	my5740_rel_lto.cy10a3_gcp_c2s30
99.657	0.312	0.028	0.003	nonzero	nonzero	0.000	0.000	0.000	0.000	0.091	my5740_rel_lto.cy10a4_gcp_c2s30
Insert response time histogram
256us	1ms	4ms	16ms	64ms	256ms	1s	4s	16s	gt	max	tag
0.000	0.000	95.542	4.438	0.020	0.000	0.000	0.000	0.000	0.000	0.030	my5740_rel_lto.cy10a_gcp_c2s30
0.000	0.000	96.222	3.710	0.068	0.000	0.000	0.000	0.000	0.000	0.040	my5740_rel_lto.cy10a1_gcp_c2s30
0.000	0.000	94.293	5.658	0.047	0.001	0.000	0.000	0.000	0.000	0.087	my5740_rel_lto.cy10a2_gcp_c2s30
0.000	0.000	96.848	3.138	0.015	0.000	0.000	0.000	0.000	0.000	0.038	my5740_rel_lto.cy10a3_gcp_c2s30
0.000	0.000	92.628	7.185	0.184	0.002	0.000	0.000	0.000	0.000	0.114	my5740_rel_lto.cy10a4_gcp_c2s30
Delete response time histogram
256us	1ms	4ms	16ms	64ms	256ms	1s	4s	16s	gt	max	tag
0.000	0.054	97.059	2.872	0.015	0.000	0.000	0.000	0.000	0.000	0.048	my5740_rel_lto.cy10a_gcp_c2s30
0.000	0.000	97.989	1.986	0.025	0.000	0.000	0.000	0.000	0.000	0.036	my5740_rel_lto.cy10a1_gcp_c2s30
0.000	0.040	96.330	3.597	0.033	0.001	0.000	0.000	0.000	0.000	0.091	my5740_rel_lto.cy10a2_gcp_c2s30
0.000	0.047	98.456	1.487	0.010	0.000	0.000	0.000	0.000	0.000	0.037	my5740_rel_lto.cy10a3_gcp_c2s30
0.000	0.174	97.090	2.676	0.060	0.000	0.000	0.000	0.000	0.000	0.057	my5740_rel_lto.cy10a4_gcp_c2s30
q1000.1
- q1000.1: range queries with 1000 insert/s per client
- Legend for results is here.
- Each entry lists the percentage of responses that fit in that bucket (slower than max time for previous bucket, faster than min time for next bucket).
Query response time histogram
256us	1ms	4ms	16ms	64ms	256ms	1s	4s	16s	gt	max	tag
99.797	0.180	0.019	0.003	nonzero	0.000	0.000	0.000	0.000	0.000	0.025	my5740_rel_lto.cy10a_gcp_c2s30
99.571	0.409	0.017	0.003	nonzero	0.000	0.000	0.000	0.000	0.000	0.062	my5740_rel_lto.cy10a1_gcp_c2s30
99.811	0.175	0.012	0.001	nonzero	nonzero	0.000	0.000	0.000	0.000	0.106	my5740_rel_lto.cy10a2_gcp_c2s30
99.756	0.212	0.026	0.005	nonzero	0.000	0.000	0.000	0.000	0.000	0.027	my5740_rel_lto.cy10a3_gcp_c2s30
99.804	0.168	0.023	0.005	nonzero	nonzero	0.000	0.000	0.000	0.000	0.092	my5740_rel_lto.cy10a4_gcp_c2s30
Insert response time histogram
256us	1ms	4ms	16ms	64ms	256ms	1s	4s	16s	gt	max	tag
0.000	0.000	95.443	4.494	0.064	0.000	0.000	0.000	0.000	0.000	0.029	my5740_rel_lto.cy10a_gcp_c2s30
0.000	0.000	95.927	4.013	0.060	0.000	0.000	0.000	0.000	0.000	0.033	my5740_rel_lto.cy10a1_gcp_c2s30
0.000	0.000	98.575	1.403	0.022	nonzero	0.000	0.000	0.000	0.000	0.138	my5740_rel_lto.cy10a2_gcp_c2s30
0.000	0.000	92.083	7.752	0.164	0.000	0.000	0.000	0.000	0.000	0.046	my5740_rel_lto.cy10a3_gcp_c2s30
0.000	0.000	92.653	7.119	0.227	nonzero	0.000	0.000	0.000	0.000	0.122	my5740_rel_lto.cy10a4_gcp_c2s30
Delete response time histogram
256us	1ms	4ms	16ms	64ms	256ms	1s	4s	16s	gt	max	tag
0.000	0.077	96.115	3.753	0.054	0.000	0.000	0.000	0.000	0.000	0.031	my5740_rel_lto.cy10a_gcp_c2s30
0.000	0.011	97.423	2.528	0.038	0.000	0.000	0.000	0.000	0.000	0.030	my5740_rel_lto.cy10a1_gcp_c2s30
0.000	0.092	98.753	1.136	0.018	nonzero	0.000	0.000	0.000	0.000	0.140	my5740_rel_lto.cy10a2_gcp_c2s30
0.000	0.014	93.374	6.477	0.135	0.000	0.000	0.000	0.000	0.000	0.035	my5740_rel_lto.cy10a3_gcp_c2s30
0.000	0.271	95.397	4.203	0.130	0.000	0.000	0.000	0.000	0.000	0.059	my5740_rel_lto.cy10a4_gcp_c2s30