Introduction
This is a report for the insert benchmark with 160M docs and 8 client(s). It is generated by scripts (bash, awk, sed) and Tufte might not be impressed. An overview of the insert benchmark is here and a short update is here. Below, by DBMS, I mean DBMS+version.config. An example is my8020.c10b40 where my means MySQL, 8020 is version 8.0.20 and c10b40 is the name for the configuration file.
The test server is a c2-standard-30 from GCP with 15 cores, hyperthreads disabled, 120G RAM, XFS + SW RAID 0 on 4 NVMe devices (1.5TB). The benchmark was run with 8 client and there were 1 or 3 connections per client (1 for queries or inserts without rate limits, 1+1 for rate limited inserts+deletes). There are 8 tables, client per table. It loads 160M rows without secondary indexes, creates secondary indexes, then inserts 800M rows with a delete per insert to avoid growing the table. It then does 3 read+write tests for 1800s each that do queries as fast as possible with 100, 500 and then 1000 inserts/second/client concurrent with the queries and 1000 deletes/second to avoid growing the table. The database is cached by InnoDB and the only IO is for writes.
The tested DBMS are:
- my5651_rel.cy10a_gcp_c2s30 - InnoDB and MySQL 5.6.51, rel build, cy10a_gcp_c2s30 config, compiled with CMAKE_BUILD_TYPE=Release -O2, base config
- my5651_rel.cy10a1_gcp_c2s30 - InnoDB and MySQL 5.6.51, rel build, cy10a_gcp_c2s30 config, compiled with CMAKE_BUILD_TYPE=Release -O2, adds innodb_use_native_aio=off
- my5651_rel.cy10a2_gcp_c2s30 - InnoDB and MySQL 5.6.51, rel build, cy10a_gcp_c2s30 config, compiled with CMAKE_BUILD_TYPE=Release -O2, adds innodb_io_capacity=20k, innodb_io_capacity_max=40k
- my5651_rel.cy10a4_gcp_c2s30 - InnoDB and MySQL 5.6.51, rel build, cy10a_gcp_c2s30 config, compiled with CMAKE_BUILD_TYPE=Release -O2, adds innodb_flush_method=fsync
Contents
- Summary
- l.i0: load without secondary indexes
- l.x: create secondary indexes
- l.i1: continue load after secondary indexes created
- q100.1: range queries with 100 insert/s per client
- q500.1: range queries with 500 insert/s per client
- q1000.1: range queries with 1000 insert/s per client
Summary
The numbers are inserts/s for l.i0 and l.i1, indexed docs (or rows) /s for l.x and queries/s for q*.2. The values are the average rate over the entire test for inserts (IPS) and queries (QPS). The range of values for IPS and QPS is split into 3 parts: bottom 25%, middle 50%, top 25%. Values in the bottom 25% have a red background, values in the top 25% have a green background and values in the middle have no color. A gray background is used for values that can be ignored because the DBMS did not sustain the target insert rate. Red backgrounds are not used when the minimum value is within 80% of the max value.
| dbms | l.i0 | l.x | l.i1 | q100.1 | q500.1 | q1000.1 |
|---|---|---|---|---|---|---|
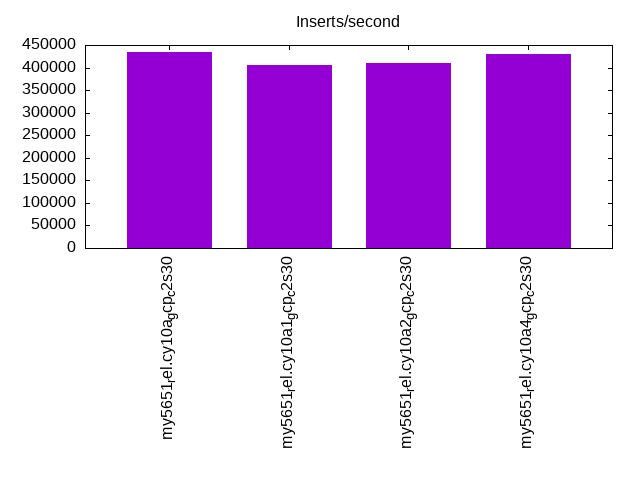
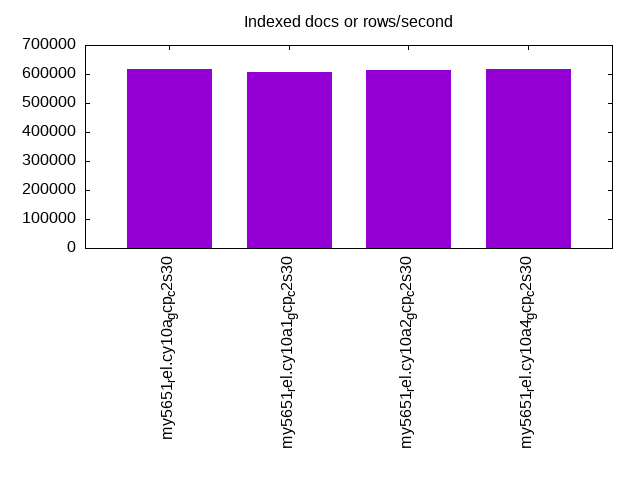
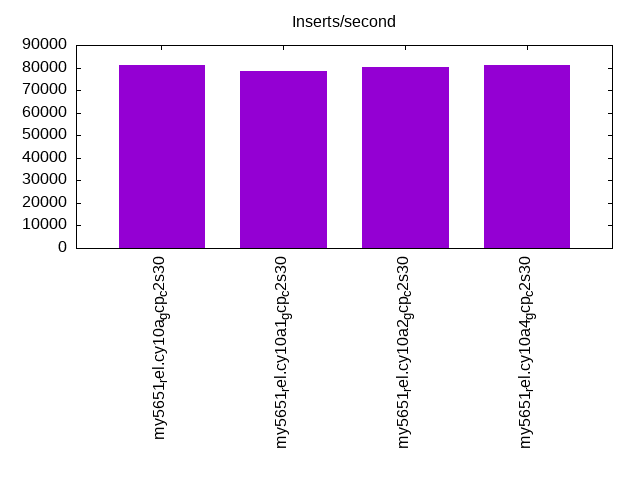
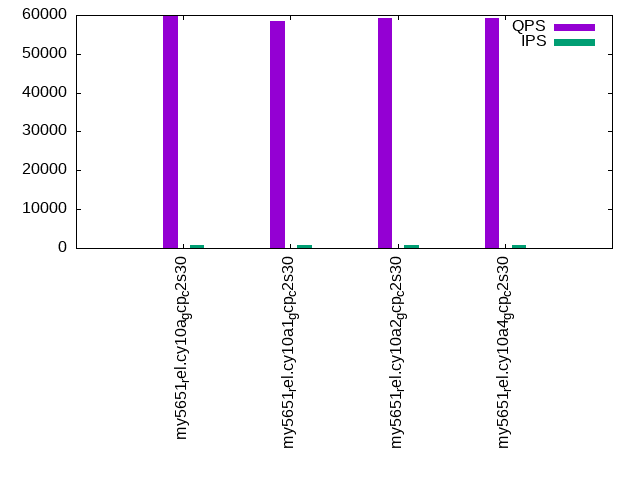
| my5651_rel.cy10a_gcp_c2s30 | 433604 | 618147 | 81202 | 59927 | 64203 | 74452 |
| my5651_rel.cy10a1_gcp_c2s30 | 406091 | 606439 | 78354 | 58526 | 60949 | 73120 |
| my5651_rel.cy10a2_gcp_c2s30 | 410256 | 613410 | 80345 | 59182 | 61604 | 73602 |
| my5651_rel.cy10a4_gcp_c2s30 | 428954 | 618147 | 81045 | 59340 | 66341 | 73473 |
This table has relative throughput, throughput for the DBMS relative to the DBMS in the first line, using the absolute throughput from the previous table. Values less than 0.95 have a yellow background. Values greater than 1.05 have a blue background.
| dbms | l.i0 | l.x | l.i1 | q100.1 | q500.1 | q1000.1 |
|---|---|---|---|---|---|---|
| my5651_rel.cy10a_gcp_c2s30 | 1.00 | 1.00 | 1.00 | 1.00 | 1.00 | 1.00 |
| my5651_rel.cy10a1_gcp_c2s30 | 0.94 | 0.98 | 0.96 | 0.98 | 0.95 | 0.98 |
| my5651_rel.cy10a2_gcp_c2s30 | 0.95 | 0.99 | 0.99 | 0.99 | 0.96 | 0.99 |
| my5651_rel.cy10a4_gcp_c2s30 | 0.99 | 1.00 | 1.00 | 0.99 | 1.03 | 0.99 |
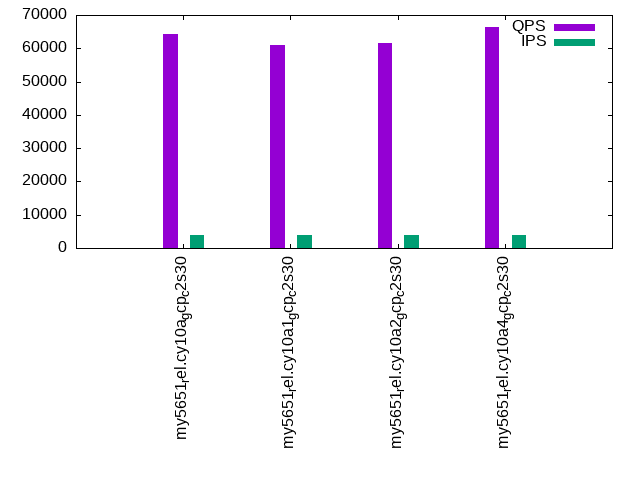
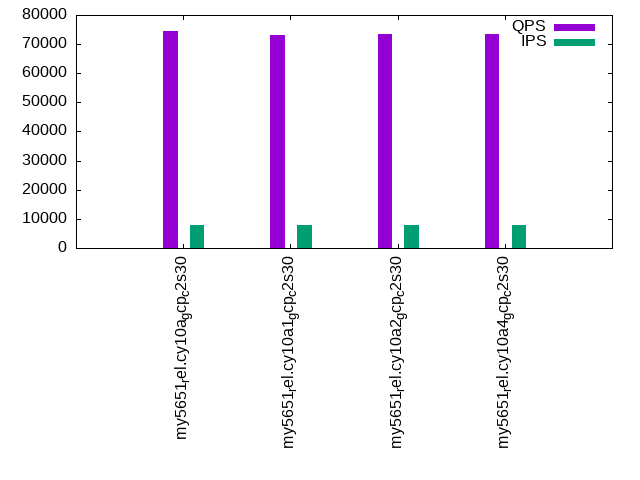
This lists the average rate of inserts/s for the tests that do inserts concurrent with queries. For such tests the query rate is listed in the table above. The read+write tests are setup so that the insert rate should match the target rate every second. Cells that are not at least 95% of the target have a red background to indicate a failure to satisfy the target.
| dbms | q100.1 | q500.1 | q1000.1 |
|---|---|---|---|
| my5651_rel.cy10a_gcp_c2s30 | 783 | 3962 | 7960 |
| my5651_rel.cy10a1_gcp_c2s30 | 778 | 3958 | 7960 |
| my5651_rel.cy10a2_gcp_c2s30 | 783 | 3965 | 7960 |
| my5651_rel.cy10a4_gcp_c2s30 | 773 | 3967 | 7960 |
| target | 800 | 4000 | 8000 |
l.i0
l.i0: load without secondary indexes. Graphs for performance per 1-second interval are here.
Average throughput:
Insert response time histogram: each cell has the percentage of responses that take <= the time in the header and max is the max response time in seconds. For the max column values in the top 25% of the range have a red background and in the bottom 25% of the range have a green background. The red background is not used when the min value is within 80% of the max value.
| dbms | 256us | 1ms | 4ms | 16ms | 64ms | 256ms | 1s | 4s | 16s | gt | max |
|---|---|---|---|---|---|---|---|---|---|---|---|
| my5651_rel.cy10a_gcp_c2s30 | 2.235 | 97.528 | 0.066 | 0.156 | 0.014 | 0.240 | |||||
| my5651_rel.cy10a1_gcp_c2s30 | 2.187 | 97.528 | 0.096 | 0.167 | 0.021 | 0.001 | 0.521 | ||||
| my5651_rel.cy10a2_gcp_c2s30 | 2.129 | 97.591 | 0.097 | 0.169 | 0.014 | 0.214 | |||||
| my5651_rel.cy10a4_gcp_c2s30 | 2.224 | 97.403 | 0.196 | 0.162 | 0.014 | 0.195 |
Performance metrics for the DBMS listed above. Some are normalized by throughput, others are not. Legend for results is here.
ips	qps	rps	rmbps	wps	wmbps	rpq	rkbpq	wpi	wkbpi	csps	cpups	cspq	cpupq	dbgb1	dbgb2	rss	maxop	p50	p99	tag
433604	0	3422	13.4	627.6	79.4	0.008	0.032	0.001	0.188	88654	42.2	0.204	15	10.6	139.1	16.1	0.240	57038	42454	160m.my5651_rel.cy10a_gcp_c2s30
406091	0	3175	12.4	236.6	71.8	0.008	0.031	0.001	0.181	83106	40.6	0.205	15	10.6	139.1	16.1	0.521	52443	40556	160m.my5651_rel.cy10a1_gcp_c2s30
410256	0	3199	12.5	792.4	81.1	0.008	0.031	0.002	0.202	83897	40.9	0.204	15	10.6	139.1	16.1	0.214	52743	42954	160m.my5651_rel.cy10a2_gcp_c2s30
428954	0	3388	13.2	268.5	76.3	0.008	0.032	0.001	0.182	88548	42.6	0.206	15	10.6	139.1	16.1	0.195	55340	44467	160m.my5651_rel.cy10a4_gcp_c2s30
l.x
l.x: create secondary indexes.
Average throughput:
Performance metrics for the DBMS listed above. Some are normalized by throughput, others are not. Legend for results is here.
ips	qps	rps	rmbps	wps	wmbps	rpq	rkbpq	wpi	wkbpi	csps	cpups	cspq	cpupq	dbgb1	dbgb2	rss	maxop	p50	p99	tag
618147	0	310	1.2	7973.7	647.5	0.001	0.002	0.013	1.073	19056	37.5	0.031	9	21.7	150.2	27.4	0.001	NA	NA	160m.my5651_rel.cy10a_gcp_c2s30
606439	0	262	1.0	2835.0	612.1	0.000	0.002	0.005	1.034	12910	37.9	0.021	9	21.7	150.2	27.4	0.001	NA	NA	160m.my5651_rel.cy10a1_gcp_c2s30
613410	0	349	1.4	7948.0	637.9	0.001	0.002	0.013	1.065	19857	38.7	0.032	9	21.7	150.2	27.4	0.001	NA	NA	160m.my5651_rel.cy10a2_gcp_c2s30
618147	0	279	1.1	3352.6	633.1	0.000	0.002	0.005	1.049	28703	39.9	0.046	10	21.7	150.2	27.4	0.002	NA	NA	160m.my5651_rel.cy10a4_gcp_c2s30
l.i1
l.i1: continue load after secondary indexes created. Graphs for performance per 1-second interval are here.
Average throughput:
Insert response time histogram: each cell has the percentage of responses that take <= the time in the header and max is the max response time in seconds. For the max column values in the top 25% of the range have a red background and in the bottom 25% of the range have a green background. The red background is not used when the min value is within 80% of the max value.
| dbms | 256us | 1ms | 4ms | 16ms | 64ms | 256ms | 1s | 4s | 16s | gt | max |
|---|---|---|---|---|---|---|---|---|---|---|---|
| my5651_rel.cy10a_gcp_c2s30 | nonzero | 29.748 | 69.655 | 0.578 | 0.019 | nonzero | 0.456 | ||||
| my5651_rel.cy10a1_gcp_c2s30 | nonzero | 22.824 | 76.670 | 0.487 | 0.018 | 0.205 | |||||
| my5651_rel.cy10a2_gcp_c2s30 | 27.444 | 72.075 | 0.464 | 0.017 | nonzero | 0.394 | |||||
| my5651_rel.cy10a4_gcp_c2s30 | nonzero | 29.822 | 69.707 | 0.454 | 0.018 | nonzero | 0.289 |
Delete response time histogram: each cell has the percentage of responses that take <= the time in the header and max is the max response time in seconds. For the max column values in the top 25% of the range have a red background and in the bottom 25% of the range have a green background. The red background is not used when the min value is within 80% of the max value.
| dbms | 256us | 1ms | 4ms | 16ms | 64ms | 256ms | 1s | 4s | 16s | gt | max |
|---|---|---|---|---|---|---|---|---|---|---|---|
| my5651_rel.cy10a_gcp_c2s30 | 0.002 | 55.074 | 44.406 | 0.501 | 0.016 | 0.001 | 0.462 | ||||
| my5651_rel.cy10a1_gcp_c2s30 | nonzero | 46.850 | 52.707 | 0.428 | 0.015 | 0.242 | |||||
| my5651_rel.cy10a2_gcp_c2s30 | 0.001 | 51.160 | 48.416 | 0.409 | 0.014 | nonzero | 0.394 | ||||
| my5651_rel.cy10a4_gcp_c2s30 | 0.003 | 56.076 | 43.523 | 0.380 | 0.018 | 0.227 |
Performance metrics for the DBMS listed above. Some are normalized by throughput, others are not. Legend for results is here.
ips	qps	rps	rmbps	wps	wmbps	rpq	rkbpq	wpi	wkbpi	csps	cpups	cspq	cpupq	dbgb1	dbgb2	rss	maxop	p50	p99	tag
81202	0	2640	12.6	4393.5	167.4	0.033	0.159	0.054	2.111	171699	62.0	2.114	115	94.0	251.9	85.7	0.456	10389	6793	160m.my5651_rel.cy10a_gcp_c2s30
78354	0	2517	12.4	3329.0	162.1	0.032	0.163	0.042	2.119	167411	61.0	2.137	117	95.8	254.7	85.7	0.205	9989	7492	160m.my5651_rel.cy10a1_gcp_c2s30
80345	0	2617	12.7	5582.0	203.0	0.033	0.162	0.069	2.588	171340	62.6	2.133	117	95.6	254.4	85.7	0.394	10239	7692	160m.my5651_rel.cy10a2_gcp_c2s30
81045	0	2460	12.4	3498.8	162.7	0.030	0.157	0.043	2.056	171617	62.9	2.118	116	93.8	251.7	85.7	0.289	10289	8241	160m.my5651_rel.cy10a4_gcp_c2s30
q100.1
q100.1: range queries with 100 insert/s per client. Graphs for performance per 1-second interval are here.
Average throughput:
Query response time histogram: each cell has the percentage of responses that take <= the time in the header and max is the max response time in seconds. For max values in the top 25% of the range have a red background and in the bottom 25% of the range have a green background. The red background is not used when the min value is within 80% of the max value.
| dbms | 256us | 1ms | 4ms | 16ms | 64ms | 256ms | 1s | 4s | 16s | gt | max |
|---|---|---|---|---|---|---|---|---|---|---|---|
| my5651_rel.cy10a_gcp_c2s30 | 99.706 | 0.234 | 0.056 | 0.005 | nonzero | nonzero | 0.084 | ||||
| my5651_rel.cy10a1_gcp_c2s30 | 99.632 | 0.309 | 0.054 | 0.005 | nonzero | nonzero | 0.087 | ||||
| my5651_rel.cy10a2_gcp_c2s30 | 99.656 | 0.283 | 0.056 | 0.005 | nonzero | nonzero | 0.084 | ||||
| my5651_rel.cy10a4_gcp_c2s30 | 99.583 | 0.297 | 0.107 | 0.014 | nonzero | nonzero | 0.175 |
Insert response time histogram: each cell has the percentage of responses that take <= the time in the header and max is the max response time in seconds. For max values in the top 25% of the range have a red background and in the bottom 25% of the range have a green background. The red background is not used when the min value is within 80% of the max value.
| dbms | 256us | 1ms | 4ms | 16ms | 64ms | 256ms | 1s | 4s | 16s | gt | max |
|---|---|---|---|---|---|---|---|---|---|---|---|
| my5651_rel.cy10a_gcp_c2s30 | 87.983 | 11.920 | 0.097 | 0.037 | |||||||
| my5651_rel.cy10a1_gcp_c2s30 | 80.038 | 19.938 | 0.024 | 0.027 | |||||||
| my5651_rel.cy10a2_gcp_c2s30 | 83.375 | 16.604 | 0.021 | 0.028 | |||||||
| my5651_rel.cy10a4_gcp_c2s30 | 85.351 | 14.632 | 0.017 | 0.018 |
Delete response time histogram: each cell has the percentage of responses that take <= the time in the header and max is the max response time in seconds. For max values in the top 25% of the range have a red background and in the bottom 25% of the range have a green background. The red background is not used when the min value is within 80% of the max value.
| dbms | 256us | 1ms | 4ms | 16ms | 64ms | 256ms | 1s | 4s | 16s | gt | max |
|---|---|---|---|---|---|---|---|---|---|---|---|
| my5651_rel.cy10a_gcp_c2s30 | 0.205 | 90.292 | 9.410 | 0.094 | 0.036 | ||||||
| my5651_rel.cy10a1_gcp_c2s30 | 0.094 | 84.878 | 15.014 | 0.014 | 0.022 | ||||||
| my5651_rel.cy10a2_gcp_c2s30 | 0.101 | 86.434 | 13.444 | 0.021 | 0.032 | ||||||
| my5651_rel.cy10a4_gcp_c2s30 | 0.017 | 90.188 | 9.788 | 0.007 | 0.024 |
Performance metrics for the DBMS listed above. Some are normalized by throughput, others are not. Legend for results is here.
ips	qps	rps	rmbps	wps	wmbps	rpq	rkbpq	wpi	wkbpi	csps	cpups	cspq	cpupq	dbgb1	dbgb2	rss	maxop	p50	p99	tag
783	59927	1728	26.6	3748.0	116.8	0.029	0.454	4.789	152.802	209424	69.1	3.495	173	94.0	251.9	85.7	0.084	7672	7339	160m.my5651_rel.cy10a_gcp_c2s30
778	58526	1134	28.2	3352.0	116.8	0.019	0.493	4.307	153.668	203506	69.2	3.477	177	95.8	254.7	85.8	0.087	7512	7128	160m.my5651_rel.cy10a1_gcp_c2s30
783	59182	1841	28.4	4154.1	130.0	0.031	0.491	5.303	169.941	207905	69.4	3.513	176	95.6	254.4	85.7	0.084	7560	7211	160m.my5651_rel.cy10a2_gcp_c2s30
773	59340	235	25.8	3456.0	126.5	0.004	0.446	4.472	167.563	204691	70.6	3.449	178	93.8	251.7	85.7	0.175	7655	6553	160m.my5651_rel.cy10a4_gcp_c2s30
q500.1
q500.1: range queries with 500 insert/s per client. Graphs for performance per 1-second interval are here.
Average throughput:
Query response time histogram: each cell has the percentage of responses that take <= the time in the header and max is the max response time in seconds. For max values in the top 25% of the range have a red background and in the bottom 25% of the range have a green background. The red background is not used when the min value is within 80% of the max value.
| dbms | 256us | 1ms | 4ms | 16ms | 64ms | 256ms | 1s | 4s | 16s | gt | max |
|---|---|---|---|---|---|---|---|---|---|---|---|
| my5651_rel.cy10a_gcp_c2s30 | 99.626 | 0.294 | 0.073 | 0.008 | nonzero | nonzero | 0.078 | ||||
| my5651_rel.cy10a1_gcp_c2s30 | 99.535 | 0.373 | 0.079 | 0.013 | nonzero | nonzero | 0.127 | ||||
| my5651_rel.cy10a2_gcp_c2s30 | 99.576 | 0.335 | 0.077 | 0.011 | nonzero | 0.016 | |||||
| my5651_rel.cy10a4_gcp_c2s30 | 99.641 | 0.287 | 0.063 | 0.009 | nonzero | 0.019 |
Insert response time histogram: each cell has the percentage of responses that take <= the time in the header and max is the max response time in seconds. For max values in the top 25% of the range have a red background and in the bottom 25% of the range have a green background. The red background is not used when the min value is within 80% of the max value.
| dbms | 256us | 1ms | 4ms | 16ms | 64ms | 256ms | 1s | 4s | 16s | gt | max |
|---|---|---|---|---|---|---|---|---|---|---|---|
| my5651_rel.cy10a_gcp_c2s30 | 0.026 | 96.237 | 3.662 | 0.074 | 0.058 | ||||||
| my5651_rel.cy10a1_gcp_c2s30 | 0.010 | 94.485 | 5.446 | 0.057 | 0.001 | 0.085 | |||||
| my5651_rel.cy10a2_gcp_c2s30 | 0.015 | 96.233 | 3.739 | 0.013 | 0.033 | ||||||
| my5651_rel.cy10a4_gcp_c2s30 | 0.025 | 93.793 | 6.163 | 0.019 | 0.027 |
Delete response time histogram: each cell has the percentage of responses that take <= the time in the header and max is the max response time in seconds. For max values in the top 25% of the range have a red background and in the bottom 25% of the range have a green background. The red background is not used when the min value is within 80% of the max value.
| dbms | 256us | 1ms | 4ms | 16ms | 64ms | 256ms | 1s | 4s | 16s | gt | max |
|---|---|---|---|---|---|---|---|---|---|---|---|
| my5651_rel.cy10a_gcp_c2s30 | 0.751 | 96.558 | 2.624 | 0.067 | 0.054 | ||||||
| my5651_rel.cy10a1_gcp_c2s30 | 0.351 | 96.122 | 3.481 | 0.045 | 0.001 | 0.084 | |||||
| my5651_rel.cy10a2_gcp_c2s30 | 0.560 | 96.884 | 2.546 | 0.010 | 0.042 | ||||||
| my5651_rel.cy10a4_gcp_c2s30 | 0.360 | 96.515 | 3.113 | 0.011 | 0.026 |
Performance metrics for the DBMS listed above. Some are normalized by throughput, others are not. Legend for results is here.
ips	qps	rps	rmbps	wps	wmbps	rpq	rkbpq	wpi	wkbpi	csps	cpups	cspq	cpupq	dbgb1	dbgb2	rss	maxop	p50	p99	tag
3962	64203	1070	15.1	3703.6	122.9	0.017	0.241	0.935	31.753	220353	69.2	3.432	162	94.0	251.9	85.7	0.078	8007	7384	160m.my5651_rel.cy10a_gcp_c2s30
3958	60949	744	15.5	3134.0	126.3	0.012	0.260	0.792	32.667	206874	70.5	3.394	174	95.8	254.7	85.7	0.127	7687	7128	160m.my5651_rel.cy10a1_gcp_c2s30
3965	61604	1136	16.1	4686.5	153.6	0.018	0.267	1.182	39.673	210891	70.5	3.423	172	95.6	254.4	85.7	0.016	7767	7256	160m.my5651_rel.cy10a2_gcp_c2s30
3967	66341	229	10.5	2660.2	102.6	0.003	0.162	0.671	26.475	233977	67.1	3.527	152	93.8	251.7	85.7	0.019	8087	7371	160m.my5651_rel.cy10a4_gcp_c2s30
q1000.1
q1000.1: range queries with 1000 insert/s per client. Graphs for performance per 1-second interval are here.
Average throughput:
Query response time histogram: each cell has the percentage of responses that take <= the time in the header and max is the max response time in seconds. For max values in the top 25% of the range have a red background and in the bottom 25% of the range have a green background. The red background is not used when the min value is within 80% of the max value.
| dbms | 256us | 1ms | 4ms | 16ms | 64ms | 256ms | 1s | 4s | 16s | gt | max |
|---|---|---|---|---|---|---|---|---|---|---|---|
| my5651_rel.cy10a_gcp_c2s30 | 99.508 | 0.441 | 0.046 | 0.004 | nonzero | 0.031 | |||||
| my5651_rel.cy10a1_gcp_c2s30 | 99.448 | 0.497 | 0.050 | 0.005 | nonzero | nonzero | 0.112 | ||||
| my5651_rel.cy10a2_gcp_c2s30 | 99.479 | 0.466 | 0.049 | 0.005 | nonzero | 0.018 | |||||
| my5651_rel.cy10a4_gcp_c2s30 | 99.530 | 0.419 | 0.045 | 0.006 | nonzero | 0.030 |
Insert response time histogram: each cell has the percentage of responses that take <= the time in the header and max is the max response time in seconds. For max values in the top 25% of the range have a red background and in the bottom 25% of the range have a green background. The red background is not used when the min value is within 80% of the max value.
| dbms | 256us | 1ms | 4ms | 16ms | 64ms | 256ms | 1s | 4s | 16s | gt | max |
|---|---|---|---|---|---|---|---|---|---|---|---|
| my5651_rel.cy10a_gcp_c2s30 | 0.001 | 46.743 | 52.613 | 0.643 | 0.034 | ||||||
| my5651_rel.cy10a1_gcp_c2s30 | 41.917 | 57.175 | 0.907 | 0.001 | 0.119 | ||||||
| my5651_rel.cy10a2_gcp_c2s30 | 0.001 | 43.645 | 55.619 | 0.735 | 0.034 | ||||||
| my5651_rel.cy10a4_gcp_c2s30 | 0.051 | 56.453 | 42.852 | 0.643 | 0.040 |
Delete response time histogram: each cell has the percentage of responses that take <= the time in the header and max is the max response time in seconds. For max values in the top 25% of the range have a red background and in the bottom 25% of the range have a green background. The red background is not used when the min value is within 80% of the max value.
| dbms | 256us | 1ms | 4ms | 16ms | 64ms | 256ms | 1s | 4s | 16s | gt | max |
|---|---|---|---|---|---|---|---|---|---|---|---|
| my5651_rel.cy10a_gcp_c2s30 | 0.022 | 54.626 | 44.981 | 0.372 | 0.033 | ||||||
| my5651_rel.cy10a1_gcp_c2s30 | 0.013 | 49.381 | 50.070 | 0.535 | 0.001 | 0.121 | |||||
| my5651_rel.cy10a2_gcp_c2s30 | 0.018 | 50.907 | 48.650 | 0.424 | 0.033 | ||||||
| my5651_rel.cy10a4_gcp_c2s30 | 0.540 | 67.289 | 31.883 | 0.287 | 0.035 |
Performance metrics for the DBMS listed above. Some are normalized by throughput, others are not. Legend for results is here.
ips	qps	rps	rmbps	wps	wmbps	rpq	rkbpq	wpi	wkbpi	csps	cpups	cspq	cpupq	dbgb1	dbgb2	rss	maxop	p50	p99	tag
7960	74452	334	2.5	1410.6	45.8	0.004	0.035	0.177	5.889	285371	57.3	3.833	115	94.0	251.9	85.7	0.031	9366	9030	160m.my5651_rel.cy10a_gcp_c2s30
7960	73120	336	2.6	1202.5	50.5	0.005	0.036	0.151	6.501	281105	57.5	3.844	118	95.8	254.7	85.7	0.112	9286	8599	160m.my5651_rel.cy10a1_gcp_c2s30
7960	73602	332	2.5	1221.8	40.1	0.005	0.035	0.153	5.165	282278	57.4	3.835	117	95.6	254.4	85.7	0.018	9286	9046	160m.my5651_rel.cy10a2_gcp_c2s30
7960	73473	325	2.8	1025.1	45.8	0.004	0.039	0.129	5.898	283701	57.5	3.861	117	93.8	251.7	85.7	0.030	9302	8567	160m.my5651_rel.cy10a4_gcp_c2s30
l.i0
l.i0: load without secondary indexes
Performance metrics for all DBMS, not just the ones listed above. Some are normalized by throughput, others are not. Legend for results is here.
ips	qps	rps	rmbps	wps	wmbps	rpq	rkbpq	wpi	wkbpi	csps	cpups	cspq	cpupq	dbgb1	dbgb2	rss	maxop	p50	p99	tag
433604	0	3422	13.4	627.6	79.4	0.008	0.032	0.001	0.188	88654	42.2	0.204	15	10.6	139.1	16.1	0.240	57038	42454	160m.my5651_rel.cy10a_gcp_c2s30
406091	0	3175	12.4	236.6	71.8	0.008	0.031	0.001	0.181	83106	40.6	0.205	15	10.6	139.1	16.1	0.521	52443	40556	160m.my5651_rel.cy10a1_gcp_c2s30
410256	0	3199	12.5	792.4	81.1	0.008	0.031	0.002	0.202	83897	40.9	0.204	15	10.6	139.1	16.1	0.214	52743	42954	160m.my5651_rel.cy10a2_gcp_c2s30
428954	0	3388	13.2	268.5	76.3	0.008	0.032	0.001	0.182	88548	42.6	0.206	15	10.6	139.1	16.1	0.195	55340	44467	160m.my5651_rel.cy10a4_gcp_c2s30
l.x
l.x: create secondary indexes
Performance metrics for all DBMS, not just the ones listed above. Some are normalized by throughput, others are not. Legend for results is here.
ips	qps	rps	rmbps	wps	wmbps	rpq	rkbpq	wpi	wkbpi	csps	cpups	cspq	cpupq	dbgb1	dbgb2	rss	maxop	p50	p99	tag
618147	0	310	1.2	7973.7	647.5	0.001	0.002	0.013	1.073	19056	37.5	0.031	9	21.7	150.2	27.4	0.001	NA	NA	160m.my5651_rel.cy10a_gcp_c2s30
606439	0	262	1.0	2835.0	612.1	0.000	0.002	0.005	1.034	12910	37.9	0.021	9	21.7	150.2	27.4	0.001	NA	NA	160m.my5651_rel.cy10a1_gcp_c2s30
613410	0	349	1.4	7948.0	637.9	0.001	0.002	0.013	1.065	19857	38.7	0.032	9	21.7	150.2	27.4	0.001	NA	NA	160m.my5651_rel.cy10a2_gcp_c2s30
618147	0	279	1.1	3352.6	633.1	0.000	0.002	0.005	1.049	28703	39.9	0.046	10	21.7	150.2	27.4	0.002	NA	NA	160m.my5651_rel.cy10a4_gcp_c2s30
l.i1
l.i1: continue load after secondary indexes created
Performance metrics for all DBMS, not just the ones listed above. Some are normalized by throughput, others are not. Legend for results is here.
ips	qps	rps	rmbps	wps	wmbps	rpq	rkbpq	wpi	wkbpi	csps	cpups	cspq	cpupq	dbgb1	dbgb2	rss	maxop	p50	p99	tag
81202	0	2640	12.6	4393.5	167.4	0.033	0.159	0.054	2.111	171699	62.0	2.114	115	94.0	251.9	85.7	0.456	10389	6793	160m.my5651_rel.cy10a_gcp_c2s30
78354	0	2517	12.4	3329.0	162.1	0.032	0.163	0.042	2.119	167411	61.0	2.137	117	95.8	254.7	85.7	0.205	9989	7492	160m.my5651_rel.cy10a1_gcp_c2s30
80345	0	2617	12.7	5582.0	203.0	0.033	0.162	0.069	2.588	171340	62.6	2.133	117	95.6	254.4	85.7	0.394	10239	7692	160m.my5651_rel.cy10a2_gcp_c2s30
81045	0	2460	12.4	3498.8	162.7	0.030	0.157	0.043	2.056	171617	62.9	2.118	116	93.8	251.7	85.7	0.289	10289	8241	160m.my5651_rel.cy10a4_gcp_c2s30
q100.1
q100.1: range queries with 100 insert/s per client
Performance metrics for all DBMS, not just the ones listed above. Some are normalized by throughput, others are not. Legend for results is here.
ips	qps	rps	rmbps	wps	wmbps	rpq	rkbpq	wpi	wkbpi	csps	cpups	cspq	cpupq	dbgb1	dbgb2	rss	maxop	p50	p99	tag
783	59927	1728	26.6	3748.0	116.8	0.029	0.454	4.789	152.802	209424	69.1	3.495	173	94.0	251.9	85.7	0.084	7672	7339	160m.my5651_rel.cy10a_gcp_c2s30
778	58526	1134	28.2	3352.0	116.8	0.019	0.493	4.307	153.668	203506	69.2	3.477	177	95.8	254.7	85.8	0.087	7512	7128	160m.my5651_rel.cy10a1_gcp_c2s30
783	59182	1841	28.4	4154.1	130.0	0.031	0.491	5.303	169.941	207905	69.4	3.513	176	95.6	254.4	85.7	0.084	7560	7211	160m.my5651_rel.cy10a2_gcp_c2s30
773	59340	235	25.8	3456.0	126.5	0.004	0.446	4.472	167.563	204691	70.6	3.449	178	93.8	251.7	85.7	0.175	7655	6553	160m.my5651_rel.cy10a4_gcp_c2s30
q500.1
q500.1: range queries with 500 insert/s per client
Performance metrics for all DBMS, not just the ones listed above. Some are normalized by throughput, others are not. Legend for results is here.
ips	qps	rps	rmbps	wps	wmbps	rpq	rkbpq	wpi	wkbpi	csps	cpups	cspq	cpupq	dbgb1	dbgb2	rss	maxop	p50	p99	tag
3962	64203	1070	15.1	3703.6	122.9	0.017	0.241	0.935	31.753	220353	69.2	3.432	162	94.0	251.9	85.7	0.078	8007	7384	160m.my5651_rel.cy10a_gcp_c2s30
3958	60949	744	15.5	3134.0	126.3	0.012	0.260	0.792	32.667	206874	70.5	3.394	174	95.8	254.7	85.7	0.127	7687	7128	160m.my5651_rel.cy10a1_gcp_c2s30
3965	61604	1136	16.1	4686.5	153.6	0.018	0.267	1.182	39.673	210891	70.5	3.423	172	95.6	254.4	85.7	0.016	7767	7256	160m.my5651_rel.cy10a2_gcp_c2s30
3967	66341	229	10.5	2660.2	102.6	0.003	0.162	0.671	26.475	233977	67.1	3.527	152	93.8	251.7	85.7	0.019	8087	7371	160m.my5651_rel.cy10a4_gcp_c2s30
q1000.1
q1000.1: range queries with 1000 insert/s per client
Performance metrics for all DBMS, not just the ones listed above. Some are normalized by throughput, others are not. Legend for results is here.
ips	qps	rps	rmbps	wps	wmbps	rpq	rkbpq	wpi	wkbpi	csps	cpups	cspq	cpupq	dbgb1	dbgb2	rss	maxop	p50	p99	tag
7960	74452	334	2.5	1410.6	45.8	0.004	0.035	0.177	5.889	285371	57.3	3.833	115	94.0	251.9	85.7	0.031	9366	9030	160m.my5651_rel.cy10a_gcp_c2s30
7960	73120	336	2.6	1202.5	50.5	0.005	0.036	0.151	6.501	281105	57.5	3.844	118	95.8	254.7	85.7	0.112	9286	8599	160m.my5651_rel.cy10a1_gcp_c2s30
7960	73602	332	2.5	1221.8	40.1	0.005	0.035	0.153	5.165	282278	57.4	3.835	117	95.6	254.4	85.7	0.018	9286	9046	160m.my5651_rel.cy10a2_gcp_c2s30
7960	73473	325	2.8	1025.1	45.8	0.004	0.039	0.129	5.898	283701	57.5	3.861	117	93.8	251.7	85.7	0.030	9302	8567	160m.my5651_rel.cy10a4_gcp_c2s30
l.i0
- l.i0: load without secondary indexes
- Legend for results is here.
- Each entry lists the percentage of responses that fit in that bucket (slower than max time for previous bucket, faster than min time for next bucket).
Insert response time histogram
256us	1ms	4ms	16ms	64ms	256ms	1s	4s	16s	gt	max	tag
0.000	2.235	97.528	0.066	0.156	0.014	0.000	0.000	0.000	0.000	0.240	my5651_rel.cy10a_gcp_c2s30
0.000	2.187	97.528	0.096	0.167	0.021	0.001	0.000	0.000	0.000	0.521	my5651_rel.cy10a1_gcp_c2s30
0.000	2.129	97.591	0.097	0.169	0.014	0.000	0.000	0.000	0.000	0.214	my5651_rel.cy10a2_gcp_c2s30
0.000	2.224	97.403	0.196	0.162	0.014	0.000	0.000	0.000	0.000	0.195	my5651_rel.cy10a4_gcp_c2s30
l.x
- l.x: create secondary indexes
- Legend for results is here.
- Each entry lists the percentage of responses that fit in that bucket (slower than max time for previous bucket, faster than min time for next bucket).
TODO - determine whether there is data for create index response time
l.i1
- l.i1: continue load after secondary indexes created
- Legend for results is here.
- Each entry lists the percentage of responses that fit in that bucket (slower than max time for previous bucket, faster than min time for next bucket).
Insert response time histogram
256us	1ms	4ms	16ms	64ms	256ms	1s	4s	16s	gt	max	tag
0.000	nonzero	29.748	69.655	0.578	0.019	nonzero	0.000	0.000	0.000	0.456	my5651_rel.cy10a_gcp_c2s30
0.000	nonzero	22.824	76.670	0.487	0.018	0.000	0.000	0.000	0.000	0.205	my5651_rel.cy10a1_gcp_c2s30
0.000	0.000	27.444	72.075	0.464	0.017	nonzero	0.000	0.000	0.000	0.394	my5651_rel.cy10a2_gcp_c2s30
0.000	nonzero	29.822	69.707	0.454	0.018	nonzero	0.000	0.000	0.000	0.289	my5651_rel.cy10a4_gcp_c2s30
Delete response time histogram
256us	1ms	4ms	16ms	64ms	256ms	1s	4s	16s	gt	max	tag
0.000	0.002	55.074	44.406	0.501	0.016	0.001	0.000	0.000	0.000	0.462	my5651_rel.cy10a_gcp_c2s30
0.000	nonzero	46.850	52.707	0.428	0.015	0.000	0.000	0.000	0.000	0.242	my5651_rel.cy10a1_gcp_c2s30
0.000	0.001	51.160	48.416	0.409	0.014	nonzero	0.000	0.000	0.000	0.394	my5651_rel.cy10a2_gcp_c2s30
0.000	0.003	56.076	43.523	0.380	0.018	0.000	0.000	0.000	0.000	0.227	my5651_rel.cy10a4_gcp_c2s30
q100.1
- q100.1: range queries with 100 insert/s per client
- Legend for results is here.
- Each entry lists the percentage of responses that fit in that bucket (slower than max time for previous bucket, faster than min time for next bucket).
Query response time histogram
256us	1ms	4ms	16ms	64ms	256ms	1s	4s	16s	gt	max	tag
99.706	0.234	0.056	0.005	nonzero	nonzero	0.000	0.000	0.000	0.000	0.084	my5651_rel.cy10a_gcp_c2s30
99.632	0.309	0.054	0.005	nonzero	nonzero	0.000	0.000	0.000	0.000	0.087	my5651_rel.cy10a1_gcp_c2s30
99.656	0.283	0.056	0.005	nonzero	nonzero	0.000	0.000	0.000	0.000	0.084	my5651_rel.cy10a2_gcp_c2s30
99.583	0.297	0.107	0.014	nonzero	nonzero	0.000	0.000	0.000	0.000	0.175	my5651_rel.cy10a4_gcp_c2s30
Insert response time histogram
256us	1ms	4ms	16ms	64ms	256ms	1s	4s	16s	gt	max	tag
0.000	0.000	87.983	11.920	0.097	0.000	0.000	0.000	0.000	0.000	0.037	my5651_rel.cy10a_gcp_c2s30
0.000	0.000	80.038	19.938	0.024	0.000	0.000	0.000	0.000	0.000	0.027	my5651_rel.cy10a1_gcp_c2s30
0.000	0.000	83.375	16.604	0.021	0.000	0.000	0.000	0.000	0.000	0.028	my5651_rel.cy10a2_gcp_c2s30
0.000	0.000	85.351	14.632	0.017	0.000	0.000	0.000	0.000	0.000	0.018	my5651_rel.cy10a4_gcp_c2s30
Delete response time histogram
256us	1ms	4ms	16ms	64ms	256ms	1s	4s	16s	gt	max	tag
0.000	0.205	90.292	9.410	0.094	0.000	0.000	0.000	0.000	0.000	0.036	my5651_rel.cy10a_gcp_c2s30
0.000	0.094	84.878	15.014	0.014	0.000	0.000	0.000	0.000	0.000	0.022	my5651_rel.cy10a1_gcp_c2s30
0.000	0.101	86.434	13.444	0.021	0.000	0.000	0.000	0.000	0.000	0.032	my5651_rel.cy10a2_gcp_c2s30
0.000	0.017	90.188	9.788	0.007	0.000	0.000	0.000	0.000	0.000	0.024	my5651_rel.cy10a4_gcp_c2s30
q500.1
- q500.1: range queries with 500 insert/s per client
- Legend for results is here.
- Each entry lists the percentage of responses that fit in that bucket (slower than max time for previous bucket, faster than min time for next bucket).
Query response time histogram
256us	1ms	4ms	16ms	64ms	256ms	1s	4s	16s	gt	max	tag
99.626	0.294	0.073	0.008	nonzero	nonzero	0.000	0.000	0.000	0.000	0.078	my5651_rel.cy10a_gcp_c2s30
99.535	0.373	0.079	0.013	nonzero	nonzero	0.000	0.000	0.000	0.000	0.127	my5651_rel.cy10a1_gcp_c2s30
99.576	0.335	0.077	0.011	nonzero	0.000	0.000	0.000	0.000	0.000	0.016	my5651_rel.cy10a2_gcp_c2s30
99.641	0.287	0.063	0.009	nonzero	0.000	0.000	0.000	0.000	0.000	0.019	my5651_rel.cy10a4_gcp_c2s30
Insert response time histogram
256us	1ms	4ms	16ms	64ms	256ms	1s	4s	16s	gt	max	tag
0.000	0.026	96.237	3.662	0.074	0.000	0.000	0.000	0.000	0.000	0.058	my5651_rel.cy10a_gcp_c2s30
0.000	0.010	94.485	5.446	0.057	0.001	0.000	0.000	0.000	0.000	0.085	my5651_rel.cy10a1_gcp_c2s30
0.000	0.015	96.233	3.739	0.013	0.000	0.000	0.000	0.000	0.000	0.033	my5651_rel.cy10a2_gcp_c2s30
0.000	0.025	93.793	6.163	0.019	0.000	0.000	0.000	0.000	0.000	0.027	my5651_rel.cy10a4_gcp_c2s30
Delete response time histogram
256us	1ms	4ms	16ms	64ms	256ms	1s	4s	16s	gt	max	tag
0.000	0.751	96.558	2.624	0.067	0.000	0.000	0.000	0.000	0.000	0.054	my5651_rel.cy10a_gcp_c2s30
0.000	0.351	96.122	3.481	0.045	0.001	0.000	0.000	0.000	0.000	0.084	my5651_rel.cy10a1_gcp_c2s30
0.000	0.560	96.884	2.546	0.010	0.000	0.000	0.000	0.000	0.000	0.042	my5651_rel.cy10a2_gcp_c2s30
0.000	0.360	96.515	3.113	0.011	0.000	0.000	0.000	0.000	0.000	0.026	my5651_rel.cy10a4_gcp_c2s30
q1000.1
- q1000.1: range queries with 1000 insert/s per client
- Legend for results is here.
- Each entry lists the percentage of responses that fit in that bucket (slower than max time for previous bucket, faster than min time for next bucket).
Query response time histogram
256us	1ms	4ms	16ms	64ms	256ms	1s	4s	16s	gt	max	tag
99.508	0.441	0.046	0.004	nonzero	0.000	0.000	0.000	0.000	0.000	0.031	my5651_rel.cy10a_gcp_c2s30
99.448	0.497	0.050	0.005	nonzero	nonzero	0.000	0.000	0.000	0.000	0.112	my5651_rel.cy10a1_gcp_c2s30
99.479	0.466	0.049	0.005	nonzero	0.000	0.000	0.000	0.000	0.000	0.018	my5651_rel.cy10a2_gcp_c2s30
99.530	0.419	0.045	0.006	nonzero	0.000	0.000	0.000	0.000	0.000	0.030	my5651_rel.cy10a4_gcp_c2s30
Insert response time histogram
256us	1ms	4ms	16ms	64ms	256ms	1s	4s	16s	gt	max	tag
0.000	0.001	46.743	52.613	0.643	0.000	0.000	0.000	0.000	0.000	0.034	my5651_rel.cy10a_gcp_c2s30
0.000	0.000	41.917	57.175	0.907	0.001	0.000	0.000	0.000	0.000	0.119	my5651_rel.cy10a1_gcp_c2s30
0.000	0.001	43.645	55.619	0.735	0.000	0.000	0.000	0.000	0.000	0.034	my5651_rel.cy10a2_gcp_c2s30
0.000	0.051	56.453	42.852	0.643	0.000	0.000	0.000	0.000	0.000	0.040	my5651_rel.cy10a4_gcp_c2s30
Delete response time histogram
256us	1ms	4ms	16ms	64ms	256ms	1s	4s	16s	gt	max	tag
0.000	0.022	54.626	44.981	0.372	0.000	0.000	0.000	0.000	0.000	0.033	my5651_rel.cy10a_gcp_c2s30
0.000	0.013	49.381	50.070	0.535	0.001	0.000	0.000	0.000	0.000	0.121	my5651_rel.cy10a1_gcp_c2s30
0.000	0.018	50.907	48.650	0.424	0.000	0.000	0.000	0.000	0.000	0.033	my5651_rel.cy10a2_gcp_c2s30
0.000	0.540	67.289	31.883	0.287	0.000	0.000	0.000	0.000	0.000	0.035	my5651_rel.cy10a4_gcp_c2s30