Introduction
This is a report for the insert benchmark with 160M docs and 8 client(s). It is generated by scripts (bash, awk, sed) and Tufte might not be impressed. An overview of the insert benchmark is here and a short update is here. Below, by DBMS, I mean DBMS+version.config. An example is my8020.c10b40 where my means MySQL, 8020 is version 8.0.20 and c10b40 is the name for the configuration file.
The test server is a c2-standard-30 with 15 cores, hyperthreads disabled, 120G RAM and XFS with SW RAID 0 across 4 NVMe SSD. The benchmark was run with 8 clients and there were 1 or 3 connections per client (1 for queries or inserts without rate limits, 1+1 for rate limited inserts+deletes). It uses 8 tables, 1 per client. It loads 20M rows per table without secondary indexes, creates secondary indexes, then inserts 100M rows per table with a delete per insert to avoid growing the table. It then does 3 read+write tests for 3600s each that do queries as fast as possible with 100, 500 and then 1000 inserts/second/client concurrent with the queries. There are also deletes to match the inserts and avoid growing the table. The database is cached by Postgres. Clients and the DBMS share one server. The per-database configs are in the per-database subdirectories here.
The tested DBMS are:
- pg153_o3_native_lto.cx7a_gcp_c2s30 - Postgres 15.3, the cx7a_gcp_c2s30 config and the build used: -O3 -march=native -mtune=native -flto
- pg153_o3_native_lto.cx7a1_gcp_c2s30 - Postgres 15.3, the cx7a1_gcp_c2s30 config and the build used: -O3 -march=native -mtune=native -flto, adds wal_compression=lz4
- pg153_o3_native_lto.cx7a4_gcp_c2s30 - Postgres 15.3, the cx7a4_gcp_c2s30 config and the build used: -O3 -march=native -mtune=native -flto, adds checkpoint_timeout=1800s
- pg153_o3_native_lto.cx7a7_gcp_c2s30 - Postgres 15.3, the cx7a7_gcp_c2s30 config and the build used: -O3 -march=native -mtune=native -flto, adds max_wal_size=16GB
- pg153_o3_native_lto.cx7a10_gcp_c2s30 - Postgres 15.3, the cx7a10_gcp_c2s30 config, compiled with -O3 -march=native -mtune=native -flto, adds autovacuum_work_mem=256MB
- pg153_o3_native_lto.cx7a12_gcp_c2s30 - Postgres 15.3, the cx7a12_gcp_c2s30 config, compiled with -O3 -march=native -mtune=native -flto, adds wal_buffers=64MB
- pg153_o3_native_lto.cx7a15_gcp_c2s30 - Postgres 15.3, the cx7a15_gcp_c2s30 config, compiled with -O3 -march=native -mtune=native -flto, adds max_wal_size=32GB
- pg153_o3_native_lto.cx7a16_gcp_c2s30 - Postgres 15.3, the cx7a16_gcp_c2s30 config, compiled with -O3 -march=native -mtune=native -flto, adds autovacuum_vacuum_scale_factor=0.05 autovacuum_vacuum_insert_scale_factor=0.05
- pg153_o3_native_lto.cx7a21_gcp_c2s30 - Postgres 15.3, the cx7a21_gcp_c2s30 config, compiled with -O3 -march=native -mtune=native -flto, combines a1, a4, a10 and a16
- pg153_o3_native_lto.cx7a22_gcp_c2s30 - Postgres 15.3, the cx7a22_gcp_c2s30 config, compiled with -O3 -march=native -mtune=native -flto, combines a4, a10 and a16
Contents
- Summary
- l.i0: load without secondary indexes
- l.x: create secondary indexes
- l.i1: continue load after secondary indexes created
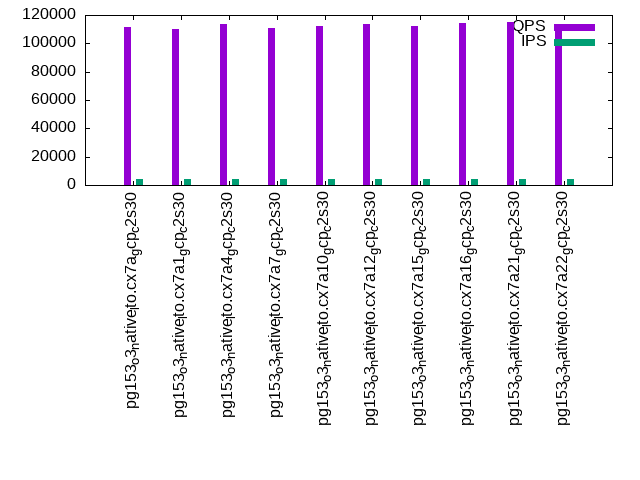
- q100.1: range queries with 100 insert/s per client
- q500.1: range queries with 500 insert/s per client
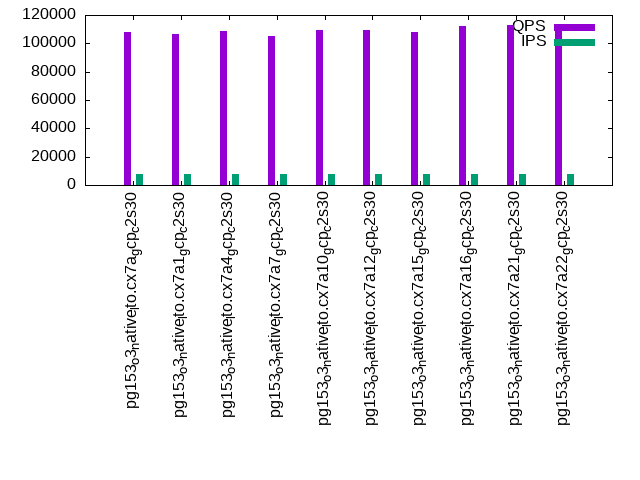
- q1000.1: range queries with 1000 insert/s per client
Summary
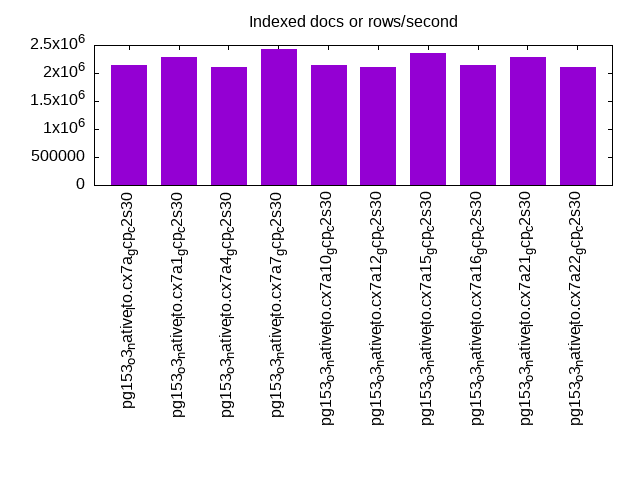
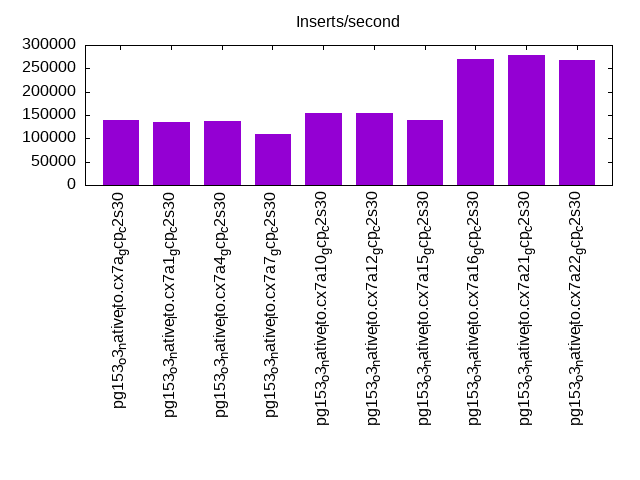
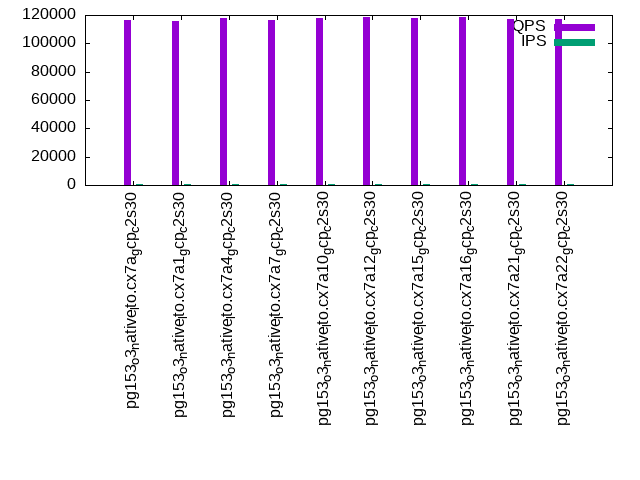
The numbers are inserts/s for l.i0 and l.i1, indexed docs (or rows) /s for l.x and queries/s for q*.2. The values are the average rate over the entire test for inserts (IPS) and queries (QPS). The range of values for IPS and QPS is split into 3 parts: bottom 25%, middle 50%, top 25%. Values in the bottom 25% have a red background, values in the top 25% have a green background and values in the middle have no color. A gray background is used for values that can be ignored because the DBMS did not sustain the target insert rate. Red backgrounds are not used when the minimum value is within 80% of the max value.
| dbms | l.i0 | l.x | l.i1 | q100.1 | q500.1 | q1000.1 |
|---|---|---|---|---|---|---|
| pg153_o3_native_lto.cx7a_gcp_c2s30 | 1019108 | 2134667 | 138768 | 116476 | 111377 | 107936 |
| pg153_o3_native_lto.cx7a1_gcp_c2s30 | 1019108 | 2287143 | 134273 | 115997 | 110379 | 106366 |
| pg153_o3_native_lto.cx7a4_gcp_c2s30 | 1012658 | 2106579 | 136565 | 118040 | 113389 | 108515 |
| pg153_o3_native_lto.cx7a7_gcp_c2s30 | 1006289 | 2425758 | 108284 | 116342 | 110753 | 105171 |
| pg153_o3_native_lto.cx7a10_gcp_c2s30 | 1019108 | 2134667 | 153935 | 118059 | 112370 | 109517 |
| pg153_o3_native_lto.cx7a12_gcp_c2s30 | 1052632 | 2106579 | 154410 | 118787 | 113830 | 109404 |
| pg153_o3_native_lto.cx7a15_gcp_c2s30 | 1000000 | 2354412 | 139689 | 117862 | 112106 | 108261 |
| pg153_o3_native_lto.cx7a16_gcp_c2s30 | 1019108 | 2134667 | 271003 | 118457 | 114614 | 112476 |
| pg153_o3_native_lto.cx7a21_gcp_c2s30 | 1012658 | 2287143 | 279427 | 117518 | 114826 | 112689 |
| pg153_o3_native_lto.cx7a22_gcp_c2s30 | 1006289 | 2106579 | 267112 | 117159 | 113983 | 111897 |
This table has relative throughput, throughput for the DBMS relative to the DBMS in the first line, using the absolute throughput from the previous table. Values less than 0.95 have a yellow background. Values greater than 1.05 have a blue background.
| dbms | l.i0 | l.x | l.i1 | q100.1 | q500.1 | q1000.1 |
|---|---|---|---|---|---|---|
| pg153_o3_native_lto.cx7a_gcp_c2s30 | 1.00 | 1.00 | 1.00 | 1.00 | 1.00 | 1.00 |
| pg153_o3_native_lto.cx7a1_gcp_c2s30 | 1.00 | 1.07 | 0.97 | 1.00 | 0.99 | 0.99 |
| pg153_o3_native_lto.cx7a4_gcp_c2s30 | 0.99 | 0.99 | 0.98 | 1.01 | 1.02 | 1.01 |
| pg153_o3_native_lto.cx7a7_gcp_c2s30 | 0.99 | 1.14 | 0.78 | 1.00 | 0.99 | 0.97 |
| pg153_o3_native_lto.cx7a10_gcp_c2s30 | 1.00 | 1.00 | 1.11 | 1.01 | 1.01 | 1.01 |
| pg153_o3_native_lto.cx7a12_gcp_c2s30 | 1.03 | 0.99 | 1.11 | 1.02 | 1.02 | 1.01 |
| pg153_o3_native_lto.cx7a15_gcp_c2s30 | 0.98 | 1.10 | 1.01 | 1.01 | 1.01 | 1.00 |
| pg153_o3_native_lto.cx7a16_gcp_c2s30 | 1.00 | 1.00 | 1.95 | 1.02 | 1.03 | 1.04 |
| pg153_o3_native_lto.cx7a21_gcp_c2s30 | 0.99 | 1.07 | 2.01 | 1.01 | 1.03 | 1.04 |
| pg153_o3_native_lto.cx7a22_gcp_c2s30 | 0.99 | 0.99 | 1.92 | 1.01 | 1.02 | 1.04 |
This lists the average rate of inserts/s for the tests that do inserts concurrent with queries. For such tests the query rate is listed in the table above. The read+write tests are setup so that the insert rate should match the target rate every second. Cells that are not at least 95% of the target have a red background to indicate a failure to satisfy the target.
| dbms | q100.1 | q500.1 | q1000.1 |
|---|---|---|---|
| pg153_o3_native_lto.cx7a_gcp_c2s30 | 797 | 3988 | 7976 |
| pg153_o3_native_lto.cx7a1_gcp_c2s30 | 798 | 3987 | 7976 |
| pg153_o3_native_lto.cx7a4_gcp_c2s30 | 798 | 3987 | 7976 |
| pg153_o3_native_lto.cx7a7_gcp_c2s30 | 798 | 3988 | 7976 |
| pg153_o3_native_lto.cx7a10_gcp_c2s30 | 798 | 3987 | 7976 |
| pg153_o3_native_lto.cx7a12_gcp_c2s30 | 797 | 3987 | 7978 |
| pg153_o3_native_lto.cx7a15_gcp_c2s30 | 797 | 3987 | 7976 |
| pg153_o3_native_lto.cx7a16_gcp_c2s30 | 797 | 3988 | 7976 |
| pg153_o3_native_lto.cx7a21_gcp_c2s30 | 797 | 3988 | 7976 |
| pg153_o3_native_lto.cx7a22_gcp_c2s30 | 798 | 3987 | 7978 |
| target | 800 | 4000 | 8000 |
l.i0
l.i0: load without secondary indexes. Graphs for performance per 1-second interval are here.
Average throughput:
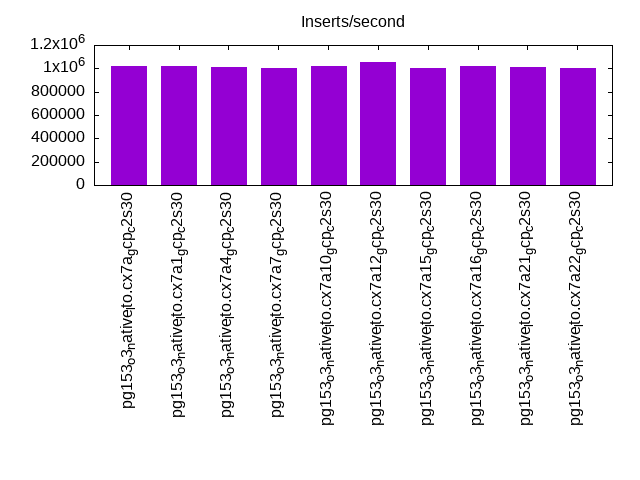
Insert response time histogram: each cell has the percentage of responses that take <= the time in the header and max is the max response time in seconds. For the max column values in the top 25% of the range have a red background and in the bottom 25% of the range have a green background. The red background is not used when the min value is within 80% of the max value.
| dbms | 256us | 1ms | 4ms | 16ms | 64ms | 256ms | 1s | 4s | 16s | gt | max |
|---|---|---|---|---|---|---|---|---|---|---|---|
| pg153_o3_native_lto.cx7a_gcp_c2s30 | 97.388 | 2.555 | 0.037 | 0.007 | 0.010 | 0.002 | 0.459 | ||||
| pg153_o3_native_lto.cx7a1_gcp_c2s30 | 97.496 | 2.440 | 0.043 | 0.008 | 0.010 | 0.003 | 0.495 | ||||
| pg153_o3_native_lto.cx7a4_gcp_c2s30 | 97.404 | 2.537 | 0.039 | 0.007 | 0.012 | 0.001 | 0.487 | ||||
| pg153_o3_native_lto.cx7a7_gcp_c2s30 | 97.406 | 2.518 | 0.059 | 0.009 | 0.007 | 0.002 | 0.379 | ||||
| pg153_o3_native_lto.cx7a10_gcp_c2s30 | 97.720 | 2.221 | 0.039 | 0.006 | 0.011 | 0.002 | 0.940 | ||||
| pg153_o3_native_lto.cx7a12_gcp_c2s30 | 97.940 | 2.016 | 0.039 | 0.002 | 0.002 | 0.185 | |||||
| pg153_o3_native_lto.cx7a15_gcp_c2s30 | 97.478 | 2.377 | 0.111 | 0.021 | 0.011 | 0.001 | 0.667 | ||||
| pg153_o3_native_lto.cx7a16_gcp_c2s30 | 97.695 | 2.244 | 0.043 | 0.007 | 0.011 | 0.001 | 0.741 | ||||
| pg153_o3_native_lto.cx7a21_gcp_c2s30 | 97.437 | 2.506 | 0.042 | 0.005 | 0.008 | 0.002 | 0.586 | ||||
| pg153_o3_native_lto.cx7a22_gcp_c2s30 | 97.534 | 2.410 | 0.043 | 0.005 | 0.006 | 0.002 | 0.702 |
Performance metrics for the DBMS listed above. Some are normalized by throughput, others are not. Legend for results is here.
ips	qps	rps	rmbps	wps	wmbps	rpq	rkbpq	wpi	wkbpi	csps	cpups	cspq	cpupq	dbgb1	dbgb2	rss	maxop	p50	p99	tag
1019108	0	0	0.0	1009.3	331.7	0.000	0.000	0.001	0.333	85436	75.7	0.084	11	15.3	41.4	0.0	0.459	146438	41169	160m.pg153_o3_native_lto.cx7a_gcp_c2s30
1019108	0	0	0.0	1006.0	332.3	0.000	0.000	0.001	0.334	86092	75.9	0.084	11	15.3	41.4	0.0	0.495	145302	50743	160m.pg153_o3_native_lto.cx7a1_gcp_c2s30
1012658	0	0	0.0	1006.6	332.1	0.000	0.000	0.001	0.336	85914	75.7	0.085	11	15.3	41.4	0.0	0.487	144743	51044	160m.pg153_o3_native_lto.cx7a4_gcp_c2s30
1006289	0	0	0.0	1205.2	324.8	0.000	0.000	0.001	0.330	86175	76.3	0.086	11	15.3	31.4	0.0	0.379	144242	26781	160m.pg153_o3_native_lto.cx7a7_gcp_c2s30
1019108	0	0	0.0	1021.0	339.1	0.000	0.000	0.001	0.341	85703	75.2	0.084	11	15.3	41.4	0.0	0.940	147939	35975	160m.pg153_o3_native_lto.cx7a10_gcp_c2s30
1052632	0	0	0.0	1040.0	347.6	0.000	0.000	0.001	0.338	87632	77.9	0.083	11	15.3	41.4	0.0	0.185	146640	112977	160m.pg153_o3_native_lto.cx7a12_gcp_c2s30
1000000	0	0	0.0	1191.3	368.1	0.000	0.000	0.001	0.377	83337	74.0	0.083	11	15.3	42.7	0.0	0.667	145541	45051	160m.pg153_o3_native_lto.cx7a15_gcp_c2s30
1019108	0	0	0.0	1008.7	335.1	0.000	0.000	0.001	0.337	85574	75.5	0.084	11	15.3	41.4	0.0	0.741	145940	32763	160m.pg153_o3_native_lto.cx7a16_gcp_c2s30
1012658	0	0	0.0	1004.9	330.0	0.000	0.000	0.001	0.334	83867	76.9	0.083	11	15.3	41.4	0.0	0.586	145341	45568	160m.pg153_o3_native_lto.cx7a21_gcp_c2s30
1006289	0	0	0.0	1007.2	330.4	0.000	0.000	0.001	0.336	83752	77.2	0.083	12	15.3	41.4	0.0	0.702	145142	59334	160m.pg153_o3_native_lto.cx7a22_gcp_c2s30
l.x
l.x: create secondary indexes.
Average throughput:
Performance metrics for the DBMS listed above. Some are normalized by throughput, others are not. Legend for results is here.
ips	qps	rps	rmbps	wps	wmbps	rpq	rkbpq	wpi	wkbpi	csps	cpups	cspq	cpupq	dbgb1	dbgb2	rss	maxop	p50	p99	tag
2134667	0	0	0.0	1604.3	645.8	0.000	0.000	0.001	0.310	20150	35.6	0.009	3	29.4	68.3	0.1	0.001	NA	NA	160m.pg153_o3_native_lto.cx7a_gcp_c2s30
2287143	0	0	0.0	1311.8	561.0	0.000	0.000	0.001	0.251	7035	38.7	0.003	3	29.4	63.3	0.1	0.001	NA	NA	160m.pg153_o3_native_lto.cx7a1_gcp_c2s30
2106579	0	0	0.0	1551.9	637.8	0.000	0.000	0.001	0.310	18482	35.9	0.009	3	29.4	68.3	0.1	0.001	NA	NA	160m.pg153_o3_native_lto.cx7a4_gcp_c2s30
2425758	0	0	0.0	1588.4	529.4	0.000	0.000	0.001	0.223	26496	40.4	0.011	2	29.4	45.5	0.1	0.001	NA	NA	160m.pg153_o3_native_lto.cx7a7_gcp_c2s30
2134667	0	0	0.0	1562.0	659.1	0.000	0.000	0.001	0.316	19995	35.1	0.009	2	29.4	68.3	0.1	0.001	NA	NA	160m.pg153_o3_native_lto.cx7a10_gcp_c2s30
2106579	0	0	0.0	1535.9	646.4	0.000	0.000	0.001	0.314	18826	35.2	0.009	3	29.4	68.3	0.1	0.001	NA	NA	160m.pg153_o3_native_lto.cx7a12_gcp_c2s30
2354412	0	0	0.0	1727.1	574.1	0.000	0.000	0.001	0.250	23764	40.1	0.010	3	29.4	61.5	0.1	0.001	NA	NA	160m.pg153_o3_native_lto.cx7a15_gcp_c2s30
2134667	0	0	0.0	1560.9	656.3	0.000	0.000	0.001	0.315	20619	35.6	0.010	3	29.4	68.3	0.1	0.001	NA	NA	160m.pg153_o3_native_lto.cx7a16_gcp_c2s30
2287143	0	0	0.0	1290.0	553.1	0.000	0.000	0.001	0.248	6896	39.2	0.003	3	29.4	63.3	0.1	0.002	NA	NA	160m.pg153_o3_native_lto.cx7a21_gcp_c2s30
2106579	0	0	0.0	1552.2	643.5	0.000	0.000	0.001	0.313	18989	35.9	0.009	3	29.4	68.3	0.1	0.001	NA	NA	160m.pg153_o3_native_lto.cx7a22_gcp_c2s30
l.i1
l.i1: continue load after secondary indexes created. Graphs for performance per 1-second interval are here.
Average throughput:
Insert response time histogram: each cell has the percentage of responses that take <= the time in the header and max is the max response time in seconds. For the max column values in the top 25% of the range have a red background and in the bottom 25% of the range have a green background. The red background is not used when the min value is within 80% of the max value.
| dbms | 256us | 1ms | 4ms | 16ms | 64ms | 256ms | 1s | 4s | 16s | gt | max |
|---|---|---|---|---|---|---|---|---|---|---|---|
| pg153_o3_native_lto.cx7a_gcp_c2s30 | 1.742 | 97.930 | 0.265 | 0.062 | 0.001 | nonzero | 0.280 | ||||
| pg153_o3_native_lto.cx7a1_gcp_c2s30 | 3.553 | 96.372 | 0.062 | 0.012 | 0.001 | nonzero | 0.313 | ||||
| pg153_o3_native_lto.cx7a4_gcp_c2s30 | 4.377 | 95.244 | 0.309 | 0.070 | 0.001 | nonzero | 0.272 | ||||
| pg153_o3_native_lto.cx7a7_gcp_c2s30 | 0.810 | 96.149 | 1.946 | 1.090 | 0.006 | nonzero | 0.289 | ||||
| pg153_o3_native_lto.cx7a10_gcp_c2s30 | 50.878 | 48.840 | 0.231 | 0.051 | 0.001 | nonzero | 0.672 | ||||
| pg153_o3_native_lto.cx7a12_gcp_c2s30 | 50.264 | 49.572 | 0.108 | 0.053 | 0.002 | nonzero | 0.310 | ||||
| pg153_o3_native_lto.cx7a15_gcp_c2s30 | 36.244 | 62.401 | 1.129 | 0.226 | 0.002 | 0.235 | |||||
| pg153_o3_native_lto.cx7a16_gcp_c2s30 | 37.748 | 61.376 | 0.698 | 0.177 | 0.001 | 0.145 | |||||
| pg153_o3_native_lto.cx7a21_gcp_c2s30 | 35.103 | 64.510 | 0.339 | 0.048 | nonzero | 0.187 | |||||
| pg153_o3_native_lto.cx7a22_gcp_c2s30 | 32.723 | 66.403 | 0.697 | 0.176 | nonzero | nonzero | 0.458 |
Delete response time histogram: each cell has the percentage of responses that take <= the time in the header and max is the max response time in seconds. For the max column values in the top 25% of the range have a red background and in the bottom 25% of the range have a green background. The red background is not used when the min value is within 80% of the max value.
| dbms | 256us | 1ms | 4ms | 16ms | 64ms | 256ms | 1s | 4s | 16s | gt | max |
|---|---|---|---|---|---|---|---|---|---|---|---|
| pg153_o3_native_lto.cx7a_gcp_c2s30 | 83.678 | 2.417 | 2.165 | 6.631 | 5.108 | 0.001 | 0.217 | ||||
| pg153_o3_native_lto.cx7a1_gcp_c2s30 | 83.128 | 2.967 | 2.035 | 7.228 | 4.642 | 0.001 | 0.253 | ||||
| pg153_o3_native_lto.cx7a4_gcp_c2s30 | 83.578 | 2.502 | 2.163 | 6.811 | 4.946 | 0.001 | nonzero | 0.274 | |||
| pg153_o3_native_lto.cx7a7_gcp_c2s30 | 80.806 | 3.264 | 1.853 | 7.534 | 6.521 | 0.022 | nonzero | 0.267 | |||
| pg153_o3_native_lto.cx7a10_gcp_c2s30 | 83.360 | 3.040 | 2.530 | 7.082 | 3.987 | 0.001 | nonzero | 0.679 | |||
| pg153_o3_native_lto.cx7a12_gcp_c2s30 | 83.658 | 2.992 | 2.181 | 7.310 | 3.853 | 0.006 | nonzero | 0.318 | |||
| pg153_o3_native_lto.cx7a15_gcp_c2s30 | 81.336 | 4.293 | 2.110 | 7.726 | 4.531 | 0.003 | 0.233 | ||||
| pg153_o3_native_lto.cx7a16_gcp_c2s30 | 77.957 | 8.996 | 10.550 | 2.403 | 0.094 | nonzero | 0.144 | ||||
| pg153_o3_native_lto.cx7a21_gcp_c2s30 | 76.980 | 9.905 | 11.409 | 1.685 | 0.021 | nonzero | 0.189 | ||||
| pg153_o3_native_lto.cx7a22_gcp_c2s30 | 77.848 | 9.021 | 10.874 | 2.166 | 0.091 | nonzero | nonzero | 0.458 |
Performance metrics for the DBMS listed above. Some are normalized by throughput, others are not. Legend for results is here.
ips	qps	rps	rmbps	wps	wmbps	rpq	rkbpq	wpi	wkbpi	csps	cpups	cspq	cpupq	dbgb1	dbgb2	rss	maxop	p50	p99	tag
138768	0	50	0.4	1479.3	178.2	0.000	0.003	0.011	1.315	63281	65.6	0.456	71	48.9	119.0	0.0	0.280	4295	1798	160m.pg153_o3_native_lto.cx7a_gcp_c2s30
134273	0	3	0.0	1403.7	145.0	0.000	0.000	0.010	1.106	60830	63.5	0.453	71	48.8	117.0	0.0	0.313	3596	1898	160m.pg153_o3_native_lto.cx7a1_gcp_c2s30
136565	0	53	0.4	1441.6	173.9	0.000	0.003	0.011	1.304	62649	64.3	0.459	71	48.8	118.8	0.0	0.272	3947	1798	160m.pg153_o3_native_lto.cx7a4_gcp_c2s30
108284	0	4	0.0	18108.3	840.1	0.000	0.000	0.167	7.944	48501	60.0	0.448	83	48.6	64.6	0.0	0.289	3896	1199	160m.pg153_o3_native_lto.cx7a7_gcp_c2s30
153935	0	60	0.5	1680.7	198.4	0.000	0.003	0.011	1.320	68348	64.7	0.444	63	49.0	119.1	0.0	0.672	4645	2049	160m.pg153_o3_native_lto.cx7a10_gcp_c2s30
154410	0	58	0.5	1629.7	198.9	0.000	0.003	0.011	1.319	68621	65.1	0.444	63	49.0	119.1	0.0	0.310	4845	2099	160m.pg153_o3_native_lto.cx7a12_gcp_c2s30
139689	0	22	0.2	10250.6	594.2	0.000	0.001	0.073	4.356	60006	64.8	0.430	70	48.8	80.9	0.0	0.235	4545	1798	160m.pg153_o3_native_lto.cx7a15_gcp_c2s30
271003	0	101	0.8	1770.8	282.7	0.000	0.003	0.007	1.068	103151	73.1	0.381	40	41.3	111.4	0.0	0.145	42454	4147	160m.pg153_o3_native_lto.cx7a16_gcp_c2s30
279427	0	13	0.1	1428.5	224.4	0.000	0.000	0.005	0.822	104169	76.3	0.373	41	41.3	111.4	0.0	0.187	42354	7891	160m.pg153_o3_native_lto.cx7a21_gcp_c2s30
267112	0	96	0.7	1697.8	275.9	0.000	0.003	0.006	1.058	101535	73.7	0.380	41	41.6	111.6	0.0	0.458	41657	4945	160m.pg153_o3_native_lto.cx7a22_gcp_c2s30
q100.1
q100.1: range queries with 100 insert/s per client. Graphs for performance per 1-second interval are here.
Average throughput:
Query response time histogram: each cell has the percentage of responses that take <= the time in the header and max is the max response time in seconds. For max values in the top 25% of the range have a red background and in the bottom 25% of the range have a green background. The red background is not used when the min value is within 80% of the max value.
| dbms | 256us | 1ms | 4ms | 16ms | 64ms | 256ms | 1s | 4s | 16s | gt | max |
|---|---|---|---|---|---|---|---|---|---|---|---|
| pg153_o3_native_lto.cx7a_gcp_c2s30 | 99.995 | 0.004 | 0.001 | nonzero | 0.015 | ||||||
| pg153_o3_native_lto.cx7a1_gcp_c2s30 | 99.995 | 0.004 | 0.001 | nonzero | 0.008 | ||||||
| pg153_o3_native_lto.cx7a4_gcp_c2s30 | 99.996 | 0.003 | 0.001 | nonzero | 0.008 | ||||||
| pg153_o3_native_lto.cx7a7_gcp_c2s30 | 99.995 | 0.004 | 0.001 | nonzero | 0.006 | ||||||
| pg153_o3_native_lto.cx7a10_gcp_c2s30 | 99.995 | 0.004 | 0.001 | nonzero | nonzero | 0.021 | |||||
| pg153_o3_native_lto.cx7a12_gcp_c2s30 | 99.995 | 0.004 | 0.001 | nonzero | 0.008 | ||||||
| pg153_o3_native_lto.cx7a15_gcp_c2s30 | 99.995 | 0.004 | 0.001 | nonzero | 0.009 | ||||||
| pg153_o3_native_lto.cx7a16_gcp_c2s30 | 99.995 | 0.004 | 0.001 | nonzero | 0.008 | ||||||
| pg153_o3_native_lto.cx7a21_gcp_c2s30 | 99.996 | 0.003 | 0.001 | nonzero | 0.004 | ||||||
| pg153_o3_native_lto.cx7a22_gcp_c2s30 | 99.996 | 0.003 | 0.001 | nonzero | 0.011 |
Insert response time histogram: each cell has the percentage of responses that take <= the time in the header and max is the max response time in seconds. For max values in the top 25% of the range have a red background and in the bottom 25% of the range have a green background. The red background is not used when the min value is within 80% of the max value.
| dbms | 256us | 1ms | 4ms | 16ms | 64ms | 256ms | 1s | 4s | 16s | gt | max |
|---|---|---|---|---|---|---|---|---|---|---|---|
| pg153_o3_native_lto.cx7a_gcp_c2s30 | 0.005 | 99.991 | 0.003 | 0.012 | |||||||
| pg153_o3_native_lto.cx7a1_gcp_c2s30 | 0.002 | 99.677 | 0.321 | 0.011 | |||||||
| pg153_o3_native_lto.cx7a4_gcp_c2s30 | 0.205 | 99.793 | 0.002 | 0.013 | |||||||
| pg153_o3_native_lto.cx7a7_gcp_c2s30 | 99.988 | 0.012 | 0.013 | ||||||||
| pg153_o3_native_lto.cx7a10_gcp_c2s30 | 0.137 | 99.859 | 0.003 | 0.015 | |||||||
| pg153_o3_native_lto.cx7a12_gcp_c2s30 | 0.368 | 99.632 | 0.004 | ||||||||
| pg153_o3_native_lto.cx7a15_gcp_c2s30 | 99.997 | 0.003 | 0.008 | ||||||||
| pg153_o3_native_lto.cx7a16_gcp_c2s30 | 0.785 | 99.214 | 0.002 | 0.009 | |||||||
| pg153_o3_native_lto.cx7a21_gcp_c2s30 | 8.606 | 91.276 | 0.118 | 0.005 | |||||||
| pg153_o3_native_lto.cx7a22_gcp_c2s30 | 9.299 | 90.700 | 0.002 | 0.011 |
Delete response time histogram: each cell has the percentage of responses that take <= the time in the header and max is the max response time in seconds. For max values in the top 25% of the range have a red background and in the bottom 25% of the range have a green background. The red background is not used when the min value is within 80% of the max value.
| dbms | 256us | 1ms | 4ms | 16ms | 64ms | 256ms | 1s | 4s | 16s | gt | max |
|---|---|---|---|---|---|---|---|---|---|---|---|
| pg153_o3_native_lto.cx7a_gcp_c2s30 | 50.700 | 29.349 | 19.950 | 0.002 | 0.009 | ||||||
| pg153_o3_native_lto.cx7a1_gcp_c2s30 | 58.682 | 19.151 | 22.135 | 0.031 | 0.012 | ||||||
| pg153_o3_native_lto.cx7a4_gcp_c2s30 | 65.351 | 14.233 | 20.411 | 0.005 | 0.011 | ||||||
| pg153_o3_native_lto.cx7a7_gcp_c2s30 | 59.476 | 19.351 | 21.161 | 0.012 | 0.006 | ||||||
| pg153_o3_native_lto.cx7a10_gcp_c2s30 | 61.530 | 27.865 | 10.602 | 0.002 | 0.002 | 0.016 | |||||
| pg153_o3_native_lto.cx7a12_gcp_c2s30 | 62.814 | 16.130 | 20.849 | 0.207 | 0.012 | ||||||
| pg153_o3_native_lto.cx7a15_gcp_c2s30 | 62.724 | 24.929 | 12.345 | 0.002 | 0.011 | ||||||
| pg153_o3_native_lto.cx7a16_gcp_c2s30 | 56.481 | 34.075 | 9.439 | 0.005 | 0.014 | ||||||
| pg153_o3_native_lto.cx7a21_gcp_c2s30 | 59.547 | 25.849 | 14.556 | 0.049 | 0.005 | ||||||
| pg153_o3_native_lto.cx7a22_gcp_c2s30 | 63.491 | 26.333 | 10.175 | 0.004 |
Performance metrics for the DBMS listed above. Some are normalized by throughput, others are not. Legend for results is here.
ips	qps	rps	rmbps	wps	wmbps	rpq	rkbpq	wpi	wkbpi	csps	cpups	cspq	cpupq	dbgb1	dbgb2	rss	maxop	p50	p99	tag
797	116476	0	0.0	1935.7	31.0	0.000	0.000	2.428	39.799	444154	53.1	3.813	68	48.8	86.6	0.0	0.015	14725	14400	160m.pg153_o3_native_lto.cx7a_gcp_c2s30
798	115997	0	0.0	1919.7	27.9	0.000	0.000	2.407	35.809	442096	53.1	3.811	69	48.5	88.5	0.0	0.008	14480	14118	160m.pg153_o3_native_lto.cx7a1_gcp_c2s30
798	118040	0	0.0	293.5	12.4	0.000	0.000	0.368	15.901	449234	52.9	3.806	67	48.8	118.8	0.0	0.008	14725	14464	160m.pg153_o3_native_lto.cx7a4_gcp_c2s30
798	116342	0	0.0	1862.0	27.9	0.000	0.000	2.335	35.800	443541	53.1	3.812	68	48.5	61.2	0.0	0.006	14544	14262	160m.pg153_o3_native_lto.cx7a7_gcp_c2s30
798	118059	0	0.0	1937.2	29.8	0.000	0.000	2.429	38.299	450056	53.1	3.812	67	48.9	82.8	0.0	0.021	14629	14336	160m.pg153_o3_native_lto.cx7a10_gcp_c2s30
797	118787	0	0.0	1988.7	30.2	0.000	0.000	2.494	38.757	452955	53.1	3.813	67	49.0	86.0	0.0	0.008	14912	14432	160m.pg153_o3_native_lto.cx7a12_gcp_c2s30
797	117862	0	0.0	1921.6	30.1	0.000	0.000	2.410	38.601	449350	53.0	3.813	67	48.8	64.7	0.0	0.009	14736	14453	160m.pg153_o3_native_lto.cx7a15_gcp_c2s30
797	118457	0	0.0	1752.4	28.3	0.000	0.000	2.198	36.350	451625	53.2	3.813	67	41.3	73.9	0.0	0.008	14880	14496	160m.pg153_o3_native_lto.cx7a16_gcp_c2s30
797	117518	0	0.0	240.5	10.1	0.000	0.000	0.302	12.999	447231	53.0	3.806	68	41.3	111.4	0.0	0.004	14816	14582	160m.pg153_o3_native_lto.cx7a21_gcp_c2s30
798	117159	0	0.0	236.4	10.8	0.000	0.000	0.296	13.910	445836	53.0	3.805	68	41.6	111.6	0.0	0.011	14720	14480	160m.pg153_o3_native_lto.cx7a22_gcp_c2s30
q500.1
q500.1: range queries with 500 insert/s per client. Graphs for performance per 1-second interval are here.
Average throughput:
Query response time histogram: each cell has the percentage of responses that take <= the time in the header and max is the max response time in seconds. For max values in the top 25% of the range have a red background and in the bottom 25% of the range have a green background. The red background is not used when the min value is within 80% of the max value.
| dbms | 256us | 1ms | 4ms | 16ms | 64ms | 256ms | 1s | 4s | 16s | gt | max |
|---|---|---|---|---|---|---|---|---|---|---|---|
| pg153_o3_native_lto.cx7a_gcp_c2s30 | 99.976 | 0.015 | 0.008 | 0.001 | nonzero | 0.029 | |||||
| pg153_o3_native_lto.cx7a1_gcp_c2s30 | 99.977 | 0.017 | 0.006 | nonzero | nonzero | 0.020 | |||||
| pg153_o3_native_lto.cx7a4_gcp_c2s30 | 99.984 | 0.009 | 0.006 | nonzero | nonzero | 0.025 | |||||
| pg153_o3_native_lto.cx7a7_gcp_c2s30 | 99.972 | 0.019 | 0.009 | 0.001 | nonzero | nonzero | 0.100 | ||||
| pg153_o3_native_lto.cx7a10_gcp_c2s30 | 99.977 | 0.015 | 0.008 | nonzero | nonzero | 0.020 | |||||
| pg153_o3_native_lto.cx7a12_gcp_c2s30 | 99.977 | 0.014 | 0.008 | nonzero | nonzero | 0.054 | |||||
| pg153_o3_native_lto.cx7a15_gcp_c2s30 | 99.976 | 0.016 | 0.008 | nonzero | nonzero | 0.027 | |||||
| pg153_o3_native_lto.cx7a16_gcp_c2s30 | 99.977 | 0.014 | 0.008 | 0.001 | nonzero | 0.045 | |||||
| pg153_o3_native_lto.cx7a21_gcp_c2s30 | 99.988 | 0.008 | 0.004 | nonzero | nonzero | 0.053 | |||||
| pg153_o3_native_lto.cx7a22_gcp_c2s30 | 99.984 | 0.009 | 0.006 | nonzero | nonzero | 0.027 |
Insert response time histogram: each cell has the percentage of responses that take <= the time in the header and max is the max response time in seconds. For max values in the top 25% of the range have a red background and in the bottom 25% of the range have a green background. The red background is not used when the min value is within 80% of the max value.
| dbms | 256us | 1ms | 4ms | 16ms | 64ms | 256ms | 1s | 4s | 16s | gt | max |
|---|---|---|---|---|---|---|---|---|---|---|---|
| pg153_o3_native_lto.cx7a_gcp_c2s30 | 0.001 | 98.993 | 0.970 | 0.035 | 0.031 | ||||||
| pg153_o3_native_lto.cx7a1_gcp_c2s30 | 99.319 | 0.670 | 0.011 | 0.035 | |||||||
| pg153_o3_native_lto.cx7a4_gcp_c2s30 | 5.046 | 94.898 | 0.056 | 0.001 | 0.016 | ||||||
| pg153_o3_native_lto.cx7a7_gcp_c2s30 | 0.290 | 99.147 | 0.478 | 0.084 | 0.044 | ||||||
| pg153_o3_native_lto.cx7a10_gcp_c2s30 | 5.194 | 94.351 | 0.447 | 0.008 | 0.024 | ||||||
| pg153_o3_native_lto.cx7a12_gcp_c2s30 | 4.152 | 95.775 | 0.072 | 0.001 | 0.020 | ||||||
| pg153_o3_native_lto.cx7a15_gcp_c2s30 | 3.940 | 95.760 | 0.288 | 0.012 | 0.025 | ||||||
| pg153_o3_native_lto.cx7a16_gcp_c2s30 | 10.657 | 88.224 | 1.102 | 0.017 | 0.033 | ||||||
| pg153_o3_native_lto.cx7a21_gcp_c2s30 | 47.111 | 52.824 | 0.065 | nonzero | 0.017 | ||||||
| pg153_o3_native_lto.cx7a22_gcp_c2s30 | 50.998 | 48.894 | 0.105 | 0.003 | 0.028 |
Delete response time histogram: each cell has the percentage of responses that take <= the time in the header and max is the max response time in seconds. For max values in the top 25% of the range have a red background and in the bottom 25% of the range have a green background. The red background is not used when the min value is within 80% of the max value.
| dbms | 256us | 1ms | 4ms | 16ms | 64ms | 256ms | 1s | 4s | 16s | gt | max |
|---|---|---|---|---|---|---|---|---|---|---|---|
| pg153_o3_native_lto.cx7a_gcp_c2s30 | 77.168 | 1.455 | 1.811 | 19.084 | 0.482 | 0.046 | |||||
| pg153_o3_native_lto.cx7a1_gcp_c2s30 | 78.661 | 2.671 | 2.428 | 16.218 | 0.022 | 0.031 | |||||
| pg153_o3_native_lto.cx7a4_gcp_c2s30 | 79.250 | 1.339 | 4.105 | 15.230 | 0.076 | 0.033 | |||||
| pg153_o3_native_lto.cx7a7_gcp_c2s30 | 80.732 | 1.723 | 3.311 | 14.208 | 0.026 | 0.042 | |||||
| pg153_o3_native_lto.cx7a10_gcp_c2s30 | 77.542 | 1.203 | 4.002 | 17.228 | 0.024 | 0.031 | |||||
| pg153_o3_native_lto.cx7a12_gcp_c2s30 | 79.493 | 2.157 | 3.972 | 14.371 | 0.007 | 0.027 | |||||
| pg153_o3_native_lto.cx7a15_gcp_c2s30 | 78.761 | 1.375 | 4.188 | 15.655 | 0.020 | 0.033 | |||||
| pg153_o3_native_lto.cx7a16_gcp_c2s30 | 77.719 | 12.368 | 6.163 | 3.742 | 0.008 | 0.020 | |||||
| pg153_o3_native_lto.cx7a21_gcp_c2s30 | 77.995 | 8.564 | 11.536 | 1.905 | 0.012 | ||||||
| pg153_o3_native_lto.cx7a22_gcp_c2s30 | 78.286 | 7.973 | 10.773 | 2.967 | 0.001 | 0.021 |
Performance metrics for the DBMS listed above. Some are normalized by throughput, others are not. Legend for results is here.
ips	qps	rps	rmbps	wps	wmbps	rpq	rkbpq	wpi	wkbpi	csps	cpups	cspq	cpupq	dbgb1	dbgb2	rss	maxop	p50	p99	tag
3988	111377	0	0.0	3106.8	71.6	0.000	0.000	0.779	18.375	422362	54.7	3.792	74	48.8	72.3	0.0	0.029	13990	13441	160m.pg153_o3_native_lto.cx7a_gcp_c2s30
3987	110379	0	0.0	3020.3	62.5	0.000	0.000	0.758	16.043	420743	54.6	3.812	74	48.5	64.6	0.0	0.020	13814	13281	160m.pg153_o3_native_lto.cx7a1_gcp_c2s30
3987	113389	0	0.0	384.1	18.2	0.000	0.000	0.096	4.685	431629	54.0	3.807	71	48.8	113.8	0.0	0.025	14112	13585	160m.pg153_o3_native_lto.cx7a4_gcp_c2s30
3988	110753	0	0.0	4680.0	91.4	0.000	0.000	1.174	23.481	423798	54.4	3.827	74	48.5	64.5	0.0	0.100	13841	13287	160m.pg153_o3_native_lto.cx7a7_gcp_c2s30
3987	112370	0	0.0	3040.5	70.6	0.000	0.000	0.763	18.121	428750	54.4	3.816	73	48.9	72.0	0.0	0.020	14016	13473	160m.pg153_o3_native_lto.cx7a10_gcp_c2s30
3987	113830	0	0.0	3082.7	71.7	0.000	0.000	0.773	18.417	435079	54.3	3.822	72	49.0	72.4	0.0	0.054	14272	13750	160m.pg153_o3_native_lto.cx7a12_gcp_c2s30
3987	112106	0	0.0	3054.0	72.3	0.000	0.000	0.766	18.563	428304	54.3	3.821	73	48.8	69.8	0.0	0.027	13942	13521	160m.pg153_o3_native_lto.cx7a15_gcp_c2s30
3988	114614	0	0.0	2439.7	70.4	0.000	0.000	0.612	18.068	437951	53.9	3.821	71	41.3	67.0	0.0	0.045	14352	12578	160m.pg153_o3_native_lto.cx7a16_gcp_c2s30
3988	114826	0	0.0	288.1	14.6	0.000	0.000	0.072	3.749	437372	53.7	3.809	70	41.3	104.1	0.0	0.053	14400	12498	160m.pg153_o3_native_lto.cx7a21_gcp_c2s30
3987	113983	0	0.0	297.2	16.4	0.000	0.000	0.075	4.207	434266	53.6	3.810	71	41.6	106.3	0.0	0.027	14241	12371	160m.pg153_o3_native_lto.cx7a22_gcp_c2s30
q1000.1
q1000.1: range queries with 1000 insert/s per client. Graphs for performance per 1-second interval are here.
Average throughput:
Query response time histogram: each cell has the percentage of responses that take <= the time in the header and max is the max response time in seconds. For max values in the top 25% of the range have a red background and in the bottom 25% of the range have a green background. The red background is not used when the min value is within 80% of the max value.
| dbms | 256us | 1ms | 4ms | 16ms | 64ms | 256ms | 1s | 4s | 16s | gt | max |
|---|---|---|---|---|---|---|---|---|---|---|---|
| pg153_o3_native_lto.cx7a_gcp_c2s30 | 99.940 | 0.042 | 0.016 | 0.003 | nonzero | nonzero | 0.081 | ||||
| pg153_o3_native_lto.cx7a1_gcp_c2s30 | 99.942 | 0.046 | 0.011 | 0.001 | nonzero | 0.022 | |||||
| pg153_o3_native_lto.cx7a4_gcp_c2s30 | 99.952 | 0.034 | 0.014 | 0.001 | nonzero | nonzero | 0.083 | ||||
| pg153_o3_native_lto.cx7a7_gcp_c2s30 | 99.904 | 0.066 | 0.023 | 0.006 | nonzero | nonzero | nonzero | 1.221 | |||
| pg153_o3_native_lto.cx7a10_gcp_c2s30 | 99.940 | 0.040 | 0.016 | 0.003 | nonzero | 0.043 | |||||
| pg153_o3_native_lto.cx7a12_gcp_c2s30 | 99.942 | 0.042 | 0.015 | 0.001 | nonzero | nonzero | 0.082 | ||||
| pg153_o3_native_lto.cx7a15_gcp_c2s30 | 99.932 | 0.045 | 0.018 | 0.005 | nonzero | nonzero | 0.103 | ||||
| pg153_o3_native_lto.cx7a16_gcp_c2s30 | 99.948 | 0.036 | 0.014 | 0.002 | nonzero | 0.033 | |||||
| pg153_o3_native_lto.cx7a21_gcp_c2s30 | 99.960 | 0.030 | 0.010 | nonzero | nonzero | 0.047 | |||||
| pg153_o3_native_lto.cx7a22_gcp_c2s30 | 99.963 | 0.027 | 0.010 | nonzero | nonzero | 0.052 |
Insert response time histogram: each cell has the percentage of responses that take <= the time in the header and max is the max response time in seconds. For max values in the top 25% of the range have a red background and in the bottom 25% of the range have a green background. The red background is not used when the min value is within 80% of the max value.
| dbms | 256us | 1ms | 4ms | 16ms | 64ms | 256ms | 1s | 4s | 16s | gt | max |
|---|---|---|---|---|---|---|---|---|---|---|---|
| pg153_o3_native_lto.cx7a_gcp_c2s30 | 0.196 | 97.018 | 2.608 | 0.178 | 0.049 | ||||||
| pg153_o3_native_lto.cx7a1_gcp_c2s30 | 0.003 | 98.985 | 0.985 | 0.027 | 0.025 | ||||||
| pg153_o3_native_lto.cx7a4_gcp_c2s30 | 3.076 | 95.895 | 0.921 | 0.107 | 0.060 | ||||||
| pg153_o3_native_lto.cx7a7_gcp_c2s30 | 0.493 | 95.872 | 3.289 | 0.342 | 0.003 | 0.001 | 0.001 | 1.225 | |||
| pg153_o3_native_lto.cx7a10_gcp_c2s30 | 17.524 | 79.896 | 2.428 | 0.152 | 0.047 | ||||||
| pg153_o3_native_lto.cx7a12_gcp_c2s30 | 16.033 | 83.493 | 0.461 | 0.014 | 0.059 | ||||||
| pg153_o3_native_lto.cx7a15_gcp_c2s30 | 15.704 | 80.619 | 3.165 | 0.511 | 0.001 | 0.163 | |||||
| pg153_o3_native_lto.cx7a16_gcp_c2s30 | 32.052 | 65.428 | 2.387 | 0.133 | 0.054 | ||||||
| pg153_o3_native_lto.cx7a21_gcp_c2s30 | 59.522 | 40.113 | 0.355 | 0.010 | 0.030 | ||||||
| pg153_o3_native_lto.cx7a22_gcp_c2s30 | 63.156 | 36.458 | 0.371 | 0.015 | 0.027 |
Delete response time histogram: each cell has the percentage of responses that take <= the time in the header and max is the max response time in seconds. For max values in the top 25% of the range have a red background and in the bottom 25% of the range have a green background. The red background is not used when the min value is within 80% of the max value.
| dbms | 256us | 1ms | 4ms | 16ms | 64ms | 256ms | 1s | 4s | 16s | gt | max |
|---|---|---|---|---|---|---|---|---|---|---|---|
| pg153_o3_native_lto.cx7a_gcp_c2s30 | 78.385 | 2.577 | 1.654 | 11.556 | 5.828 | 0.057 | |||||
| pg153_o3_native_lto.cx7a1_gcp_c2s30 | 76.201 | 4.903 | 3.019 | 10.544 | 5.333 | 0.042 | |||||
| pg153_o3_native_lto.cx7a4_gcp_c2s30 | 76.596 | 3.787 | 3.514 | 11.213 | 4.891 | 0.062 | |||||
| pg153_o3_native_lto.cx7a7_gcp_c2s30 | 75.976 | 4.251 | 2.160 | 13.040 | 4.570 | 0.001 | 0.001 | 0.001 | 1.234 | ||
| pg153_o3_native_lto.cx7a10_gcp_c2s30 | 77.193 | 3.239 | 2.838 | 13.660 | 3.070 | 0.041 | |||||
| pg153_o3_native_lto.cx7a12_gcp_c2s30 | 77.794 | 3.473 | 2.820 | 12.302 | 3.610 | 0.058 | |||||
| pg153_o3_native_lto.cx7a15_gcp_c2s30 | 76.037 | 4.329 | 2.855 | 13.344 | 3.435 | nonzero | 0.102 | ||||
| pg153_o3_native_lto.cx7a16_gcp_c2s30 | 79.963 | 3.918 | 6.501 | 9.547 | 0.071 | 0.041 | |||||
| pg153_o3_native_lto.cx7a21_gcp_c2s30 | 78.222 | 7.030 | 9.877 | 4.867 | 0.004 | 0.026 | |||||
| pg153_o3_native_lto.cx7a22_gcp_c2s30 | 78.666 | 8.567 | 6.686 | 6.074 | 0.007 | 0.024 |
Performance metrics for the DBMS listed above. Some are normalized by throughput, others are not. Legend for results is here.
ips	qps	rps	rmbps	wps	wmbps	rpq	rkbpq	wpi	wkbpi	csps	cpups	cspq	cpupq	dbgb1	dbgb2	rss	maxop	p50	p99	tag
7976	107936	0	0.0	2591.2	94.2	0.000	0.000	0.325	12.093	404741	56.5	3.750	79	48.6	77.2	0.1	0.081	13585	12263	160m.pg153_o3_native_lto.cx7a_gcp_c2s30
7976	106366	0	0.0	2554.5	81.3	0.000	0.000	0.320	10.443	400379	56.8	3.764	80	48.6	67.3	0.1	0.022	13505	12227	160m.pg153_o3_native_lto.cx7a1_gcp_c2s30
7976	108515	0	0.0	268.4	21.3	0.000	0.000	0.034	2.729	410380	56.0	3.782	77	48.7	109.1	0.1	0.083	13494	12291	160m.pg153_o3_native_lto.cx7a4_gcp_c2s30
7976	105171	0	0.0	9828.3	194.4	0.000	0.000	1.232	24.960	402022	56.5	3.823	81	48.4	64.5	0.1	1.221	13345	11783	160m.pg153_o3_native_lto.cx7a7_gcp_c2s30
7976	109517	0	0.0	2643.1	93.0	0.000	0.000	0.331	11.938	413363	56.1	3.774	77	48.9	77.7	0.1	0.043	13537	12359	160m.pg153_o3_native_lto.cx7a10_gcp_c2s30
7978	109404	0	0.0	2608.1	94.5	0.000	0.000	0.327	12.124	415287	56.1	3.796	77	48.9	77.6	0.1	0.082	13750	12679	160m.pg153_o3_native_lto.cx7a12_gcp_c2s30
7976	108261	0	0.0	2442.8	96.3	0.000	0.000	0.306	12.363	409177	55.9	3.780	77	48.8	77.6	0.1	0.103	13745	12450	160m.pg153_o3_native_lto.cx7a15_gcp_c2s30
7976	112476	0	0.0	2095.5	87.5	0.000	0.000	0.263	11.233	427460	55.0	3.800	73	41.4	69.9	0.0	0.033	14193	12291	160m.pg153_o3_native_lto.cx7a16_gcp_c2s30
7976	112689	0	0.0	177.9	17.0	0.000	0.000	0.022	2.178	427833	54.6	3.797	73	41.3	97.5	0.0	0.047	14176	12211	160m.pg153_o3_native_lto.cx7a21_gcp_c2s30
7978	111897	0	0.0	191.9	19.0	0.000	0.000	0.024	2.438	425311	54.5	3.801	73	41.6	101.5	0.0	0.052	14150	12083	160m.pg153_o3_native_lto.cx7a22_gcp_c2s30
l.i0
l.i0: load without secondary indexes
Performance metrics for all DBMS, not just the ones listed above. Some are normalized by throughput, others are not. Legend for results is here.
ips	qps	rps	rmbps	wps	wmbps	rpq	rkbpq	wpi	wkbpi	csps	cpups	cspq	cpupq	dbgb1	dbgb2	rss	maxop	p50	p99	tag
1019108	0	0	0.0	1009.3	331.7	0.000	0.000	0.001	0.333	85436	75.7	0.084	11	15.3	41.4	0.0	0.459	146438	41169	160m.pg153_o3_native_lto.cx7a_gcp_c2s30
1019108	0	0	0.0	1006.0	332.3	0.000	0.000	0.001	0.334	86092	75.9	0.084	11	15.3	41.4	0.0	0.495	145302	50743	160m.pg153_o3_native_lto.cx7a1_gcp_c2s30
1012658	0	0	0.0	1006.6	332.1	0.000	0.000	0.001	0.336	85914	75.7	0.085	11	15.3	41.4	0.0	0.487	144743	51044	160m.pg153_o3_native_lto.cx7a4_gcp_c2s30
1006289	0	0	0.0	1205.2	324.8	0.000	0.000	0.001	0.330	86175	76.3	0.086	11	15.3	31.4	0.0	0.379	144242	26781	160m.pg153_o3_native_lto.cx7a7_gcp_c2s30
1019108	0	0	0.0	1021.0	339.1	0.000	0.000	0.001	0.341	85703	75.2	0.084	11	15.3	41.4	0.0	0.940	147939	35975	160m.pg153_o3_native_lto.cx7a10_gcp_c2s30
1052632	0	0	0.0	1040.0	347.6	0.000	0.000	0.001	0.338	87632	77.9	0.083	11	15.3	41.4	0.0	0.185	146640	112977	160m.pg153_o3_native_lto.cx7a12_gcp_c2s30
1000000	0	0	0.0	1191.3	368.1	0.000	0.000	0.001	0.377	83337	74.0	0.083	11	15.3	42.7	0.0	0.667	145541	45051	160m.pg153_o3_native_lto.cx7a15_gcp_c2s30
1019108	0	0	0.0	1008.7	335.1	0.000	0.000	0.001	0.337	85574	75.5	0.084	11	15.3	41.4	0.0	0.741	145940	32763	160m.pg153_o3_native_lto.cx7a16_gcp_c2s30
1012658	0	0	0.0	1004.9	330.0	0.000	0.000	0.001	0.334	83867	76.9	0.083	11	15.3	41.4	0.0	0.586	145341	45568	160m.pg153_o3_native_lto.cx7a21_gcp_c2s30
1006289	0	0	0.0	1007.2	330.4	0.000	0.000	0.001	0.336	83752	77.2	0.083	12	15.3	41.4	0.0	0.702	145142	59334	160m.pg153_o3_native_lto.cx7a22_gcp_c2s30
l.x
l.x: create secondary indexes
Performance metrics for all DBMS, not just the ones listed above. Some are normalized by throughput, others are not. Legend for results is here.
ips	qps	rps	rmbps	wps	wmbps	rpq	rkbpq	wpi	wkbpi	csps	cpups	cspq	cpupq	dbgb1	dbgb2	rss	maxop	p50	p99	tag
2134667	0	0	0.0	1604.3	645.8	0.000	0.000	0.001	0.310	20150	35.6	0.009	3	29.4	68.3	0.1	0.001	NA	NA	160m.pg153_o3_native_lto.cx7a_gcp_c2s30
2287143	0	0	0.0	1311.8	561.0	0.000	0.000	0.001	0.251	7035	38.7	0.003	3	29.4	63.3	0.1	0.001	NA	NA	160m.pg153_o3_native_lto.cx7a1_gcp_c2s30
2106579	0	0	0.0	1551.9	637.8	0.000	0.000	0.001	0.310	18482	35.9	0.009	3	29.4	68.3	0.1	0.001	NA	NA	160m.pg153_o3_native_lto.cx7a4_gcp_c2s30
2425758	0	0	0.0	1588.4	529.4	0.000	0.000	0.001	0.223	26496	40.4	0.011	2	29.4	45.5	0.1	0.001	NA	NA	160m.pg153_o3_native_lto.cx7a7_gcp_c2s30
2134667	0	0	0.0	1562.0	659.1	0.000	0.000	0.001	0.316	19995	35.1	0.009	2	29.4	68.3	0.1	0.001	NA	NA	160m.pg153_o3_native_lto.cx7a10_gcp_c2s30
2106579	0	0	0.0	1535.9	646.4	0.000	0.000	0.001	0.314	18826	35.2	0.009	3	29.4	68.3	0.1	0.001	NA	NA	160m.pg153_o3_native_lto.cx7a12_gcp_c2s30
2354412	0	0	0.0	1727.1	574.1	0.000	0.000	0.001	0.250	23764	40.1	0.010	3	29.4	61.5	0.1	0.001	NA	NA	160m.pg153_o3_native_lto.cx7a15_gcp_c2s30
2134667	0	0	0.0	1560.9	656.3	0.000	0.000	0.001	0.315	20619	35.6	0.010	3	29.4	68.3	0.1	0.001	NA	NA	160m.pg153_o3_native_lto.cx7a16_gcp_c2s30
2287143	0	0	0.0	1290.0	553.1	0.000	0.000	0.001	0.248	6896	39.2	0.003	3	29.4	63.3	0.1	0.002	NA	NA	160m.pg153_o3_native_lto.cx7a21_gcp_c2s30
2106579	0	0	0.0	1552.2	643.5	0.000	0.000	0.001	0.313	18989	35.9	0.009	3	29.4	68.3	0.1	0.001	NA	NA	160m.pg153_o3_native_lto.cx7a22_gcp_c2s30
l.i1
l.i1: continue load after secondary indexes created
Performance metrics for all DBMS, not just the ones listed above. Some are normalized by throughput, others are not. Legend for results is here.
ips	qps	rps	rmbps	wps	wmbps	rpq	rkbpq	wpi	wkbpi	csps	cpups	cspq	cpupq	dbgb1	dbgb2	rss	maxop	p50	p99	tag
138768	0	50	0.4	1479.3	178.2	0.000	0.003	0.011	1.315	63281	65.6	0.456	71	48.9	119.0	0.0	0.280	4295	1798	160m.pg153_o3_native_lto.cx7a_gcp_c2s30
134273	0	3	0.0	1403.7	145.0	0.000	0.000	0.010	1.106	60830	63.5	0.453	71	48.8	117.0	0.0	0.313	3596	1898	160m.pg153_o3_native_lto.cx7a1_gcp_c2s30
136565	0	53	0.4	1441.6	173.9	0.000	0.003	0.011	1.304	62649	64.3	0.459	71	48.8	118.8	0.0	0.272	3947	1798	160m.pg153_o3_native_lto.cx7a4_gcp_c2s30
108284	0	4	0.0	18108.3	840.1	0.000	0.000	0.167	7.944	48501	60.0	0.448	83	48.6	64.6	0.0	0.289	3896	1199	160m.pg153_o3_native_lto.cx7a7_gcp_c2s30
153935	0	60	0.5	1680.7	198.4	0.000	0.003	0.011	1.320	68348	64.7	0.444	63	49.0	119.1	0.0	0.672	4645	2049	160m.pg153_o3_native_lto.cx7a10_gcp_c2s30
154410	0	58	0.5	1629.7	198.9	0.000	0.003	0.011	1.319	68621	65.1	0.444	63	49.0	119.1	0.0	0.310	4845	2099	160m.pg153_o3_native_lto.cx7a12_gcp_c2s30
139689	0	22	0.2	10250.6	594.2	0.000	0.001	0.073	4.356	60006	64.8	0.430	70	48.8	80.9	0.0	0.235	4545	1798	160m.pg153_o3_native_lto.cx7a15_gcp_c2s30
271003	0	101	0.8	1770.8	282.7	0.000	0.003	0.007	1.068	103151	73.1	0.381	40	41.3	111.4	0.0	0.145	42454	4147	160m.pg153_o3_native_lto.cx7a16_gcp_c2s30
279427	0	13	0.1	1428.5	224.4	0.000	0.000	0.005	0.822	104169	76.3	0.373	41	41.3	111.4	0.0	0.187	42354	7891	160m.pg153_o3_native_lto.cx7a21_gcp_c2s30
267112	0	96	0.7	1697.8	275.9	0.000	0.003	0.006	1.058	101535	73.7	0.380	41	41.6	111.6	0.0	0.458	41657	4945	160m.pg153_o3_native_lto.cx7a22_gcp_c2s30
q100.1
q100.1: range queries with 100 insert/s per client
Performance metrics for all DBMS, not just the ones listed above. Some are normalized by throughput, others are not. Legend for results is here.
ips	qps	rps	rmbps	wps	wmbps	rpq	rkbpq	wpi	wkbpi	csps	cpups	cspq	cpupq	dbgb1	dbgb2	rss	maxop	p50	p99	tag
797	116476	0	0.0	1935.7	31.0	0.000	0.000	2.428	39.799	444154	53.1	3.813	68	48.8	86.6	0.0	0.015	14725	14400	160m.pg153_o3_native_lto.cx7a_gcp_c2s30
798	115997	0	0.0	1919.7	27.9	0.000	0.000	2.407	35.809	442096	53.1	3.811	69	48.5	88.5	0.0	0.008	14480	14118	160m.pg153_o3_native_lto.cx7a1_gcp_c2s30
798	118040	0	0.0	293.5	12.4	0.000	0.000	0.368	15.901	449234	52.9	3.806	67	48.8	118.8	0.0	0.008	14725	14464	160m.pg153_o3_native_lto.cx7a4_gcp_c2s30
798	116342	0	0.0	1862.0	27.9	0.000	0.000	2.335	35.800	443541	53.1	3.812	68	48.5	61.2	0.0	0.006	14544	14262	160m.pg153_o3_native_lto.cx7a7_gcp_c2s30
798	118059	0	0.0	1937.2	29.8	0.000	0.000	2.429	38.299	450056	53.1	3.812	67	48.9	82.8	0.0	0.021	14629	14336	160m.pg153_o3_native_lto.cx7a10_gcp_c2s30
797	118787	0	0.0	1988.7	30.2	0.000	0.000	2.494	38.757	452955	53.1	3.813	67	49.0	86.0	0.0	0.008	14912	14432	160m.pg153_o3_native_lto.cx7a12_gcp_c2s30
797	117862	0	0.0	1921.6	30.1	0.000	0.000	2.410	38.601	449350	53.0	3.813	67	48.8	64.7	0.0	0.009	14736	14453	160m.pg153_o3_native_lto.cx7a15_gcp_c2s30
797	118457	0	0.0	1752.4	28.3	0.000	0.000	2.198	36.350	451625	53.2	3.813	67	41.3	73.9	0.0	0.008	14880	14496	160m.pg153_o3_native_lto.cx7a16_gcp_c2s30
797	117518	0	0.0	240.5	10.1	0.000	0.000	0.302	12.999	447231	53.0	3.806	68	41.3	111.4	0.0	0.004	14816	14582	160m.pg153_o3_native_lto.cx7a21_gcp_c2s30
798	117159	0	0.0	236.4	10.8	0.000	0.000	0.296	13.910	445836	53.0	3.805	68	41.6	111.6	0.0	0.011	14720	14480	160m.pg153_o3_native_lto.cx7a22_gcp_c2s30
q500.1
q500.1: range queries with 500 insert/s per client
Performance metrics for all DBMS, not just the ones listed above. Some are normalized by throughput, others are not. Legend for results is here.
ips	qps	rps	rmbps	wps	wmbps	rpq	rkbpq	wpi	wkbpi	csps	cpups	cspq	cpupq	dbgb1	dbgb2	rss	maxop	p50	p99	tag
3988	111377	0	0.0	3106.8	71.6	0.000	0.000	0.779	18.375	422362	54.7	3.792	74	48.8	72.3	0.0	0.029	13990	13441	160m.pg153_o3_native_lto.cx7a_gcp_c2s30
3987	110379	0	0.0	3020.3	62.5	0.000	0.000	0.758	16.043	420743	54.6	3.812	74	48.5	64.6	0.0	0.020	13814	13281	160m.pg153_o3_native_lto.cx7a1_gcp_c2s30
3987	113389	0	0.0	384.1	18.2	0.000	0.000	0.096	4.685	431629	54.0	3.807	71	48.8	113.8	0.0	0.025	14112	13585	160m.pg153_o3_native_lto.cx7a4_gcp_c2s30
3988	110753	0	0.0	4680.0	91.4	0.000	0.000	1.174	23.481	423798	54.4	3.827	74	48.5	64.5	0.0	0.100	13841	13287	160m.pg153_o3_native_lto.cx7a7_gcp_c2s30
3987	112370	0	0.0	3040.5	70.6	0.000	0.000	0.763	18.121	428750	54.4	3.816	73	48.9	72.0	0.0	0.020	14016	13473	160m.pg153_o3_native_lto.cx7a10_gcp_c2s30
3987	113830	0	0.0	3082.7	71.7	0.000	0.000	0.773	18.417	435079	54.3	3.822	72	49.0	72.4	0.0	0.054	14272	13750	160m.pg153_o3_native_lto.cx7a12_gcp_c2s30
3987	112106	0	0.0	3054.0	72.3	0.000	0.000	0.766	18.563	428304	54.3	3.821	73	48.8	69.8	0.0	0.027	13942	13521	160m.pg153_o3_native_lto.cx7a15_gcp_c2s30
3988	114614	0	0.0	2439.7	70.4	0.000	0.000	0.612	18.068	437951	53.9	3.821	71	41.3	67.0	0.0	0.045	14352	12578	160m.pg153_o3_native_lto.cx7a16_gcp_c2s30
3988	114826	0	0.0	288.1	14.6	0.000	0.000	0.072	3.749	437372	53.7	3.809	70	41.3	104.1	0.0	0.053	14400	12498	160m.pg153_o3_native_lto.cx7a21_gcp_c2s30
3987	113983	0	0.0	297.2	16.4	0.000	0.000	0.075	4.207	434266	53.6	3.810	71	41.6	106.3	0.0	0.027	14241	12371	160m.pg153_o3_native_lto.cx7a22_gcp_c2s30
q1000.1
q1000.1: range queries with 1000 insert/s per client
Performance metrics for all DBMS, not just the ones listed above. Some are normalized by throughput, others are not. Legend for results is here.
ips	qps	rps	rmbps	wps	wmbps	rpq	rkbpq	wpi	wkbpi	csps	cpups	cspq	cpupq	dbgb1	dbgb2	rss	maxop	p50	p99	tag
7976	107936	0	0.0	2591.2	94.2	0.000	0.000	0.325	12.093	404741	56.5	3.750	79	48.6	77.2	0.1	0.081	13585	12263	160m.pg153_o3_native_lto.cx7a_gcp_c2s30
7976	106366	0	0.0	2554.5	81.3	0.000	0.000	0.320	10.443	400379	56.8	3.764	80	48.6	67.3	0.1	0.022	13505	12227	160m.pg153_o3_native_lto.cx7a1_gcp_c2s30
7976	108515	0	0.0	268.4	21.3	0.000	0.000	0.034	2.729	410380	56.0	3.782	77	48.7	109.1	0.1	0.083	13494	12291	160m.pg153_o3_native_lto.cx7a4_gcp_c2s30
7976	105171	0	0.0	9828.3	194.4	0.000	0.000	1.232	24.960	402022	56.5	3.823	81	48.4	64.5	0.1	1.221	13345	11783	160m.pg153_o3_native_lto.cx7a7_gcp_c2s30
7976	109517	0	0.0	2643.1	93.0	0.000	0.000	0.331	11.938	413363	56.1	3.774	77	48.9	77.7	0.1	0.043	13537	12359	160m.pg153_o3_native_lto.cx7a10_gcp_c2s30
7978	109404	0	0.0	2608.1	94.5	0.000	0.000	0.327	12.124	415287	56.1	3.796	77	48.9	77.6	0.1	0.082	13750	12679	160m.pg153_o3_native_lto.cx7a12_gcp_c2s30
7976	108261	0	0.0	2442.8	96.3	0.000	0.000	0.306	12.363	409177	55.9	3.780	77	48.8	77.6	0.1	0.103	13745	12450	160m.pg153_o3_native_lto.cx7a15_gcp_c2s30
7976	112476	0	0.0	2095.5	87.5	0.000	0.000	0.263	11.233	427460	55.0	3.800	73	41.4	69.9	0.0	0.033	14193	12291	160m.pg153_o3_native_lto.cx7a16_gcp_c2s30
7976	112689	0	0.0	177.9	17.0	0.000	0.000	0.022	2.178	427833	54.6	3.797	73	41.3	97.5	0.0	0.047	14176	12211	160m.pg153_o3_native_lto.cx7a21_gcp_c2s30
7978	111897	0	0.0	191.9	19.0	0.000	0.000	0.024	2.438	425311	54.5	3.801	73	41.6	101.5	0.0	0.052	14150	12083	160m.pg153_o3_native_lto.cx7a22_gcp_c2s30
l.i0
- l.i0: load without secondary indexes
- Legend for results is here.
- Each entry lists the percentage of responses that fit in that bucket (slower than max time for previous bucket, faster than min time for next bucket).
Insert response time histogram
256us	1ms	4ms	16ms	64ms	256ms	1s	4s	16s	gt	max	tag
0.000	97.388	2.555	0.037	0.007	0.010	0.002	0.000	0.000	0.000	0.459	pg153_o3_native_lto.cx7a_gcp_c2s30
0.000	97.496	2.440	0.043	0.008	0.010	0.003	0.000	0.000	0.000	0.495	pg153_o3_native_lto.cx7a1_gcp_c2s30
0.000	97.404	2.537	0.039	0.007	0.012	0.001	0.000	0.000	0.000	0.487	pg153_o3_native_lto.cx7a4_gcp_c2s30
0.000	97.406	2.518	0.059	0.009	0.007	0.002	0.000	0.000	0.000	0.379	pg153_o3_native_lto.cx7a7_gcp_c2s30
0.000	97.720	2.221	0.039	0.006	0.011	0.002	0.000	0.000	0.000	0.940	pg153_o3_native_lto.cx7a10_gcp_c2s30
0.000	97.940	2.016	0.039	0.002	0.002	0.000	0.000	0.000	0.000	0.185	pg153_o3_native_lto.cx7a12_gcp_c2s30
0.000	97.478	2.377	0.111	0.021	0.011	0.001	0.000	0.000	0.000	0.667	pg153_o3_native_lto.cx7a15_gcp_c2s30
0.000	97.695	2.244	0.043	0.007	0.011	0.001	0.000	0.000	0.000	0.741	pg153_o3_native_lto.cx7a16_gcp_c2s30
0.000	97.437	2.506	0.042	0.005	0.008	0.002	0.000	0.000	0.000	0.586	pg153_o3_native_lto.cx7a21_gcp_c2s30
0.000	97.534	2.410	0.043	0.005	0.006	0.002	0.000	0.000	0.000	0.702	pg153_o3_native_lto.cx7a22_gcp_c2s30
l.x
- l.x: create secondary indexes
- Legend for results is here.
- Each entry lists the percentage of responses that fit in that bucket (slower than max time for previous bucket, faster than min time for next bucket).
TODO - determine whether there is data for create index response time
l.i1
- l.i1: continue load after secondary indexes created
- Legend for results is here.
- Each entry lists the percentage of responses that fit in that bucket (slower than max time for previous bucket, faster than min time for next bucket).
Insert response time histogram
256us	1ms	4ms	16ms	64ms	256ms	1s	4s	16s	gt	max	tag
0.000	1.742	97.930	0.265	0.062	0.001	nonzero	0.000	0.000	0.000	0.280	pg153_o3_native_lto.cx7a_gcp_c2s30
0.000	3.553	96.372	0.062	0.012	0.001	nonzero	0.000	0.000	0.000	0.313	pg153_o3_native_lto.cx7a1_gcp_c2s30
0.000	4.377	95.244	0.309	0.070	0.001	nonzero	0.000	0.000	0.000	0.272	pg153_o3_native_lto.cx7a4_gcp_c2s30
0.000	0.810	96.149	1.946	1.090	0.006	nonzero	0.000	0.000	0.000	0.289	pg153_o3_native_lto.cx7a7_gcp_c2s30
0.000	50.878	48.840	0.231	0.051	0.001	nonzero	0.000	0.000	0.000	0.672	pg153_o3_native_lto.cx7a10_gcp_c2s30
0.000	50.264	49.572	0.108	0.053	0.002	nonzero	0.000	0.000	0.000	0.310	pg153_o3_native_lto.cx7a12_gcp_c2s30
0.000	36.244	62.401	1.129	0.226	0.002	0.000	0.000	0.000	0.000	0.235	pg153_o3_native_lto.cx7a15_gcp_c2s30
0.000	37.748	61.376	0.698	0.177	0.001	0.000	0.000	0.000	0.000	0.145	pg153_o3_native_lto.cx7a16_gcp_c2s30
0.000	35.103	64.510	0.339	0.048	nonzero	0.000	0.000	0.000	0.000	0.187	pg153_o3_native_lto.cx7a21_gcp_c2s30
0.000	32.723	66.403	0.697	0.176	nonzero	nonzero	0.000	0.000	0.000	0.458	pg153_o3_native_lto.cx7a22_gcp_c2s30
Delete response time histogram
256us	1ms	4ms	16ms	64ms	256ms	1s	4s	16s	gt	max	tag
83.678	2.417	2.165	6.631	5.108	0.001	0.000	0.000	0.000	0.000	0.217	pg153_o3_native_lto.cx7a_gcp_c2s30
83.128	2.967	2.035	7.228	4.642	0.001	0.000	0.000	0.000	0.000	0.253	pg153_o3_native_lto.cx7a1_gcp_c2s30
83.578	2.502	2.163	6.811	4.946	0.001	nonzero	0.000	0.000	0.000	0.274	pg153_o3_native_lto.cx7a4_gcp_c2s30
80.806	3.264	1.853	7.534	6.521	0.022	nonzero	0.000	0.000	0.000	0.267	pg153_o3_native_lto.cx7a7_gcp_c2s30
83.360	3.040	2.530	7.082	3.987	0.001	nonzero	0.000	0.000	0.000	0.679	pg153_o3_native_lto.cx7a10_gcp_c2s30
83.658	2.992	2.181	7.310	3.853	0.006	nonzero	0.000	0.000	0.000	0.318	pg153_o3_native_lto.cx7a12_gcp_c2s30
81.336	4.293	2.110	7.726	4.531	0.003	0.000	0.000	0.000	0.000	0.233	pg153_o3_native_lto.cx7a15_gcp_c2s30
77.957	8.996	10.550	2.403	0.094	nonzero	0.000	0.000	0.000	0.000	0.144	pg153_o3_native_lto.cx7a16_gcp_c2s30
76.980	9.905	11.409	1.685	0.021	nonzero	0.000	0.000	0.000	0.000	0.189	pg153_o3_native_lto.cx7a21_gcp_c2s30
77.848	9.021	10.874	2.166	0.091	nonzero	nonzero	0.000	0.000	0.000	0.458	pg153_o3_native_lto.cx7a22_gcp_c2s30
q100.1
- q100.1: range queries with 100 insert/s per client
- Legend for results is here.
- Each entry lists the percentage of responses that fit in that bucket (slower than max time for previous bucket, faster than min time for next bucket).
Query response time histogram
256us	1ms	4ms	16ms	64ms	256ms	1s	4s	16s	gt	max	tag
99.995	0.004	0.001	nonzero	0.000	0.000	0.000	0.000	0.000	0.000	0.015	pg153_o3_native_lto.cx7a_gcp_c2s30
99.995	0.004	0.001	nonzero	0.000	0.000	0.000	0.000	0.000	0.000	0.008	pg153_o3_native_lto.cx7a1_gcp_c2s30
99.996	0.003	0.001	nonzero	0.000	0.000	0.000	0.000	0.000	0.000	0.008	pg153_o3_native_lto.cx7a4_gcp_c2s30
99.995	0.004	0.001	nonzero	0.000	0.000	0.000	0.000	0.000	0.000	0.006	pg153_o3_native_lto.cx7a7_gcp_c2s30
99.995	0.004	0.001	nonzero	nonzero	0.000	0.000	0.000	0.000	0.000	0.021	pg153_o3_native_lto.cx7a10_gcp_c2s30
99.995	0.004	0.001	nonzero	0.000	0.000	0.000	0.000	0.000	0.000	0.008	pg153_o3_native_lto.cx7a12_gcp_c2s30
99.995	0.004	0.001	nonzero	0.000	0.000	0.000	0.000	0.000	0.000	0.009	pg153_o3_native_lto.cx7a15_gcp_c2s30
99.995	0.004	0.001	nonzero	0.000	0.000	0.000	0.000	0.000	0.000	0.008	pg153_o3_native_lto.cx7a16_gcp_c2s30
99.996	0.003	0.001	nonzero	0.000	0.000	0.000	0.000	0.000	0.000	0.004	pg153_o3_native_lto.cx7a21_gcp_c2s30
99.996	0.003	0.001	nonzero	0.000	0.000	0.000	0.000	0.000	0.000	0.011	pg153_o3_native_lto.cx7a22_gcp_c2s30
Insert response time histogram
256us	1ms	4ms	16ms	64ms	256ms	1s	4s	16s	gt	max	tag
0.000	0.005	99.991	0.003	0.000	0.000	0.000	0.000	0.000	0.000	0.012	pg153_o3_native_lto.cx7a_gcp_c2s30
0.000	0.002	99.677	0.321	0.000	0.000	0.000	0.000	0.000	0.000	0.011	pg153_o3_native_lto.cx7a1_gcp_c2s30
0.000	0.205	99.793	0.002	0.000	0.000	0.000	0.000	0.000	0.000	0.013	pg153_o3_native_lto.cx7a4_gcp_c2s30
0.000	0.000	99.988	0.012	0.000	0.000	0.000	0.000	0.000	0.000	0.013	pg153_o3_native_lto.cx7a7_gcp_c2s30
0.000	0.137	99.859	0.003	0.000	0.000	0.000	0.000	0.000	0.000	0.015	pg153_o3_native_lto.cx7a10_gcp_c2s30
0.000	0.368	99.632	0.000	0.000	0.000	0.000	0.000	0.000	0.000	0.004	pg153_o3_native_lto.cx7a12_gcp_c2s30
0.000	0.000	99.997	0.003	0.000	0.000	0.000	0.000	0.000	0.000	0.008	pg153_o3_native_lto.cx7a15_gcp_c2s30
0.000	0.785	99.214	0.002	0.000	0.000	0.000	0.000	0.000	0.000	0.009	pg153_o3_native_lto.cx7a16_gcp_c2s30
0.000	8.606	91.276	0.118	0.000	0.000	0.000	0.000	0.000	0.000	0.005	pg153_o3_native_lto.cx7a21_gcp_c2s30
0.000	9.299	90.700	0.002	0.000	0.000	0.000	0.000	0.000	0.000	0.011	pg153_o3_native_lto.cx7a22_gcp_c2s30
Delete response time histogram
256us	1ms	4ms	16ms	64ms	256ms	1s	4s	16s	gt	max	tag
50.700	29.349	19.950	0.002	0.000	0.000	0.000	0.000	0.000	0.000	0.009	pg153_o3_native_lto.cx7a_gcp_c2s30
58.682	19.151	22.135	0.031	0.000	0.000	0.000	0.000	0.000	0.000	0.012	pg153_o3_native_lto.cx7a1_gcp_c2s30
65.351	14.233	20.411	0.005	0.000	0.000	0.000	0.000	0.000	0.000	0.011	pg153_o3_native_lto.cx7a4_gcp_c2s30
59.476	19.351	21.161	0.012	0.000	0.000	0.000	0.000	0.000	0.000	0.006	pg153_o3_native_lto.cx7a7_gcp_c2s30
61.530	27.865	10.602	0.002	0.002	0.000	0.000	0.000	0.000	0.000	0.016	pg153_o3_native_lto.cx7a10_gcp_c2s30
62.814	16.130	20.849	0.207	0.000	0.000	0.000	0.000	0.000	0.000	0.012	pg153_o3_native_lto.cx7a12_gcp_c2s30
62.724	24.929	12.345	0.002	0.000	0.000	0.000	0.000	0.000	0.000	0.011	pg153_o3_native_lto.cx7a15_gcp_c2s30
56.481	34.075	9.439	0.005	0.000	0.000	0.000	0.000	0.000	0.000	0.014	pg153_o3_native_lto.cx7a16_gcp_c2s30
59.547	25.849	14.556	0.049	0.000	0.000	0.000	0.000	0.000	0.000	0.005	pg153_o3_native_lto.cx7a21_gcp_c2s30
63.491	26.333	10.175	0.000	0.000	0.000	0.000	0.000	0.000	0.000	0.004	pg153_o3_native_lto.cx7a22_gcp_c2s30
q500.1
- q500.1: range queries with 500 insert/s per client
- Legend for results is here.
- Each entry lists the percentage of responses that fit in that bucket (slower than max time for previous bucket, faster than min time for next bucket).
Query response time histogram
256us	1ms	4ms	16ms	64ms	256ms	1s	4s	16s	gt	max	tag
99.976	0.015	0.008	0.001	nonzero	0.000	0.000	0.000	0.000	0.000	0.029	pg153_o3_native_lto.cx7a_gcp_c2s30
99.977	0.017	0.006	nonzero	nonzero	0.000	0.000	0.000	0.000	0.000	0.020	pg153_o3_native_lto.cx7a1_gcp_c2s30
99.984	0.009	0.006	nonzero	nonzero	0.000	0.000	0.000	0.000	0.000	0.025	pg153_o3_native_lto.cx7a4_gcp_c2s30
99.972	0.019	0.009	0.001	nonzero	nonzero	0.000	0.000	0.000	0.000	0.100	pg153_o3_native_lto.cx7a7_gcp_c2s30
99.977	0.015	0.008	nonzero	nonzero	0.000	0.000	0.000	0.000	0.000	0.020	pg153_o3_native_lto.cx7a10_gcp_c2s30
99.977	0.014	0.008	nonzero	nonzero	0.000	0.000	0.000	0.000	0.000	0.054	pg153_o3_native_lto.cx7a12_gcp_c2s30
99.976	0.016	0.008	nonzero	nonzero	0.000	0.000	0.000	0.000	0.000	0.027	pg153_o3_native_lto.cx7a15_gcp_c2s30
99.977	0.014	0.008	0.001	nonzero	0.000	0.000	0.000	0.000	0.000	0.045	pg153_o3_native_lto.cx7a16_gcp_c2s30
99.988	0.008	0.004	nonzero	nonzero	0.000	0.000	0.000	0.000	0.000	0.053	pg153_o3_native_lto.cx7a21_gcp_c2s30
99.984	0.009	0.006	nonzero	nonzero	0.000	0.000	0.000	0.000	0.000	0.027	pg153_o3_native_lto.cx7a22_gcp_c2s30
Insert response time histogram
256us	1ms	4ms	16ms	64ms	256ms	1s	4s	16s	gt	max	tag
0.000	0.001	98.993	0.970	0.035	0.000	0.000	0.000	0.000	0.000	0.031	pg153_o3_native_lto.cx7a_gcp_c2s30
0.000	0.000	99.319	0.670	0.011	0.000	0.000	0.000	0.000	0.000	0.035	pg153_o3_native_lto.cx7a1_gcp_c2s30
0.000	5.046	94.898	0.056	0.001	0.000	0.000	0.000	0.000	0.000	0.016	pg153_o3_native_lto.cx7a4_gcp_c2s30
0.000	0.290	99.147	0.478	0.084	0.000	0.000	0.000	0.000	0.000	0.044	pg153_o3_native_lto.cx7a7_gcp_c2s30
0.000	5.194	94.351	0.447	0.008	0.000	0.000	0.000	0.000	0.000	0.024	pg153_o3_native_lto.cx7a10_gcp_c2s30
0.000	4.152	95.775	0.072	0.001	0.000	0.000	0.000	0.000	0.000	0.020	pg153_o3_native_lto.cx7a12_gcp_c2s30
0.000	3.940	95.760	0.288	0.012	0.000	0.000	0.000	0.000	0.000	0.025	pg153_o3_native_lto.cx7a15_gcp_c2s30
0.000	10.657	88.224	1.102	0.017	0.000	0.000	0.000	0.000	0.000	0.033	pg153_o3_native_lto.cx7a16_gcp_c2s30
0.000	47.111	52.824	0.065	nonzero	0.000	0.000	0.000	0.000	0.000	0.017	pg153_o3_native_lto.cx7a21_gcp_c2s30
0.000	50.998	48.894	0.105	0.003	0.000	0.000	0.000	0.000	0.000	0.028	pg153_o3_native_lto.cx7a22_gcp_c2s30
Delete response time histogram
256us	1ms	4ms	16ms	64ms	256ms	1s	4s	16s	gt	max	tag
77.168	1.455	1.811	19.084	0.482	0.000	0.000	0.000	0.000	0.000	0.046	pg153_o3_native_lto.cx7a_gcp_c2s30
78.661	2.671	2.428	16.218	0.022	0.000	0.000	0.000	0.000	0.000	0.031	pg153_o3_native_lto.cx7a1_gcp_c2s30
79.250	1.339	4.105	15.230	0.076	0.000	0.000	0.000	0.000	0.000	0.033	pg153_o3_native_lto.cx7a4_gcp_c2s30
80.732	1.723	3.311	14.208	0.026	0.000	0.000	0.000	0.000	0.000	0.042	pg153_o3_native_lto.cx7a7_gcp_c2s30
77.542	1.203	4.002	17.228	0.024	0.000	0.000	0.000	0.000	0.000	0.031	pg153_o3_native_lto.cx7a10_gcp_c2s30
79.493	2.157	3.972	14.371	0.007	0.000	0.000	0.000	0.000	0.000	0.027	pg153_o3_native_lto.cx7a12_gcp_c2s30
78.761	1.375	4.188	15.655	0.020	0.000	0.000	0.000	0.000	0.000	0.033	pg153_o3_native_lto.cx7a15_gcp_c2s30
77.719	12.368	6.163	3.742	0.008	0.000	0.000	0.000	0.000	0.000	0.020	pg153_o3_native_lto.cx7a16_gcp_c2s30
77.995	8.564	11.536	1.905	0.000	0.000	0.000	0.000	0.000	0.000	0.012	pg153_o3_native_lto.cx7a21_gcp_c2s30
78.286	7.973	10.773	2.967	0.001	0.000	0.000	0.000	0.000	0.000	0.021	pg153_o3_native_lto.cx7a22_gcp_c2s30
q1000.1
- q1000.1: range queries with 1000 insert/s per client
- Legend for results is here.
- Each entry lists the percentage of responses that fit in that bucket (slower than max time for previous bucket, faster than min time for next bucket).
Query response time histogram
256us	1ms	4ms	16ms	64ms	256ms	1s	4s	16s	gt	max	tag
99.940	0.042	0.016	0.003	nonzero	nonzero	0.000	0.000	0.000	0.000	0.081	pg153_o3_native_lto.cx7a_gcp_c2s30
99.942	0.046	0.011	0.001	nonzero	0.000	0.000	0.000	0.000	0.000	0.022	pg153_o3_native_lto.cx7a1_gcp_c2s30
99.952	0.034	0.014	0.001	nonzero	nonzero	0.000	0.000	0.000	0.000	0.083	pg153_o3_native_lto.cx7a4_gcp_c2s30
99.904	0.066	0.023	0.006	nonzero	nonzero	0.000	nonzero	0.000	0.000	1.221	pg153_o3_native_lto.cx7a7_gcp_c2s30
99.940	0.040	0.016	0.003	nonzero	0.000	0.000	0.000	0.000	0.000	0.043	pg153_o3_native_lto.cx7a10_gcp_c2s30
99.942	0.042	0.015	0.001	nonzero	nonzero	0.000	0.000	0.000	0.000	0.082	pg153_o3_native_lto.cx7a12_gcp_c2s30
99.932	0.045	0.018	0.005	nonzero	nonzero	0.000	0.000	0.000	0.000	0.103	pg153_o3_native_lto.cx7a15_gcp_c2s30
99.948	0.036	0.014	0.002	nonzero	0.000	0.000	0.000	0.000	0.000	0.033	pg153_o3_native_lto.cx7a16_gcp_c2s30
99.960	0.030	0.010	nonzero	nonzero	0.000	0.000	0.000	0.000	0.000	0.047	pg153_o3_native_lto.cx7a21_gcp_c2s30
99.963	0.027	0.010	nonzero	nonzero	0.000	0.000	0.000	0.000	0.000	0.052	pg153_o3_native_lto.cx7a22_gcp_c2s30
Insert response time histogram
256us	1ms	4ms	16ms	64ms	256ms	1s	4s	16s	gt	max	tag
0.000	0.196	97.018	2.608	0.178	0.000	0.000	0.000	0.000	0.000	0.049	pg153_o3_native_lto.cx7a_gcp_c2s30
0.000	0.003	98.985	0.985	0.027	0.000	0.000	0.000	0.000	0.000	0.025	pg153_o3_native_lto.cx7a1_gcp_c2s30
0.000	3.076	95.895	0.921	0.107	0.000	0.000	0.000	0.000	0.000	0.060	pg153_o3_native_lto.cx7a4_gcp_c2s30
0.000	0.493	95.872	3.289	0.342	0.003	0.001	0.001	0.000	0.000	1.225	pg153_o3_native_lto.cx7a7_gcp_c2s30
0.000	17.524	79.896	2.428	0.152	0.000	0.000	0.000	0.000	0.000	0.047	pg153_o3_native_lto.cx7a10_gcp_c2s30
0.000	16.033	83.493	0.461	0.014	0.000	0.000	0.000	0.000	0.000	0.059	pg153_o3_native_lto.cx7a12_gcp_c2s30
0.000	15.704	80.619	3.165	0.511	0.001	0.000	0.000	0.000	0.000	0.163	pg153_o3_native_lto.cx7a15_gcp_c2s30
0.000	32.052	65.428	2.387	0.133	0.000	0.000	0.000	0.000	0.000	0.054	pg153_o3_native_lto.cx7a16_gcp_c2s30
0.000	59.522	40.113	0.355	0.010	0.000	0.000	0.000	0.000	0.000	0.030	pg153_o3_native_lto.cx7a21_gcp_c2s30
0.000	63.156	36.458	0.371	0.015	0.000	0.000	0.000	0.000	0.000	0.027	pg153_o3_native_lto.cx7a22_gcp_c2s30
Delete response time histogram
256us	1ms	4ms	16ms	64ms	256ms	1s	4s	16s	gt	max	tag
78.385	2.577	1.654	11.556	5.828	0.000	0.000	0.000	0.000	0.000	0.057	pg153_o3_native_lto.cx7a_gcp_c2s30
76.201	4.903	3.019	10.544	5.333	0.000	0.000	0.000	0.000	0.000	0.042	pg153_o3_native_lto.cx7a1_gcp_c2s30
76.596	3.787	3.514	11.213	4.891	0.000	0.000	0.000	0.000	0.000	0.062	pg153_o3_native_lto.cx7a4_gcp_c2s30
75.976	4.251	2.160	13.040	4.570	0.001	0.001	0.001	0.000	0.000	1.234	pg153_o3_native_lto.cx7a7_gcp_c2s30
77.193	3.239	2.838	13.660	3.070	0.000	0.000	0.000	0.000	0.000	0.041	pg153_o3_native_lto.cx7a10_gcp_c2s30
77.794	3.473	2.820	12.302	3.610	0.000	0.000	0.000	0.000	0.000	0.058	pg153_o3_native_lto.cx7a12_gcp_c2s30
76.037	4.329	2.855	13.344	3.435	nonzero	0.000	0.000	0.000	0.000	0.102	pg153_o3_native_lto.cx7a15_gcp_c2s30
79.963	3.918	6.501	9.547	0.071	0.000	0.000	0.000	0.000	0.000	0.041	pg153_o3_native_lto.cx7a16_gcp_c2s30
78.222	7.030	9.877	4.867	0.004	0.000	0.000	0.000	0.000	0.000	0.026	pg153_o3_native_lto.cx7a21_gcp_c2s30
78.666	8.567	6.686	6.074	0.007	0.000	0.000	0.000	0.000	0.000	0.024	pg153_o3_native_lto.cx7a22_gcp_c2s30