Introduction
This is a report for the insert benchmark with 480M docs and 24 client(s). It is generated by scripts (bash, awk, sed) and Tufte might not be impressed. An overview of the insert benchmark is here and a short update is here. Below, by DBMS, I mean DBMS+version.config. An example is my8020.c10b40 where my means MySQL, 8020 is version 8.0.20 and c10b40 is the name for the configuration file.
The test server has 80 cores with hyperthreads enabled, 256G RAM and fast SSD. The benchmark was run with 8 client and there were 1 or 3 connections per client (1 for queries or inserts without rate limits, 1+1 for rate limited inserts+deletes). There are 24 tables, client per table. It loads 20M rows per-table without secondary indexes, creates secondary indexes, then inserts 5M rows per-table with a delete per insert to avoid growing the table. The read+write tests were skipped. The database is cached the OS but not by InnoDB.
The tested DBMS are:
- my8033_rel_native_lto.cy10_4g_u - InnoDB and MySQL 8.0.33, rel_native_lto build, cy10a_4g_u config, compiled with CMAKE_BUILD_TYPE=Release -flto -march=native -mtune=native
- my8033_rel_native_lto.cy10_4g_ua7 - InnoDB and MySQL 8.0.33, rel_native_lto build, cy10a_4g_ua7 config, compiled with CMAKE_BUILD_TYPE=Release -flto -march=native -mtune=native, adds innodb_lru_scan_depth=2048
- my8033_rel_native_lto.cy10_4g_ua8 - InnoDB and MySQL 8.0.33, rel_native_lto build, cy10a_4g_ua8 config, compiled with CMAKE_BUILD_TYPE=Release -flto -march=native -mtune=native, adds innodb_lru_scan_depth=4096
- my8033_rel_native_lto.cy10_4g_ua9 - InnoDB and MySQL 8.0.33, rel_native_lto build, cy10a_4g_ua9 config, compiled with CMAKE_BUILD_TYPE=Release -flto -march=native -mtune=native, adds innodb_lru_scan_depth=8192
- my8033_rel_native_lto.cy10_4g_ua10 - InnoDB and MySQL 8.0.33, rel_native_lto build, cy10a_4g_ua10 config, compiled with CMAKE_BUILD_TYPE=Release -flto -march=native -mtune=native, adds innodb_page_cleaners=8
- my8033_rel_native_lto.cy10_4g_ua17 - InnoDB and MySQL 8.0.33, rel_native_lto build, cy10a_4g_ua17 config, compiled with CMAKE_BUILD_TYPE=Release -flto -march=native -mtune=native, adds innodb_doublewrite=OFF
- my8033_rel_native_lto.cy10_4g_ua18 - InnoDB and MySQL 8.0.33, rel_native_lto build, cy10a_4g_ua18 config, compiled with CMAKE_BUILD_TYPE=Release -flto -march=native -mtune=native, adds innodb_buffer_pool_instances, innodb_page_cleaners, innodb_purge_threads =4
- my8033_rel_native_lto.cy10_4g_ua19 - InnoDB and MySQL 8.0.33, rel_native_lto build, cy10a_4g_ua19 config, compiled with CMAKE_BUILD_TYPE=Release -flto -march=native -mtune=native, adds innodb_max_dirty_pages_pct_lwm=20, innodb_max_dirty_pages_pct=50
Contents
- Summary
- l.i0: load without secondary indexes
- l.x: create secondary indexes
- l.i1: continue load after secondary indexes created
- q100.1: range queries with 100 insert/s per client
- q500.1: range queries with 500 insert/s per client
- q1000.1: range queries with 1000 insert/s per client
Summary
The numbers are inserts/s for l.i0 and l.i1, indexed docs (or rows) /s for l.x and queries/s for q*.2. The values are the average rate over the entire test for inserts (IPS) and queries (QPS). The range of values for IPS and QPS is split into 3 parts: bottom 25%, middle 50%, top 25%. Values in the bottom 25% have a red background, values in the top 25% have a green background and values in the middle have no color. A gray background is used for values that can be ignored because the DBMS did not sustain the target insert rate. Red backgrounds are not used when the minimum value is within 80% of the max value.
| dbms | l.i0 | l.x | l.i1 | q100.1 | q500.1 | q1000.1 |
|---|---|---|---|---|---|---|
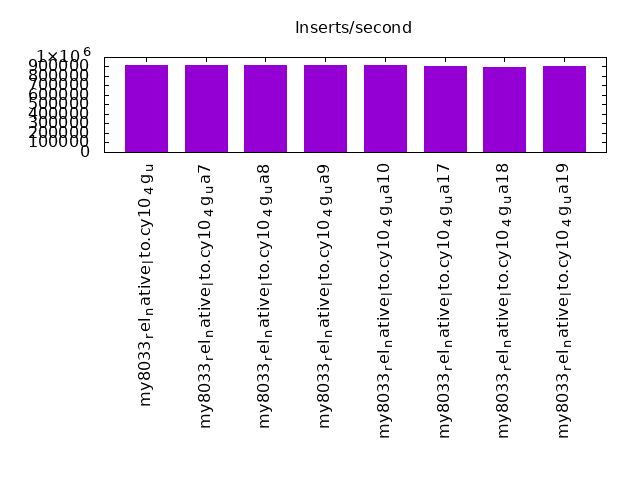
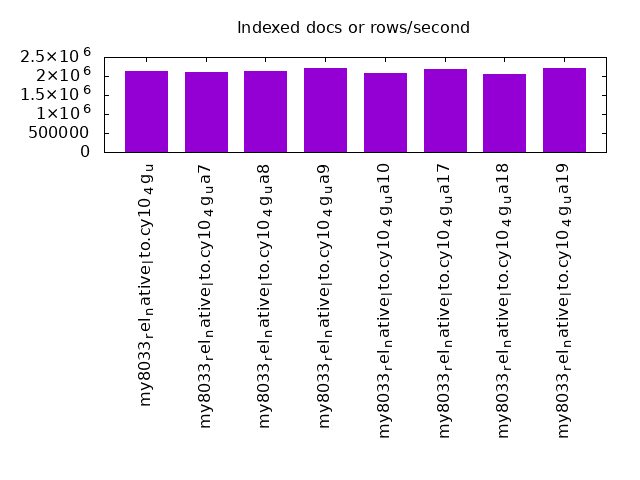
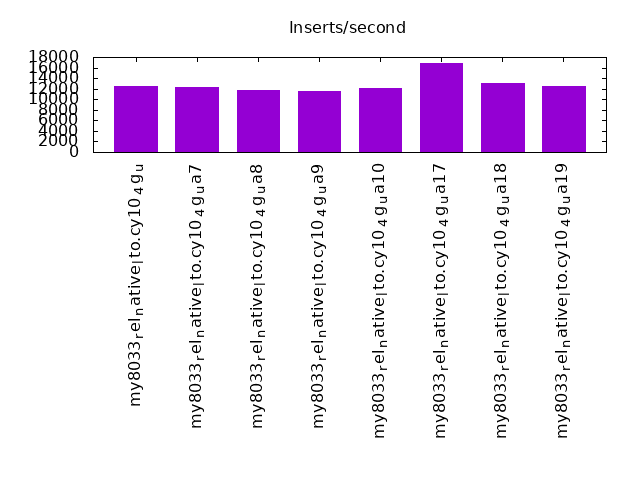
| my8033_rel_native_lto.cy10_4g_u | 910816 | 2133778 | 12535 | |||
| my8033_rel_native_lto.cy10_4g_ua7 | 917782 | 2096506 | 12244 | |||
| my8033_rel_native_lto.cy10_4g_ua8 | 916030 | 2143304 | 11839 | |||
| my8033_rel_native_lto.cy10_4g_ua9 | 916030 | 2212442 | 11621 | |||
| my8033_rel_native_lto.cy10_4g_ua10 | 912548 | 2087391 | 12208 | |||
| my8033_rel_native_lto.cy10_4g_ua17 | 900563 | 2192237 | 16952 | |||
| my8033_rel_native_lto.cy10_4g_ua18 | 892193 | 2051709 | 13159 | |||
| my8033_rel_native_lto.cy10_4g_ua19 | 902256 | 2222685 | 12440 |
This table has relative throughput, throughput for the DBMS relative to the DBMS in the first line, using the absolute throughput from the previous table. Values less than 0.95 have a yellow background. Values greater than 1.05 have a blue background.
| dbms | l.i0 | l.x | l.i1 | q100.1 | q500.1 | q1000.1 |
|---|---|---|---|---|---|---|
| my8033_rel_native_lto.cy10_4g_u | 1.00 | 1.00 | 1.00 | 1.00 | 1.00 | 1.00 |
| my8033_rel_native_lto.cy10_4g_ua7 | 1.01 | 0.98 | 0.98 | |||
| my8033_rel_native_lto.cy10_4g_ua8 | 1.01 | 1.00 | 0.94 | |||
| my8033_rel_native_lto.cy10_4g_ua9 | 1.01 | 1.04 | 0.93 | |||
| my8033_rel_native_lto.cy10_4g_ua10 | 1.00 | 0.98 | 0.97 | |||
| my8033_rel_native_lto.cy10_4g_ua17 | 0.99 | 1.03 | 1.35 | |||
| my8033_rel_native_lto.cy10_4g_ua18 | 0.98 | 0.96 | 1.05 | |||
| my8033_rel_native_lto.cy10_4g_ua19 | 0.99 | 1.04 | 0.99 |
This lists the average rate of inserts/s for the tests that do inserts concurrent with queries. For such tests the query rate is listed in the table above. The read+write tests are setup so that the insert rate should match the target rate every second. Cells that are not at least 95% of the target have a red background to indicate a failure to satisfy the target.
| dbms | q100.1 | q500.1 | q1000.1 |
|---|---|---|---|
| my8033_rel_native_lto.cy10_4g_u | |||
| my8033_rel_native_lto.cy10_4g_ua7 | |||
| my8033_rel_native_lto.cy10_4g_ua8 | |||
| my8033_rel_native_lto.cy10_4g_ua9 | |||
| my8033_rel_native_lto.cy10_4g_ua10 | |||
| my8033_rel_native_lto.cy10_4g_ua17 | |||
| my8033_rel_native_lto.cy10_4g_ua18 | |||
| my8033_rel_native_lto.cy10_4g_ua19 | |||
| target | 2400 | 12000 | 24000 |
l.i0
l.i0: load without secondary indexes. Graphs for performance per 1-second interval are here.
Average throughput:
Insert response time histogram: each cell has the percentage of responses that take <= the time in the header and max is the max response time in seconds. For the max column values in the top 25% of the range have a red background and in the bottom 25% of the range have a green background. The red background is not used when the min value is within 80% of the max value.
| dbms | 256us | 1ms | 4ms | 16ms | 64ms | 256ms | 1s | 4s | 16s | gt | max |
|---|---|---|---|---|---|---|---|---|---|---|---|
| my8033_rel_native_lto.cy10_4g_u | 99.779 | 0.174 | 0.004 | 0.043 | 0.114 | ||||||
| my8033_rel_native_lto.cy10_4g_ua7 | 99.779 | 0.175 | 0.003 | 0.043 | 0.124 | ||||||
| my8033_rel_native_lto.cy10_4g_ua8 | 99.778 | 0.177 | 0.002 | 0.043 | 0.124 | ||||||
| my8033_rel_native_lto.cy10_4g_ua9 | 99.757 | 0.196 | 0.005 | 0.043 | 0.116 | ||||||
| my8033_rel_native_lto.cy10_4g_ua10 | 99.770 | 0.184 | 0.003 | 0.043 | 0.117 | ||||||
| my8033_rel_native_lto.cy10_4g_ua17 | 99.779 | 0.177 | 0.001 | 0.043 | 0.114 | ||||||
| my8033_rel_native_lto.cy10_4g_ua18 | 99.767 | 0.186 | 0.004 | 0.043 | 0.113 | ||||||
| my8033_rel_native_lto.cy10_4g_ua19 | 99.774 | 0.180 | 0.003 | 0.043 | 0.116 |
Performance metrics for the DBMS listed above. Some are normalized by throughput, others are not. Legend for results is here.
ips	qps	rps	rmbps	wps	wmbps	rpq	rkbpq	wpi	wkbpi	csps	cpups	cspq	cpupq	dbgb1	dbgb2	rss	maxop	p50	p99	tag
910816	0	0	0.0	3598.0	240.5	0.000	0.000	0.004	0.270	230820	49.9	0.253	44	31.7	160.3	4.8	0.114	40060	33966	480m.my8033_rel_native_lto.cy10_4g_u
917782	0	0	0.0	3622.6	242.0	0.000	0.000	0.004	0.270	230253	49.8	0.251	43	31.7	160.3	4.6	0.124	40060	33766	480m.my8033_rel_native_lto.cy10_4g_ua7
916030	0	0	0.0	3592.5	241.5	0.000	0.000	0.004	0.270	230854	49.4	0.252	43	31.7	160.3	4.4	0.124	39860	33766	480m.my8033_rel_native_lto.cy10_4g_ua8
916030	0	0	0.0	3548.2	242.0	0.000	0.000	0.004	0.271	234047	49.9	0.256	44	31.7	160.3	3.9	0.116	40355	34366	480m.my8033_rel_native_lto.cy10_4g_ua9
912548	0	0	0.0	3577.6	241.1	0.000	0.000	0.004	0.271	239392	49.5	0.262	43	31.7	160.3	4.8	0.117	40160	34266	480m.my8033_rel_native_lto.cy10_4g_ua10
900563	0	0	0.0	2331.8	189.4	0.000	0.000	0.003	0.215	216687	50.8	0.241	45	31.7	160.3	4.7	0.114	39361	34074	480m.my8033_rel_native_lto.cy10_4g_ua17
892193	0	0	0.0	3919.0	240.2	0.000	0.000	0.004	0.276	231224	50.6	0.259	45	31.7	160.3	4.8	0.113	39560	33766	480m.my8033_rel_native_lto.cy10_4g_ua18
902256	0	0	0.0	3695.6	244.7	0.000	0.000	0.004	0.278	233372	51.4	0.259	46	31.7	160.3	4.7	0.116	39660	34266	480m.my8033_rel_native_lto.cy10_4g_ua19
l.x
l.x: create secondary indexes.
Average throughput:
Performance metrics for the DBMS listed above. Some are normalized by throughput, others are not. Legend for results is here.
ips	qps	rps	rmbps	wps	wmbps	rpq	rkbpq	wpi	wkbpi	csps	cpups	cspq	cpupq	dbgb1	dbgb2	rss	maxop	p50	p99	tag
2133778	0	11422	554.1	37390.0	1552.6	0.005	0.266	0.018	0.745	220122	77.9	0.103	29	70.6	199.2	4.9	0.007	NA	NA	480m.my8033_rel_native_lto.cy10_4g_u
2096506	0	11174	542.0	36633.4	1517.8	0.005	0.265	0.017	0.741	218695	76.7	0.104	29	70.6	199.2	4.9	0.007	NA	NA	480m.my8033_rel_native_lto.cy10_4g_ua7
2143304	0	11426	554.2	36808.7	1550.3	0.005	0.265	0.017	0.741	223137	78.4	0.104	29	70.6	199.2	4.9	0.008	NA	NA	480m.my8033_rel_native_lto.cy10_4g_ua8
2212442	0	11955	579.9	39194.6	1619.7	0.005	0.268	0.018	0.750	236912	78.5	0.107	28	70.6	199.2	4.9	0.006	NA	NA	480m.my8033_rel_native_lto.cy10_4g_ua9
2087391	0	11175	542.1	35959.8	1518.8	0.005	0.266	0.017	0.745	224267	78.0	0.107	30	70.6	199.2	4.9	0.010	NA	NA	480m.my8033_rel_native_lto.cy10_4g_ua10
2192237	0	11683	566.8	26824.3	1356.0	0.005	0.265	0.012	0.633	170648	80.1	0.078	29	70.6	199.2	4.8	0.016	NA	NA	480m.my8033_rel_native_lto.cy10_4g_ua17
2051709	0	10936	530.4	37913.8	1500.6	0.005	0.265	0.018	0.749	199437	78.2	0.097	30	70.6	199.2	5.0	0.008	NA	NA	480m.my8033_rel_native_lto.cy10_4g_ua18
2222685	0	11952	579.8	36919.7	1604.6	0.005	0.267	0.017	0.739	221683	79.0	0.100	28	70.6	199.2	4.9	0.007	NA	NA	480m.my8033_rel_native_lto.cy10_4g_ua19
l.i1
l.i1: continue load after secondary indexes created. Graphs for performance per 1-second interval are here.
Average throughput:
Insert response time histogram: each cell has the percentage of responses that take <= the time in the header and max is the max response time in seconds. For the max column values in the top 25% of the range have a red background and in the bottom 25% of the range have a green background. The red background is not used when the min value is within 80% of the max value.
| dbms | 256us | 1ms | 4ms | 16ms | 64ms | 256ms | 1s | 4s | 16s | gt | max |
|---|---|---|---|---|---|---|---|---|---|---|---|
| my8033_rel_native_lto.cy10_4g_u | 0.013 | 4.866 | 53.619 | 37.079 | 4.273 | 0.085 | 0.064 | 11.097 | |||
| my8033_rel_native_lto.cy10_4g_ua7 | 0.005 | 4.789 | 51.977 | 38.753 | 4.321 | 0.095 | 0.060 | 11.563 | |||
| my8033_rel_native_lto.cy10_4g_ua8 | 0.001 | 4.528 | 51.016 | 39.855 | 4.444 | 0.090 | 0.066 | 11.816 | |||
| my8033_rel_native_lto.cy10_4g_ua9 | 0.001 | 4.504 | 50.401 | 40.512 | 4.410 | 0.103 | 0.069 | 11.145 | |||
| my8033_rel_native_lto.cy10_4g_ua10 | nonzero | 3.962 | 56.910 | 34.186 | 4.724 | 0.183 | 0.036 | 10.364 | |||
| my8033_rel_native_lto.cy10_4g_ua17 | nonzero | 6.881 | 71.201 | 20.283 | 1.519 | 0.069 | 0.047 | 9.942 | |||
| my8033_rel_native_lto.cy10_4g_ua18 | nonzero | 2.432 | 51.668 | 40.218 | 5.577 | 0.088 | 0.017 | 10.004 | |||
| my8033_rel_native_lto.cy10_4g_ua19 | 0.007 | 4.131 | 53.387 | 37.911 | 4.380 | 0.124 | 0.059 | 9.083 |
Delete response time histogram: each cell has the percentage of responses that take <= the time in the header and max is the max response time in seconds. For the max column values in the top 25% of the range have a red background and in the bottom 25% of the range have a green background. The red background is not used when the min value is within 80% of the max value.
| dbms | 256us | 1ms | 4ms | 16ms | 64ms | 256ms | 1s | 4s | 16s | gt | max |
|---|---|---|---|---|---|---|---|---|---|---|---|
| my8033_rel_native_lto.cy10_4g_u | 0.111 | 6.893 | 55.066 | 34.124 | 3.662 | 0.083 | 0.062 | 11.833 | |||
| my8033_rel_native_lto.cy10_4g_ua7 | 0.057 | 6.658 | 53.486 | 35.924 | 3.727 | 0.091 | 0.058 | 10.711 | |||
| my8033_rel_native_lto.cy10_4g_ua8 | 0.047 | 6.497 | 52.454 | 37.076 | 3.778 | 0.084 | 0.064 | 11.079 | |||
| my8033_rel_native_lto.cy10_4g_ua9 | 0.040 | 6.009 | 52.250 | 37.818 | 3.721 | 0.095 | 0.067 | 11.340 | |||
| my8033_rel_native_lto.cy10_4g_ua10 | 0.023 | 5.802 | 58.318 | 31.605 | 4.043 | 0.176 | 0.033 | 9.918 | |||
| my8033_rel_native_lto.cy10_4g_ua17 | 0.044 | 9.520 | 70.141 | 18.905 | 1.283 | 0.064 | 0.043 | 9.142 | |||
| my8033_rel_native_lto.cy10_4g_ua18 | 0.029 | 3.921 | 52.536 | 38.694 | 4.723 | 0.081 | 0.016 | 9.211 | |||
| my8033_rel_native_lto.cy10_4g_ua19 | 0.083 | 5.916 | 54.764 | 35.227 | 3.833 | 0.120 | 0.057 | 9.554 |
Performance metrics for the DBMS listed above. Some are normalized by throughput, others are not. Legend for results is here.
ips	qps	rps	rmbps	wps	wmbps	rpq	rkbpq	wpi	wkbpi	csps	cpups	cspq	cpupq	dbgb1	dbgb2	rss	maxop	p50	p99	tag
12535	0	47	0.6	27822.1	793.5	0.004	0.050	2.220	64.819	563837	34.6	44.980	2208	117.5	256.3	4.8	11.097	0	0	480m.my8033_rel_native_lto.cy10_4g_u
12244	0	45	0.6	26722.3	768.7	0.004	0.048	2.183	64.294	558090	34.1	45.582	2228	117.5	256.3	4.8	11.563	0	0	480m.my8033_rel_native_lto.cy10_4g_ua7
11839	0	44	0.6	25567.8	740.5	0.004	0.048	2.160	64.052	536874	33.7	45.348	2277	117.5	256.3	4.8	11.816	0	0	480m.my8033_rel_native_lto.cy10_4g_ua8
11621	0	42	0.6	23469.1	695.2	0.004	0.049	2.020	61.257	523974	33.1	45.088	2279	117.5	256.3	4.8	11.145	0	0	480m.my8033_rel_native_lto.cy10_4g_ua9
12208	0	35	0.7	25805.7	783.4	0.003	0.055	2.114	65.711	537987	36.1	44.070	2366	117.4	256.1	4.8	10.364	50	0	480m.my8033_rel_native_lto.cy10_4g_ua10
16952	0	67	0.9	28118.3	621.6	0.004	0.054	1.659	37.551	528935	41.3	31.203	1949	117.5	256.1	4.8	9.942	0	0	480m.my8033_rel_native_lto.cy10_4g_ua17
13159	0	50	0.6	24111.9	740.4	0.004	0.050	1.832	57.616	455895	38.9	34.644	2365	117.2	256.2	4.9	10.004	549	50	480m.my8033_rel_native_lto.cy10_4g_ua18
12440	0	48	0.6	33698.6	939.5	0.004	0.052	2.709	77.335	575410	36.6	46.254	2354	117.5	256.3	4.8	9.083	0	0	480m.my8033_rel_native_lto.cy10_4g_ua19
q100.1
q100.1: range queries with 100 insert/s per client. Graphs for performance per 1-second interval are here.
Average throughput:

Query response time histogram: each cell has the percentage of responses that take <= the time in the header and max is the max response time in seconds. For max values in the top 25% of the range have a red background and in the bottom 25% of the range have a green background. The red background is not used when the min value is within 80% of the max value.
| dbms |
|---|
Insert response time histogram: each cell has the percentage of responses that take <= the time in the header and max is the max response time in seconds. For max values in the top 25% of the range have a red background and in the bottom 25% of the range have a green background. The red background is not used when the min value is within 80% of the max value.
| dbms |
|---|
Performance metrics for the DBMS listed above. Some are normalized by throughput, others are not. Legend for results is here.
ips	qps	rps	rmbps	wps	wmbps	rpq	rkbpq	wpi	wkbpi	csps	cpups	cspq	cpupq	dbgb1	dbgb2	rss	maxop	p50	p99	tag
0	0	0														NA				480m.my8033_rel_native_lto.cy10_4g_u
0	0	0														NA				480m.my8033_rel_native_lto.cy10_4g_ua7
0	0	0														NA				480m.my8033_rel_native_lto.cy10_4g_ua8
0	0	0														NA				480m.my8033_rel_native_lto.cy10_4g_ua9
0	0	0														NA				480m.my8033_rel_native_lto.cy10_4g_ua10
0	0	0														NA				480m.my8033_rel_native_lto.cy10_4g_ua17
0	0	0														NA				480m.my8033_rel_native_lto.cy10_4g_ua18
0	0	0														NA				480m.my8033_rel_native_lto.cy10_4g_ua19
q500.1
q500.1: range queries with 500 insert/s per client. Graphs for performance per 1-second interval are here.
Average throughput:

Query response time histogram: each cell has the percentage of responses that take <= the time in the header and max is the max response time in seconds. For max values in the top 25% of the range have a red background and in the bottom 25% of the range have a green background. The red background is not used when the min value is within 80% of the max value.
| dbms |
|---|
Insert response time histogram: each cell has the percentage of responses that take <= the time in the header and max is the max response time in seconds. For max values in the top 25% of the range have a red background and in the bottom 25% of the range have a green background. The red background is not used when the min value is within 80% of the max value.
| dbms |
|---|
Performance metrics for the DBMS listed above. Some are normalized by throughput, others are not. Legend for results is here.
ips	qps	rps	rmbps	wps	wmbps	rpq	rkbpq	wpi	wkbpi	csps	cpups	cspq	cpupq	dbgb1	dbgb2	rss	maxop	p50	p99	tag
0	0	0														NA				480m.my8033_rel_native_lto.cy10_4g_u
0	0	0														NA				480m.my8033_rel_native_lto.cy10_4g_ua7
0	0	0														NA				480m.my8033_rel_native_lto.cy10_4g_ua8
0	0	0														NA				480m.my8033_rel_native_lto.cy10_4g_ua9
0	0	0														NA				480m.my8033_rel_native_lto.cy10_4g_ua10
0	0	0														NA				480m.my8033_rel_native_lto.cy10_4g_ua17
0	0	0														NA				480m.my8033_rel_native_lto.cy10_4g_ua18
0	0	0														NA				480m.my8033_rel_native_lto.cy10_4g_ua19
q1000.1
q1000.1: range queries with 1000 insert/s per client. Graphs for performance per 1-second interval are here.
Average throughput:

Query response time histogram: each cell has the percentage of responses that take <= the time in the header and max is the max response time in seconds. For max values in the top 25% of the range have a red background and in the bottom 25% of the range have a green background. The red background is not used when the min value is within 80% of the max value.
| dbms |
|---|
Insert response time histogram: each cell has the percentage of responses that take <= the time in the header and max is the max response time in seconds. For max values in the top 25% of the range have a red background and in the bottom 25% of the range have a green background. The red background is not used when the min value is within 80% of the max value.
| dbms |
|---|
Performance metrics for the DBMS listed above. Some are normalized by throughput, others are not. Legend for results is here.
ips	qps	rps	rmbps	wps	wmbps	rpq	rkbpq	wpi	wkbpi	csps	cpups	cspq	cpupq	dbgb1	dbgb2	rss	maxop	p50	p99	tag
0	0	0														NA				480m.my8033_rel_native_lto.cy10_4g_u
0	0	0														NA				480m.my8033_rel_native_lto.cy10_4g_ua7
0	0	0														NA				480m.my8033_rel_native_lto.cy10_4g_ua8
0	0	0														NA				480m.my8033_rel_native_lto.cy10_4g_ua9
0	0	0														NA				480m.my8033_rel_native_lto.cy10_4g_ua10
0	0	0														NA				480m.my8033_rel_native_lto.cy10_4g_ua17
0	0	0														NA				480m.my8033_rel_native_lto.cy10_4g_ua18
0	0	0														NA				480m.my8033_rel_native_lto.cy10_4g_ua19
l.i0
l.i0: load without secondary indexes
Performance metrics for all DBMS, not just the ones listed above. Some are normalized by throughput, others are not. Legend for results is here.
ips	qps	rps	rmbps	wps	wmbps	rpq	rkbpq	wpi	wkbpi	csps	cpups	cspq	cpupq	dbgb1	dbgb2	rss	maxop	p50	p99	tag
910816	0	0	0.0	3598.0	240.5	0.000	0.000	0.004	0.270	230820	49.9	0.253	44	31.7	160.3	4.8	0.114	40060	33966	480m.my8033_rel_native_lto.cy10_4g_u
917782	0	0	0.0	3622.6	242.0	0.000	0.000	0.004	0.270	230253	49.8	0.251	43	31.7	160.3	4.6	0.124	40060	33766	480m.my8033_rel_native_lto.cy10_4g_ua7
916030	0	0	0.0	3592.5	241.5	0.000	0.000	0.004	0.270	230854	49.4	0.252	43	31.7	160.3	4.4	0.124	39860	33766	480m.my8033_rel_native_lto.cy10_4g_ua8
916030	0	0	0.0	3548.2	242.0	0.000	0.000	0.004	0.271	234047	49.9	0.256	44	31.7	160.3	3.9	0.116	40355	34366	480m.my8033_rel_native_lto.cy10_4g_ua9
912548	0	0	0.0	3577.6	241.1	0.000	0.000	0.004	0.271	239392	49.5	0.262	43	31.7	160.3	4.8	0.117	40160	34266	480m.my8033_rel_native_lto.cy10_4g_ua10
900563	0	0	0.0	2331.8	189.4	0.000	0.000	0.003	0.215	216687	50.8	0.241	45	31.7	160.3	4.7	0.114	39361	34074	480m.my8033_rel_native_lto.cy10_4g_ua17
892193	0	0	0.0	3919.0	240.2	0.000	0.000	0.004	0.276	231224	50.6	0.259	45	31.7	160.3	4.8	0.113	39560	33766	480m.my8033_rel_native_lto.cy10_4g_ua18
902256	0	0	0.0	3695.6	244.7	0.000	0.000	0.004	0.278	233372	51.4	0.259	46	31.7	160.3	4.7	0.116	39660	34266	480m.my8033_rel_native_lto.cy10_4g_ua19
l.x
l.x: create secondary indexes
Performance metrics for all DBMS, not just the ones listed above. Some are normalized by throughput, others are not. Legend for results is here.
ips	qps	rps	rmbps	wps	wmbps	rpq	rkbpq	wpi	wkbpi	csps	cpups	cspq	cpupq	dbgb1	dbgb2	rss	maxop	p50	p99	tag
2133778	0	11422	554.1	37390.0	1552.6	0.005	0.266	0.018	0.745	220122	77.9	0.103	29	70.6	199.2	4.9	0.007	NA	NA	480m.my8033_rel_native_lto.cy10_4g_u
2096506	0	11174	542.0	36633.4	1517.8	0.005	0.265	0.017	0.741	218695	76.7	0.104	29	70.6	199.2	4.9	0.007	NA	NA	480m.my8033_rel_native_lto.cy10_4g_ua7
2143304	0	11426	554.2	36808.7	1550.3	0.005	0.265	0.017	0.741	223137	78.4	0.104	29	70.6	199.2	4.9	0.008	NA	NA	480m.my8033_rel_native_lto.cy10_4g_ua8
2212442	0	11955	579.9	39194.6	1619.7	0.005	0.268	0.018	0.750	236912	78.5	0.107	28	70.6	199.2	4.9	0.006	NA	NA	480m.my8033_rel_native_lto.cy10_4g_ua9
2087391	0	11175	542.1	35959.8	1518.8	0.005	0.266	0.017	0.745	224267	78.0	0.107	30	70.6	199.2	4.9	0.010	NA	NA	480m.my8033_rel_native_lto.cy10_4g_ua10
2192237	0	11683	566.8	26824.3	1356.0	0.005	0.265	0.012	0.633	170648	80.1	0.078	29	70.6	199.2	4.8	0.016	NA	NA	480m.my8033_rel_native_lto.cy10_4g_ua17
2051709	0	10936	530.4	37913.8	1500.6	0.005	0.265	0.018	0.749	199437	78.2	0.097	30	70.6	199.2	5.0	0.008	NA	NA	480m.my8033_rel_native_lto.cy10_4g_ua18
2222685	0	11952	579.8	36919.7	1604.6	0.005	0.267	0.017	0.739	221683	79.0	0.100	28	70.6	199.2	4.9	0.007	NA	NA	480m.my8033_rel_native_lto.cy10_4g_ua19
l.i1
l.i1: continue load after secondary indexes created
Performance metrics for all DBMS, not just the ones listed above. Some are normalized by throughput, others are not. Legend for results is here.
ips	qps	rps	rmbps	wps	wmbps	rpq	rkbpq	wpi	wkbpi	csps	cpups	cspq	cpupq	dbgb1	dbgb2	rss	maxop	p50	p99	tag
12535	0	47	0.6	27822.1	793.5	0.004	0.050	2.220	64.819	563837	34.6	44.980	2208	117.5	256.3	4.8	11.097	0	0	480m.my8033_rel_native_lto.cy10_4g_u
12244	0	45	0.6	26722.3	768.7	0.004	0.048	2.183	64.294	558090	34.1	45.582	2228	117.5	256.3	4.8	11.563	0	0	480m.my8033_rel_native_lto.cy10_4g_ua7
11839	0	44	0.6	25567.8	740.5	0.004	0.048	2.160	64.052	536874	33.7	45.348	2277	117.5	256.3	4.8	11.816	0	0	480m.my8033_rel_native_lto.cy10_4g_ua8
11621	0	42	0.6	23469.1	695.2	0.004	0.049	2.020	61.257	523974	33.1	45.088	2279	117.5	256.3	4.8	11.145	0	0	480m.my8033_rel_native_lto.cy10_4g_ua9
12208	0	35	0.7	25805.7	783.4	0.003	0.055	2.114	65.711	537987	36.1	44.070	2366	117.4	256.1	4.8	10.364	50	0	480m.my8033_rel_native_lto.cy10_4g_ua10
16952	0	67	0.9	28118.3	621.6	0.004	0.054	1.659	37.551	528935	41.3	31.203	1949	117.5	256.1	4.8	9.942	0	0	480m.my8033_rel_native_lto.cy10_4g_ua17
13159	0	50	0.6	24111.9	740.4	0.004	0.050	1.832	57.616	455895	38.9	34.644	2365	117.2	256.2	4.9	10.004	549	50	480m.my8033_rel_native_lto.cy10_4g_ua18
12440	0	48	0.6	33698.6	939.5	0.004	0.052	2.709	77.335	575410	36.6	46.254	2354	117.5	256.3	4.8	9.083	0	0	480m.my8033_rel_native_lto.cy10_4g_ua19
q100.1
q100.1: range queries with 100 insert/s per client
Performance metrics for all DBMS, not just the ones listed above. Some are normalized by throughput, others are not. Legend for results is here.
ips	qps	rps	rmbps	wps	wmbps	rpq	rkbpq	wpi	wkbpi	csps	cpups	cspq	cpupq	dbgb1	dbgb2	rss	maxop	p50	p99	tag
0	0	0														NA				480m.my8033_rel_native_lto.cy10_4g_u
0	0	0														NA				480m.my8033_rel_native_lto.cy10_4g_ua7
0	0	0														NA				480m.my8033_rel_native_lto.cy10_4g_ua8
0	0	0														NA				480m.my8033_rel_native_lto.cy10_4g_ua9
0	0	0														NA				480m.my8033_rel_native_lto.cy10_4g_ua10
0	0	0														NA				480m.my8033_rel_native_lto.cy10_4g_ua17
0	0	0														NA				480m.my8033_rel_native_lto.cy10_4g_ua18
0	0	0														NA				480m.my8033_rel_native_lto.cy10_4g_ua19
q500.1
q500.1: range queries with 500 insert/s per client
Performance metrics for all DBMS, not just the ones listed above. Some are normalized by throughput, others are not. Legend for results is here.
ips	qps	rps	rmbps	wps	wmbps	rpq	rkbpq	wpi	wkbpi	csps	cpups	cspq	cpupq	dbgb1	dbgb2	rss	maxop	p50	p99	tag
0	0	0														NA				480m.my8033_rel_native_lto.cy10_4g_u
0	0	0														NA				480m.my8033_rel_native_lto.cy10_4g_ua7
0	0	0														NA				480m.my8033_rel_native_lto.cy10_4g_ua8
0	0	0														NA				480m.my8033_rel_native_lto.cy10_4g_ua9
0	0	0														NA				480m.my8033_rel_native_lto.cy10_4g_ua10
0	0	0														NA				480m.my8033_rel_native_lto.cy10_4g_ua17
0	0	0														NA				480m.my8033_rel_native_lto.cy10_4g_ua18
0	0	0														NA				480m.my8033_rel_native_lto.cy10_4g_ua19
q1000.1
q1000.1: range queries with 1000 insert/s per client
Performance metrics for all DBMS, not just the ones listed above. Some are normalized by throughput, others are not. Legend for results is here.
ips	qps	rps	rmbps	wps	wmbps	rpq	rkbpq	wpi	wkbpi	csps	cpups	cspq	cpupq	dbgb1	dbgb2	rss	maxop	p50	p99	tag
0	0	0														NA				480m.my8033_rel_native_lto.cy10_4g_u
0	0	0														NA				480m.my8033_rel_native_lto.cy10_4g_ua7
0	0	0														NA				480m.my8033_rel_native_lto.cy10_4g_ua8
0	0	0														NA				480m.my8033_rel_native_lto.cy10_4g_ua9
0	0	0														NA				480m.my8033_rel_native_lto.cy10_4g_ua10
0	0	0														NA				480m.my8033_rel_native_lto.cy10_4g_ua17
0	0	0														NA				480m.my8033_rel_native_lto.cy10_4g_ua18
0	0	0														NA				480m.my8033_rel_native_lto.cy10_4g_ua19
l.i0
- l.i0: load without secondary indexes
- Legend for results is here.
- Each entry lists the percentage of responses that fit in that bucket (slower than max time for previous bucket, faster than min time for next bucket).
Insert response time histogram
256us	1ms	4ms	16ms	64ms	256ms	1s	4s	16s	gt	max	tag
0.000	0.000	99.779	0.174	0.004	0.043	0.000	0.000	0.000	0.000	0.114	my8033_rel_native_lto.cy10_4g_u
0.000	0.000	99.779	0.175	0.003	0.043	0.000	0.000	0.000	0.000	0.124	my8033_rel_native_lto.cy10_4g_ua7
0.000	0.000	99.778	0.177	0.002	0.043	0.000	0.000	0.000	0.000	0.124	my8033_rel_native_lto.cy10_4g_ua8
0.000	0.000	99.757	0.196	0.005	0.043	0.000	0.000	0.000	0.000	0.116	my8033_rel_native_lto.cy10_4g_ua9
0.000	0.000	99.770	0.184	0.003	0.043	0.000	0.000	0.000	0.000	0.117	my8033_rel_native_lto.cy10_4g_ua10
0.000	0.000	99.779	0.177	0.001	0.043	0.000	0.000	0.000	0.000	0.114	my8033_rel_native_lto.cy10_4g_ua17
0.000	0.000	99.767	0.186	0.004	0.043	0.000	0.000	0.000	0.000	0.113	my8033_rel_native_lto.cy10_4g_ua18
0.000	0.000	99.774	0.180	0.003	0.043	0.000	0.000	0.000	0.000	0.116	my8033_rel_native_lto.cy10_4g_ua19
l.x
- l.x: create secondary indexes
- Legend for results is here.
- Each entry lists the percentage of responses that fit in that bucket (slower than max time for previous bucket, faster than min time for next bucket).
TODO - determine whether there is data for create index response time
l.i1
- l.i1: continue load after secondary indexes created
- Legend for results is here.
- Each entry lists the percentage of responses that fit in that bucket (slower than max time for previous bucket, faster than min time for next bucket).
Insert response time histogram
256us	1ms	4ms	16ms	64ms	256ms	1s	4s	16s	gt	max	tag
0.000	0.000	0.013	4.866	53.619	37.079	4.273	0.085	0.064	0.000	11.097	my8033_rel_native_lto.cy10_4g_u
0.000	0.000	0.005	4.789	51.977	38.753	4.321	0.095	0.060	0.000	11.563	my8033_rel_native_lto.cy10_4g_ua7
0.000	0.000	0.001	4.528	51.016	39.855	4.444	0.090	0.066	0.000	11.816	my8033_rel_native_lto.cy10_4g_ua8
0.000	0.000	0.001	4.504	50.401	40.512	4.410	0.103	0.069	0.000	11.145	my8033_rel_native_lto.cy10_4g_ua9
0.000	0.000	nonzero	3.962	56.910	34.186	4.724	0.183	0.036	0.000	10.364	my8033_rel_native_lto.cy10_4g_ua10
0.000	0.000	nonzero	6.881	71.201	20.283	1.519	0.069	0.047	0.000	9.942	my8033_rel_native_lto.cy10_4g_ua17
0.000	0.000	nonzero	2.432	51.668	40.218	5.577	0.088	0.017	0.000	10.004	my8033_rel_native_lto.cy10_4g_ua18
0.000	0.000	0.007	4.131	53.387	37.911	4.380	0.124	0.059	0.000	9.083	my8033_rel_native_lto.cy10_4g_ua19
Delete response time histogram
256us	1ms	4ms	16ms	64ms	256ms	1s	4s	16s	gt	max	tag
0.000	0.000	0.111	6.893	55.066	34.124	3.662	0.083	0.062	0.000	11.833	my8033_rel_native_lto.cy10_4g_u
0.000	0.000	0.057	6.658	53.486	35.924	3.727	0.091	0.058	0.000	10.711	my8033_rel_native_lto.cy10_4g_ua7
0.000	0.000	0.047	6.497	52.454	37.076	3.778	0.084	0.064	0.000	11.079	my8033_rel_native_lto.cy10_4g_ua8
0.000	0.000	0.040	6.009	52.250	37.818	3.721	0.095	0.067	0.000	11.340	my8033_rel_native_lto.cy10_4g_ua9
0.000	0.000	0.023	5.802	58.318	31.605	4.043	0.176	0.033	0.000	9.918	my8033_rel_native_lto.cy10_4g_ua10
0.000	0.000	0.044	9.520	70.141	18.905	1.283	0.064	0.043	0.000	9.142	my8033_rel_native_lto.cy10_4g_ua17
0.000	0.000	0.029	3.921	52.536	38.694	4.723	0.081	0.016	0.000	9.211	my8033_rel_native_lto.cy10_4g_ua18
0.000	0.000	0.083	5.916	54.764	35.227	3.833	0.120	0.057	0.000	9.554	my8033_rel_native_lto.cy10_4g_ua19
q100.1
- q100.1: range queries with 100 insert/s per client
- Legend for results is here.
- Each entry lists the percentage of responses that fit in that bucket (slower than max time for previous bucket, faster than min time for next bucket).
Query response time histogram
Insert response time histogram
q500.1
- q500.1: range queries with 500 insert/s per client
- Legend for results is here.
- Each entry lists the percentage of responses that fit in that bucket (slower than max time for previous bucket, faster than min time for next bucket).
Query response time histogram
Insert response time histogram
q1000.1
- q1000.1: range queries with 1000 insert/s per client
- Legend for results is here.
- Each entry lists the percentage of responses that fit in that bucket (slower than max time for previous bucket, faster than min time for next bucket).
Query response time histogram
Insert response time histogram