Introduction
This is a report for the insert benchmark with 3200M docs and 8 client(s). It is generated by scripts (bash, awk, sed) and Tufte might not be impressed. An overview of the insert benchmark is here and a short update is here. Below, by DBMS, I mean DBMS+version.config. An example is my8020.c10b40 where my means MySQL, 8020 is version 8.0.20 and c10b40 is the name for the configuration file.
The test server is a c2-standard-30 with 15 cores, hyperthreads disabled, 120G RAM and XFS with SW RAID 0 across 4 NVMe SSD. The benchmark was run with 8 clients and there were 1 or 3 connections per client (1 for queries or inserts without rate limits, 1+1 for rate limited inserts+deletes). It uses 8 tables, 1 per client. It loads 400M rows per table without secondary indexes, creates secondary indexes, then inserts 20M rows per table with a delete per insert to avoid growing the table. It then does 3 read+write tests for 3600s each that do queries as fast as possible with 100, 500 and then 1000 inserts/second/client concurrent with the queries and 1000 deletes/second to avoid growing the table. The database is larger than memory. Clients and the DBMS share one server. The per-database configs are in the per-database subdirectories here.
The tested DBMS are:
- pg153_o3_native_lto.cx7a_gcp_c2s30 - Postgres 15.3, the cx7a_gcp_c2s30 config and the build used: -O3 -march=native -mtune=native -flto
- pg153_o3_native_lto.cx7a16_gcp_c2s30 - Postgres 15.3, the cx7a16_gcp_c2s30 config, compiled with -O3 -march=native -mtune=native -flto, adds autovacuum_vacuum_scale_factor=0.05 autovacuum_vacuum_insert_scale_factor=0.05
- pg153_o3_native_lto.cx7a18_gcp_c2s30 - Postgres 15.3, the cx7a18_gcp_c2s30 config, compiled with -O3 -march=native -mtune=native -flto, combines a1, a10, a12, a16
Contents
- Summary
- l.i0: load without secondary indexes
- l.x: create secondary indexes
- l.i1: continue load after secondary indexes created
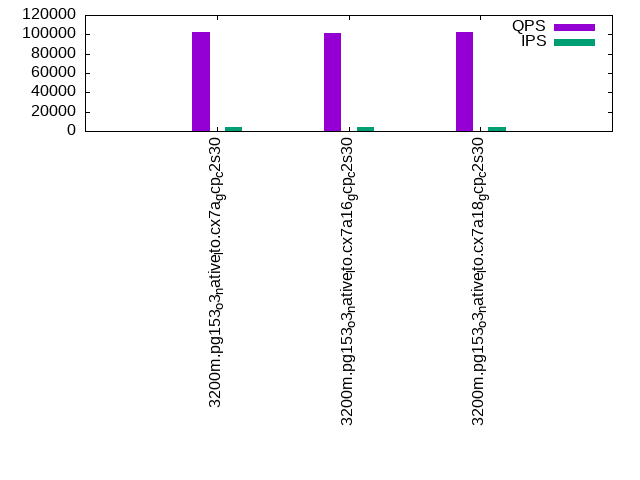
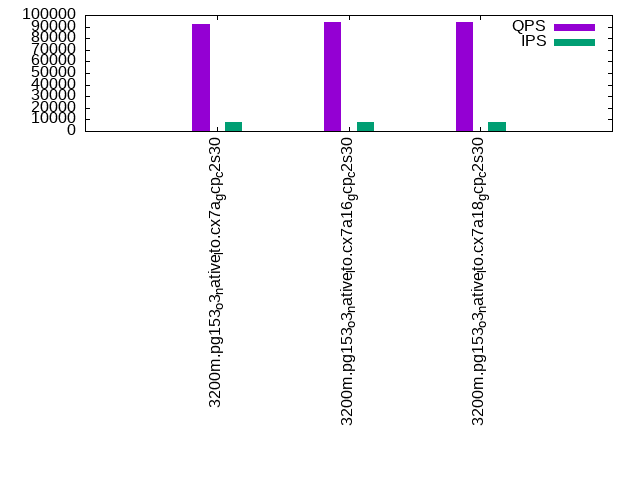
- q100.1: range queries with 100 insert/s per client
- q500.1: range queries with 500 insert/s per client
- q1000.1: range queries with 1000 insert/s per client
Summary
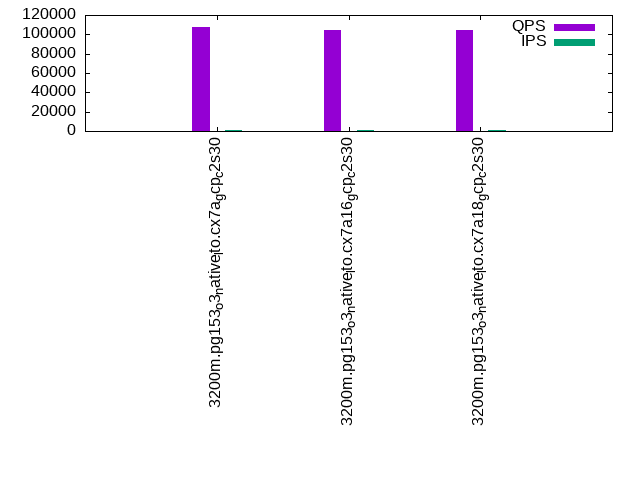
The numbers are inserts/s for l.i0 and l.i1, indexed docs (or rows) /s for l.x and queries/s for q*.2. The values are the average rate over the entire test for inserts (IPS) and queries (QPS). The range of values for IPS and QPS is split into 3 parts: bottom 25%, middle 50%, top 25%. Values in the bottom 25% have a red background, values in the top 25% have a green background and values in the middle have no color. A gray background is used for values that can be ignored because the DBMS did not sustain the target insert rate. Red backgrounds are not used when the minimum value is within 80% of the max value.
| dbms | l.i0 | l.x | l.i1 | q100.1 | q500.1 | q1000.1 |
|---|---|---|---|---|---|---|
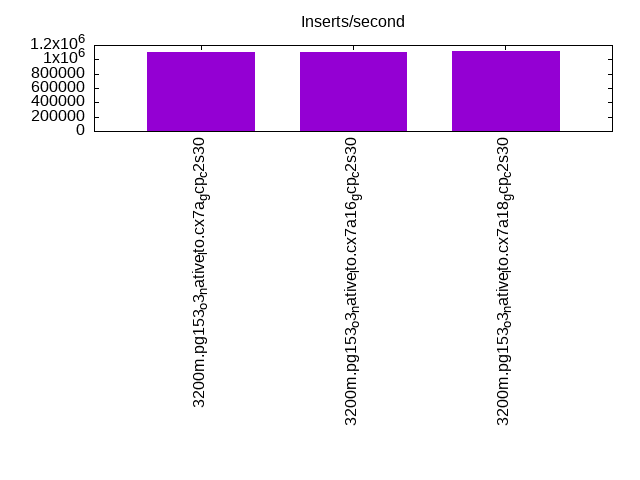
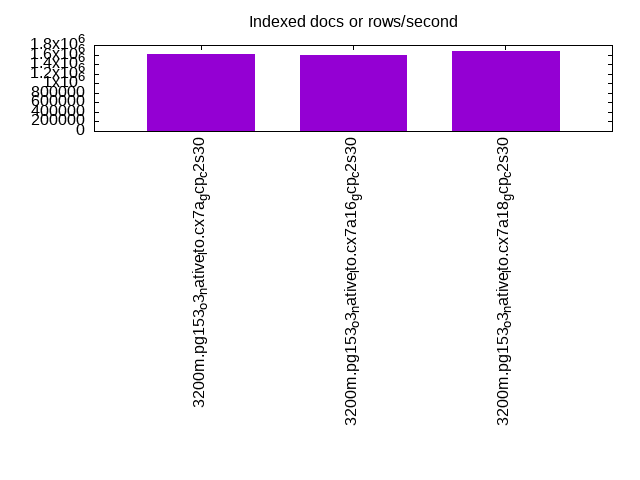
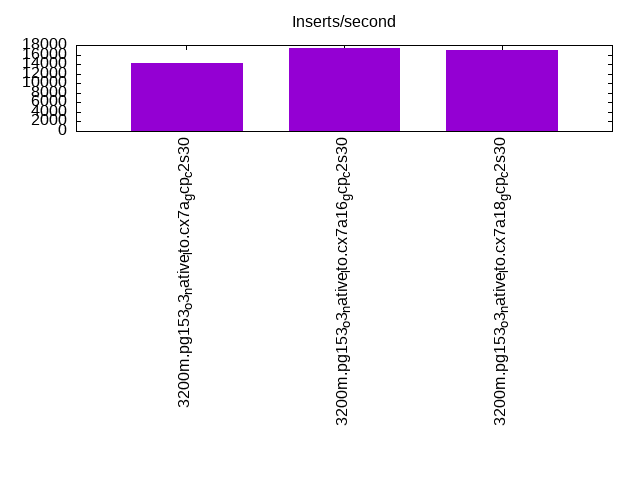
| 3200m.pg153_o3_native_lto.cx7a_gcp_c2s30 | 1095515 | 1605670 | 14327 | 107501 | 102588 | 92410 |
| 3200m.pg153_o3_native_lto.cx7a16_gcp_c2s30 | 1103829 | 1589717 | 17288 | 104374 | 101288 | 93766 |
| 3200m.pg153_o3_native_lto.cx7a18_gcp_c2s30 | 1120448 | 1672818 | 16972 | 104770 | 102422 | 93702 |
This table has relative throughput, throughput for the DBMS relative to the DBMS in the first line, using the absolute throughput from the previous table.
| dbms | l.i0 | l.x | l.i1 | q100.1 | q500.1 | q1000.1 |
|---|---|---|---|---|---|---|
| 3200m.pg153_o3_native_lto.cx7a_gcp_c2s30 | 1.00 | 1.00 | 1.00 | 1.00 | 1.00 | 1.00 |
| 3200m.pg153_o3_native_lto.cx7a16_gcp_c2s30 | 1.01 | 0.99 | 1.21 | 0.97 | 0.99 | 1.01 |
| 3200m.pg153_o3_native_lto.cx7a18_gcp_c2s30 | 1.02 | 1.04 | 1.18 | 0.97 | 1.00 | 1.01 |
This lists the average rate of inserts/s for the tests that do inserts concurrent with queries. For such tests the query rate is listed in the table above. The read+write tests are setup so that the insert rate should match the target rate every second. Cells that are not at least 95% of the target have a red background to indicate a failure to satisfy the target.
| dbms | q100.1 | q500.1 | q1000.1 |
|---|---|---|---|
| pg153_o3_native_lto.cx7a_gcp_c2s30 | 789 | 3941 | 7882 |
| pg153_o3_native_lto.cx7a16_gcp_c2s30 | 788 | 3941 | 7882 |
| pg153_o3_native_lto.cx7a18_gcp_c2s30 | 789 | 3941 | 7895 |
| target | 800 | 4000 | 8000 |
l.i0
l.i0: load without secondary indexes. Graphs for performance per 1-second interval are here.
Average throughput:
Insert response time histogram: each cell has the percentage of responses that take <= the time in the header and max is the max response time in seconds. For the max column values in the top 25% of the range have a red background and in the bottom 25% of the range have a green background. The red background is not used when the min value is within 80% of the max value.
| dbms | 256us | 1ms | 4ms | 16ms | 64ms | 256ms | 1s | 4s | 16s | gt | max |
|---|---|---|---|---|---|---|---|---|---|---|---|
| pg153_o3_native_lto.cx7a_gcp_c2s30 | 97.088 | 2.819 | 0.062 | 0.013 | 0.017 | 0.001 | 0.603 | ||||
| pg153_o3_native_lto.cx7a16_gcp_c2s30 | 97.594 | 2.337 | 0.045 | 0.009 | 0.015 | 0.001 | 0.780 | ||||
| pg153_o3_native_lto.cx7a18_gcp_c2s30 | 97.919 | 2.028 | 0.026 | 0.009 | 0.016 | 0.001 | 0.838 |
Performance metrics for the DBMS listed above. Some are normalized by throughput, others are not. Legend for results is here.
ips	qps	rps	rmbps	wps	wmbps	rpq	rkbpq	wpi	wkbpi	csps	cpups	cspq	cpupq	dbgb1	dbgb2	rss	maxop	p50	p99	tag
1095515	0	567	4.5	1513.7	302.9	0.001	0.004	0.001	0.283	92086	81.3	0.084	11	306.2	376.2	0.0	0.603	144542	48148	3200m.pg153_o3_native_lto.cx7a_gcp_c2s30
1103829	0	553	4.3	1361.5	262.9	0.001	0.004	0.001	0.244	93570	81.9	0.085	11	306.2	376.2	0.0	0.780	144643	51943	3200m.pg153_o3_native_lto.cx7a16_gcp_c2s30
1120448	0	549	4.3	1380.9	256.8	0.000	0.004	0.001	0.235	94390	82.1	0.084	11	306.2	376.2	0.0	0.838	146540	56538	3200m.pg153_o3_native_lto.cx7a18_gcp_c2s30
l.x
l.x: create secondary indexes.
Average throughput:
Performance metrics for the DBMS listed above. Some are normalized by throughput, others are not. Legend for results is here.
ips	qps	rps	rmbps	wps	wmbps	rpq	rkbpq	wpi	wkbpi	csps	cpups	cspq	cpupq	dbgb1	dbgb2	rss	maxop	p50	p99	tag
1605670	0	5739	703.5	1512.8	341.4	0.004	0.449	0.001	0.218	40709	35.4	0.025	3	588.1	658.2	0.0	0.002	NA	NA	3200m.pg153_o3_native_lto.cx7a_gcp_c2s30
1589717	0	5951	706.8	1428.7	324.4	0.004	0.455	0.001	0.209	40658	35.1	0.026	3	588.1	658.2	0.0	0.002	NA	NA	3200m.pg153_o3_native_lto.cx7a16_gcp_c2s30
1672818	0	6319	739.8	1346.3	305.3	0.004	0.453	0.001	0.187	16029	37.2	0.010	3	588.1	651.8	0.0	0.002	NA	NA	3200m.pg153_o3_native_lto.cx7a18_gcp_c2s30
l.i1
l.i1: continue load after secondary indexes created. Graphs for performance per 1-second interval are here.
Average throughput:
Insert response time histogram: each cell has the percentage of responses that take <= the time in the header and max is the max response time in seconds. For the max column values in the top 25% of the range have a red background and in the bottom 25% of the range have a green background. The red background is not used when the min value is within 80% of the max value.
| dbms | 256us | 1ms | 4ms | 16ms | 64ms | 256ms | 1s | 4s | 16s | gt | max |
|---|---|---|---|---|---|---|---|---|---|---|---|
| pg153_o3_native_lto.cx7a_gcp_c2s30 | 0.208 | 19.111 | 54.578 | 26.082 | 0.019 | nonzero | 0.642 | ||||
| pg153_o3_native_lto.cx7a16_gcp_c2s30 | 0.005 | 2.349 | 60.105 | 37.428 | 0.107 | 0.006 | 0.782 | ||||
| pg153_o3_native_lto.cx7a18_gcp_c2s30 | 2.702 | 65.758 | 31.513 | 0.025 | 0.003 | nonzero | 1.033 |
Delete response time histogram: each cell has the percentage of responses that take <= the time in the header and max is the max response time in seconds. For the max column values in the top 25% of the range have a red background and in the bottom 25% of the range have a green background. The red background is not used when the min value is within 80% of the max value.
| dbms | 256us | 1ms | 4ms | 16ms | 64ms | 256ms | 1s | 4s | 16s | gt | max |
|---|---|---|---|---|---|---|---|---|---|---|---|
| pg153_o3_native_lto.cx7a_gcp_c2s30 | 61.369 | 1.452 | 2.540 | 9.383 | 12.574 | 12.681 | 0.251 | ||||
| pg153_o3_native_lto.cx7a16_gcp_c2s30 | 68.648 | 2.804 | 3.308 | 10.289 | 12.044 | 2.905 | 0.001 | 0.400 | |||
| pg153_o3_native_lto.cx7a18_gcp_c2s30 | 65.242 | 2.950 | 2.513 | 10.504 | 17.345 | 1.445 | nonzero | 0.352 |
Performance metrics for the DBMS listed above. Some are normalized by throughput, others are not. Legend for results is here.
ips	qps	rps	rmbps	wps	wmbps	rpq	rkbpq	wpi	wkbpi	csps	cpups	cspq	cpupq	dbgb1	dbgb2	rss	maxop	p50	p99	tag
14327	0	14688	129.5	20000.0	305.6	1.025	9.256	1.396	21.844	36332	38.1	2.536	399	615.7	675.9	0.0	0.642	450	400	3200m.pg153_o3_native_lto.cx7a_gcp_c2s30
17288	0	21497	225.9	30667.6	474.0	1.243	13.380	1.774	28.079	51752	27.9	2.994	242	614.0	664.0	0.0	0.782	2898	1399	3200m.pg153_o3_native_lto.cx7a16_gcp_c2s30
16972	0	20106	195.1	27165.1	333.0	1.185	11.769	1.601	20.093	48058	29.3	2.831	259	611.6	671.0	0.0	1.033	3246	1448	3200m.pg153_o3_native_lto.cx7a18_gcp_c2s30
q100.1
q100.1: range queries with 100 insert/s per client. Graphs for performance per 1-second interval are here.
Average throughput:
Query response time histogram: each cell has the percentage of responses that take <= the time in the header and max is the max response time in seconds. For max values in the top 25% of the range have a red background and in the bottom 25% of the range have a green background. The red background is not used when the min value is within 80% of the max value.
| dbms | 256us | 1ms | 4ms | 16ms | 64ms | 256ms | 1s | 4s | 16s | gt | max |
|---|---|---|---|---|---|---|---|---|---|---|---|
| pg153_o3_native_lto.cx7a_gcp_c2s30 | 99.500 | 0.496 | 0.003 | nonzero | nonzero | nonzero | 0.158 | ||||
| pg153_o3_native_lto.cx7a16_gcp_c2s30 | 99.203 | 0.789 | 0.008 | nonzero | nonzero | nonzero | 0.111 | ||||
| pg153_o3_native_lto.cx7a18_gcp_c2s30 | 98.873 | 1.103 | 0.023 | 0.001 | nonzero | nonzero | 0.137 |
Insert response time histogram: each cell has the percentage of responses that take <= the time in the header and max is the max response time in seconds. For max values in the top 25% of the range have a red background and in the bottom 25% of the range have a green background. The red background is not used when the min value is within 80% of the max value.
| dbms | 256us | 1ms | 4ms | 16ms | 64ms | 256ms | 1s | 4s | 16s | gt | max |
|---|---|---|---|---|---|---|---|---|---|---|---|
| pg153_o3_native_lto.cx7a_gcp_c2s30 | 0.448 | 46.594 | 52.812 | 0.146 | 0.216 | ||||||
| pg153_o3_native_lto.cx7a16_gcp_c2s30 | 12.167 | 25.885 | 61.865 | 0.083 | 0.169 | ||||||
| pg153_o3_native_lto.cx7a18_gcp_c2s30 | 0.031 | 45.031 | 54.740 | 0.167 | 0.031 | 0.358 |
Delete response time histogram: each cell has the percentage of responses that take <= the time in the header and max is the max response time in seconds. For max values in the top 25% of the range have a red background and in the bottom 25% of the range have a green background. The red background is not used when the min value is within 80% of the max value.
| dbms | 256us | 1ms | 4ms | 16ms | 64ms | 256ms | 1s | 4s | 16s | gt | max |
|---|---|---|---|---|---|---|---|---|---|---|---|
| pg153_o3_native_lto.cx7a_gcp_c2s30 | 79.167 | 20.469 | 0.365 | 0.002 | |||||||
| pg153_o3_native_lto.cx7a16_gcp_c2s30 | 42.917 | 32.854 | 11.719 | 12.510 | 0.013 | ||||||
| pg153_o3_native_lto.cx7a18_gcp_c2s30 | 56.698 | 42.854 | 0.448 | 0.002 |
Performance metrics for the DBMS listed above. Some are normalized by throughput, others are not. Legend for results is here.
ips	qps	rps	rmbps	wps	wmbps	rpq	rkbpq	wpi	wkbpi	csps	cpups	cspq	cpupq	dbgb1	dbgb2	rss	maxop	p50	p99	tag
789	107501	3170	35.7	2218.4	40.7	0.029	0.340	2.810	52.815	416253	51.2	3.872	71	615.7	685.7	0.0	0.158	13873	7911	3200m.pg153_o3_native_lto.cx7a_gcp_c2s30
788	104374	3268	35.6	3539.4	63.4	0.031	0.349	4.491	82.397	406167	51.7	3.891	74	614.1	684.1	0.0	0.111	13735	6377	3200m.pg153_o3_native_lto.cx7a16_gcp_c2s30
789	104770	3442	39.0	4219.7	86.0	0.033	0.381	5.345	111.526	406847	50.8	3.883	73	611.6	681.7	0.0	0.137	13921	4685	3200m.pg153_o3_native_lto.cx7a18_gcp_c2s30
q500.1
q500.1: range queries with 500 insert/s per client. Graphs for performance per 1-second interval are here.
Average throughput:
Query response time histogram: each cell has the percentage of responses that take <= the time in the header and max is the max response time in seconds. For max values in the top 25% of the range have a red background and in the bottom 25% of the range have a green background. The red background is not used when the min value is within 80% of the max value.
| dbms | 256us | 1ms | 4ms | 16ms | 64ms | 256ms | 1s | 4s | 16s | gt | max |
|---|---|---|---|---|---|---|---|---|---|---|---|
| pg153_o3_native_lto.cx7a_gcp_c2s30 | 99.940 | 0.058 | 0.002 | nonzero | nonzero | 0.020 | |||||
| pg153_o3_native_lto.cx7a16_gcp_c2s30 | 99.889 | 0.106 | 0.004 | nonzero | nonzero | 0.020 | |||||
| pg153_o3_native_lto.cx7a18_gcp_c2s30 | 99.926 | 0.072 | 0.002 | nonzero | 0.015 |
Insert response time histogram: each cell has the percentage of responses that take <= the time in the header and max is the max response time in seconds. For max values in the top 25% of the range have a red background and in the bottom 25% of the range have a green background. The red background is not used when the min value is within 80% of the max value.
| dbms | 256us | 1ms | 4ms | 16ms | 64ms | 256ms | 1s | 4s | 16s | gt | max |
|---|---|---|---|---|---|---|---|---|---|---|---|
| pg153_o3_native_lto.cx7a_gcp_c2s30 | 35.727 | 64.256 | 0.017 | 0.156 | |||||||
| pg153_o3_native_lto.cx7a16_gcp_c2s30 | 5.548 | 28.031 | 66.421 | 0.045 | |||||||
| pg153_o3_native_lto.cx7a18_gcp_c2s30 | 40.710 | 59.290 | 0.046 |
Delete response time histogram: each cell has the percentage of responses that take <= the time in the header and max is the max response time in seconds. For max values in the top 25% of the range have a red background and in the bottom 25% of the range have a green background. The red background is not used when the min value is within 80% of the max value.
| dbms | 256us | 1ms | 4ms | 16ms | 64ms | 256ms | 1s | 4s | 16s | gt | max |
|---|---|---|---|---|---|---|---|---|---|---|---|
| pg153_o3_native_lto.cx7a_gcp_c2s30 | 83.158 | 10.554 | 6.275 | 0.013 | 0.011 | ||||||
| pg153_o3_native_lto.cx7a16_gcp_c2s30 | 41.083 | 14.906 | 26.381 | 17.621 | 0.008 | 0.019 | |||||
| pg153_o3_native_lto.cx7a18_gcp_c2s30 | 71.398 | 15.977 | 12.608 | 0.017 | 0.014 |
Performance metrics for the DBMS listed above. Some are normalized by throughput, others are not. Legend for results is here.
ips	qps	rps	rmbps	wps	wmbps	rpq	rkbpq	wpi	wkbpi	csps	cpups	cspq	cpupq	dbgb1	dbgb2	rss	maxop	p50	p99	tag
3941	102588	5382	43.9	6516.9	100.1	0.052	0.438	1.654	26.019	404264	55.0	3.941	80	615.7	677.6	0.0	0.020	12887	12498	3200m.pg153_o3_native_lto.cx7a_gcp_c2s30
3941	101288	5356	43.7	6603.5	99.9	0.053	0.442	1.676	25.950	396349	56.0	3.913	83	614.1	675.6	0.0	0.020	12791	12386	3200m.pg153_o3_native_lto.cx7a16_gcp_c2s30
3941	102422	5368	43.8	6607.4	83.9	0.052	0.438	1.677	21.813	402209	55.6	3.927	81	611.7	671.6	0.0	0.015	12914	12626	3200m.pg153_o3_native_lto.cx7a18_gcp_c2s30
q1000.1
q1000.1: range queries with 1000 insert/s per client. Graphs for performance per 1-second interval are here.
Average throughput:
Query response time histogram: each cell has the percentage of responses that take <= the time in the header and max is the max response time in seconds. For max values in the top 25% of the range have a red background and in the bottom 25% of the range have a green background. The red background is not used when the min value is within 80% of the max value.
| dbms | 256us | 1ms | 4ms | 16ms | 64ms | 256ms | 1s | 4s | 16s | gt | max |
|---|---|---|---|---|---|---|---|---|---|---|---|
| pg153_o3_native_lto.cx7a_gcp_c2s30 | 99.816 | 0.180 | 0.004 | 0.001 | nonzero | 0.017 | |||||
| pg153_o3_native_lto.cx7a16_gcp_c2s30 | 99.653 | 0.335 | 0.009 | 0.002 | nonzero | nonzero | 0.071 | ||||
| pg153_o3_native_lto.cx7a18_gcp_c2s30 | 99.750 | 0.245 | 0.004 | 0.001 | nonzero | 0.016 |
Insert response time histogram: each cell has the percentage of responses that take <= the time in the header and max is the max response time in seconds. For max values in the top 25% of the range have a red background and in the bottom 25% of the range have a green background. The red background is not used when the min value is within 80% of the max value.
| dbms | 256us | 1ms | 4ms | 16ms | 64ms | 256ms | 1s | 4s | 16s | gt | max |
|---|---|---|---|---|---|---|---|---|---|---|---|
| pg153_o3_native_lto.cx7a_gcp_c2s30 | 26.879 | 73.109 | 0.011 | 0.072 | |||||||
| pg153_o3_native_lto.cx7a16_gcp_c2s30 | 37.304 | 62.642 | 0.054 | 0.093 | |||||||
| pg153_o3_native_lto.cx7a18_gcp_c2s30 | 37.009 | 62.991 | 0.042 |
Delete response time histogram: each cell has the percentage of responses that take <= the time in the header and max is the max response time in seconds. For max values in the top 25% of the range have a red background and in the bottom 25% of the range have a green background. The red background is not used when the min value is within 80% of the max value.
| dbms | 256us | 1ms | 4ms | 16ms | 64ms | 256ms | 1s | 4s | 16s | gt | max |
|---|---|---|---|---|---|---|---|---|---|---|---|
| pg153_o3_native_lto.cx7a_gcp_c2s30 | 88.546 | 9.552 | 1.867 | 0.034 | 0.001 | 0.017 | |||||
| pg153_o3_native_lto.cx7a16_gcp_c2s30 | 30.721 | 6.600 | 12.456 | 46.360 | 3.858 | 0.004 | 0.086 | ||||
| pg153_o3_native_lto.cx7a18_gcp_c2s30 | 65.894 | 8.889 | 13.643 | 11.569 | 0.006 | 0.020 |
Performance metrics for the DBMS listed above. Some are normalized by throughput, others are not. Legend for results is here.
ips	qps	rps	rmbps	wps	wmbps	rpq	rkbpq	wpi	wkbpi	csps	cpups	cspq	cpupq	dbgb1	dbgb2	rss	maxop	p50	p99	tag
7882	92410	10488	86.3	13156.7	199.2	0.113	0.956	1.669	25.886	374787	57.8	4.056	94	615.8	685.4	0.0	0.017	11635	10804	3200m.pg153_o3_native_lto.cx7a_gcp_c2s30
7882	93766	10565	86.8	14079.6	196.0	0.113	0.948	1.786	25.466	355182	61.4	3.788	98	614.1	673.7	0.0	0.071	11715	10388	3200m.pg153_o3_native_lto.cx7a16_gcp_c2s30
7895	93702	10651	88.2	12972.1	158.3	0.114	0.964	1.643	20.532	372861	59.2	3.979	95	611.8	666.0	0.0	0.016	11635	11076	3200m.pg153_o3_native_lto.cx7a18_gcp_c2s30
l.i0
l.i0: load without secondary indexes
Performance metrics for all DBMS, not just the ones listed above. Some are normalized by throughput, others are not. Legend for results is here.
ips	qps	rps	rmbps	wps	wmbps	rpq	rkbpq	wpi	wkbpi	csps	cpups	cspq	cpupq	dbgb1	dbgb2	rss	maxop	p50	p99	tag
1095515	0	567	4.5	1513.7	302.9	0.001	0.004	0.001	0.283	92086	81.3	0.084	11	306.2	376.2	0.0	0.603	144542	48148	3200m.pg153_o3_native_lto.cx7a_gcp_c2s30
1103829	0	553	4.3	1361.5	262.9	0.001	0.004	0.001	0.244	93570	81.9	0.085	11	306.2	376.2	0.0	0.780	144643	51943	3200m.pg153_o3_native_lto.cx7a16_gcp_c2s30
1120448	0	549	4.3	1380.9	256.8	0.000	0.004	0.001	0.235	94390	82.1	0.084	11	306.2	376.2	0.0	0.838	146540	56538	3200m.pg153_o3_native_lto.cx7a18_gcp_c2s30
l.x
l.x: create secondary indexes
Performance metrics for all DBMS, not just the ones listed above. Some are normalized by throughput, others are not. Legend for results is here.
ips	qps	rps	rmbps	wps	wmbps	rpq	rkbpq	wpi	wkbpi	csps	cpups	cspq	cpupq	dbgb1	dbgb2	rss	maxop	p50	p99	tag
1605670	0	5739	703.5	1512.8	341.4	0.004	0.449	0.001	0.218	40709	35.4	0.025	3	588.1	658.2	0.0	0.002	NA	NA	3200m.pg153_o3_native_lto.cx7a_gcp_c2s30
1589717	0	5951	706.8	1428.7	324.4	0.004	0.455	0.001	0.209	40658	35.1	0.026	3	588.1	658.2	0.0	0.002	NA	NA	3200m.pg153_o3_native_lto.cx7a16_gcp_c2s30
1672818	0	6319	739.8	1346.3	305.3	0.004	0.453	0.001	0.187	16029	37.2	0.010	3	588.1	651.8	0.0	0.002	NA	NA	3200m.pg153_o3_native_lto.cx7a18_gcp_c2s30
l.i1
l.i1: continue load after secondary indexes created
Performance metrics for all DBMS, not just the ones listed above. Some are normalized by throughput, others are not. Legend for results is here.
ips	qps	rps	rmbps	wps	wmbps	rpq	rkbpq	wpi	wkbpi	csps	cpups	cspq	cpupq	dbgb1	dbgb2	rss	maxop	p50	p99	tag
14327	0	14688	129.5	20000.0	305.6	1.025	9.256	1.396	21.844	36332	38.1	2.536	399	615.7	675.9	0.0	0.642	450	400	3200m.pg153_o3_native_lto.cx7a_gcp_c2s30
17288	0	21497	225.9	30667.6	474.0	1.243	13.380	1.774	28.079	51752	27.9	2.994	242	614.0	664.0	0.0	0.782	2898	1399	3200m.pg153_o3_native_lto.cx7a16_gcp_c2s30
16972	0	20106	195.1	27165.1	333.0	1.185	11.769	1.601	20.093	48058	29.3	2.831	259	611.6	671.0	0.0	1.033	3246	1448	3200m.pg153_o3_native_lto.cx7a18_gcp_c2s30
q100.1
q100.1: range queries with 100 insert/s per client
Performance metrics for all DBMS, not just the ones listed above. Some are normalized by throughput, others are not. Legend for results is here.
ips	qps	rps	rmbps	wps	wmbps	rpq	rkbpq	wpi	wkbpi	csps	cpups	cspq	cpupq	dbgb1	dbgb2	rss	maxop	p50	p99	tag
789	107501	3170	35.7	2218.4	40.7	0.029	0.340	2.810	52.815	416253	51.2	3.872	71	615.7	685.7	0.0	0.158	13873	7911	3200m.pg153_o3_native_lto.cx7a_gcp_c2s30
788	104374	3268	35.6	3539.4	63.4	0.031	0.349	4.491	82.397	406167	51.7	3.891	74	614.1	684.1	0.0	0.111	13735	6377	3200m.pg153_o3_native_lto.cx7a16_gcp_c2s30
789	104770	3442	39.0	4219.7	86.0	0.033	0.381	5.345	111.526	406847	50.8	3.883	73	611.6	681.7	0.0	0.137	13921	4685	3200m.pg153_o3_native_lto.cx7a18_gcp_c2s30
q500.1
q500.1: range queries with 500 insert/s per client
Performance metrics for all DBMS, not just the ones listed above. Some are normalized by throughput, others are not. Legend for results is here.
ips	qps	rps	rmbps	wps	wmbps	rpq	rkbpq	wpi	wkbpi	csps	cpups	cspq	cpupq	dbgb1	dbgb2	rss	maxop	p50	p99	tag
3941	102588	5382	43.9	6516.9	100.1	0.052	0.438	1.654	26.019	404264	55.0	3.941	80	615.7	677.6	0.0	0.020	12887	12498	3200m.pg153_o3_native_lto.cx7a_gcp_c2s30
3941	101288	5356	43.7	6603.5	99.9	0.053	0.442	1.676	25.950	396349	56.0	3.913	83	614.1	675.6	0.0	0.020	12791	12386	3200m.pg153_o3_native_lto.cx7a16_gcp_c2s30
3941	102422	5368	43.8	6607.4	83.9	0.052	0.438	1.677	21.813	402209	55.6	3.927	81	611.7	671.6	0.0	0.015	12914	12626	3200m.pg153_o3_native_lto.cx7a18_gcp_c2s30
q1000.1
q1000.1: range queries with 1000 insert/s per client
Performance metrics for all DBMS, not just the ones listed above. Some are normalized by throughput, others are not. Legend for results is here.
ips	qps	rps	rmbps	wps	wmbps	rpq	rkbpq	wpi	wkbpi	csps	cpups	cspq	cpupq	dbgb1	dbgb2	rss	maxop	p50	p99	tag
7882	92410	10488	86.3	13156.7	199.2	0.113	0.956	1.669	25.886	374787	57.8	4.056	94	615.8	685.4	0.0	0.017	11635	10804	3200m.pg153_o3_native_lto.cx7a_gcp_c2s30
7882	93766	10565	86.8	14079.6	196.0	0.113	0.948	1.786	25.466	355182	61.4	3.788	98	614.1	673.7	0.0	0.071	11715	10388	3200m.pg153_o3_native_lto.cx7a16_gcp_c2s30
7895	93702	10651	88.2	12972.1	158.3	0.114	0.964	1.643	20.532	372861	59.2	3.979	95	611.8	666.0	0.0	0.016	11635	11076	3200m.pg153_o3_native_lto.cx7a18_gcp_c2s30
l.i0
- l.i0: load without secondary indexes
- Legend for results is here.
- Each entry lists the percentage of responses that fit in that bucket (slower than max time for previous bucket, faster than min time for next bucket).
Insert response time histogram
256us	1ms	4ms	16ms	64ms	256ms	1s	4s	16s	gt	max	tag
0.000	97.088	2.819	0.062	0.013	0.017	0.001	0.000	0.000	0.000	0.603	pg153_o3_native_lto.cx7a_gcp_c2s30
0.000	97.594	2.337	0.045	0.009	0.015	0.001	0.000	0.000	0.000	0.780	pg153_o3_native_lto.cx7a16_gcp_c2s30
0.000	97.919	2.028	0.026	0.009	0.016	0.001	0.000	0.000	0.000	0.838	pg153_o3_native_lto.cx7a18_gcp_c2s30
l.x
- l.x: create secondary indexes
- Legend for results is here.
- Each entry lists the percentage of responses that fit in that bucket (slower than max time for previous bucket, faster than min time for next bucket).
TODO - determine whether there is data for create index response time
l.i1
- l.i1: continue load after secondary indexes created
- Legend for results is here.
- Each entry lists the percentage of responses that fit in that bucket (slower than max time for previous bucket, faster than min time for next bucket).
Insert response time histogram
256us	1ms	4ms	16ms	64ms	256ms	1s	4s	16s	gt	max	tag
0.000	0.208	19.111	54.578	26.082	0.019	nonzero	0.000	0.000	0.000	0.642	pg153_o3_native_lto.cx7a_gcp_c2s30
0.000	0.005	2.349	60.105	37.428	0.107	0.006	0.000	0.000	0.000	0.782	pg153_o3_native_lto.cx7a16_gcp_c2s30
0.000	0.000	2.702	65.758	31.513	0.025	0.003	nonzero	0.000	0.000	1.033	pg153_o3_native_lto.cx7a18_gcp_c2s30
Delete response time histogram
256us	1ms	4ms	16ms	64ms	256ms	1s	4s	16s	gt	max	tag
61.369	1.452	2.540	9.383	12.574	12.681	0.000	0.000	0.000	0.000	0.251	pg153_o3_native_lto.cx7a_gcp_c2s30
68.648	2.804	3.308	10.289	12.044	2.905	0.001	0.000	0.000	0.000	0.400	pg153_o3_native_lto.cx7a16_gcp_c2s30
65.242	2.950	2.513	10.504	17.345	1.445	nonzero	0.000	0.000	0.000	0.352	pg153_o3_native_lto.cx7a18_gcp_c2s30
q100.1
- q100.1: range queries with 100 insert/s per client
- Legend for results is here.
- Each entry lists the percentage of responses that fit in that bucket (slower than max time for previous bucket, faster than min time for next bucket).
Query response time histogram
256us	1ms	4ms	16ms	64ms	256ms	1s	4s	16s	gt	max	tag
99.500	0.496	0.003	nonzero	nonzero	nonzero	0.000	0.000	0.000	0.000	0.158	pg153_o3_native_lto.cx7a_gcp_c2s30
99.203	0.789	0.008	nonzero	nonzero	nonzero	0.000	0.000	0.000	0.000	0.111	pg153_o3_native_lto.cx7a16_gcp_c2s30
98.873	1.103	0.023	0.001	nonzero	nonzero	0.000	0.000	0.000	0.000	0.137	pg153_o3_native_lto.cx7a18_gcp_c2s30
Insert response time histogram
256us	1ms	4ms	16ms	64ms	256ms	1s	4s	16s	gt	max	tag
0.000	0.000	0.448	46.594	52.812	0.146	0.000	0.000	0.000	0.000	0.216	pg153_o3_native_lto.cx7a_gcp_c2s30
0.000	0.000	12.167	25.885	61.865	0.083	0.000	0.000	0.000	0.000	0.169	pg153_o3_native_lto.cx7a16_gcp_c2s30
0.000	0.000	0.031	45.031	54.740	0.167	0.031	0.000	0.000	0.000	0.358	pg153_o3_native_lto.cx7a18_gcp_c2s30
Delete response time histogram
256us	1ms	4ms	16ms	64ms	256ms	1s	4s	16s	gt	max	tag
79.167	20.469	0.365	0.000	0.000	0.000	0.000	0.000	0.000	0.000	0.002	pg153_o3_native_lto.cx7a_gcp_c2s30
42.917	32.854	11.719	12.510	0.000	0.000	0.000	0.000	0.000	0.000	0.013	pg153_o3_native_lto.cx7a16_gcp_c2s30
56.698	42.854	0.448	0.000	0.000	0.000	0.000	0.000	0.000	0.000	0.002	pg153_o3_native_lto.cx7a18_gcp_c2s30
q500.1
- q500.1: range queries with 500 insert/s per client
- Legend for results is here.
- Each entry lists the percentage of responses that fit in that bucket (slower than max time for previous bucket, faster than min time for next bucket).
Query response time histogram
256us	1ms	4ms	16ms	64ms	256ms	1s	4s	16s	gt	max	tag
99.940	0.058	0.002	nonzero	nonzero	0.000	0.000	0.000	0.000	0.000	0.020	pg153_o3_native_lto.cx7a_gcp_c2s30
99.889	0.106	0.004	nonzero	nonzero	0.000	0.000	0.000	0.000	0.000	0.020	pg153_o3_native_lto.cx7a16_gcp_c2s30
99.926	0.072	0.002	nonzero	0.000	0.000	0.000	0.000	0.000	0.000	0.015	pg153_o3_native_lto.cx7a18_gcp_c2s30
Insert response time histogram
256us	1ms	4ms	16ms	64ms	256ms	1s	4s	16s	gt	max	tag
0.000	0.000	0.000	35.727	64.256	0.017	0.000	0.000	0.000	0.000	0.156	pg153_o3_native_lto.cx7a_gcp_c2s30
0.000	0.000	5.548	28.031	66.421	0.000	0.000	0.000	0.000	0.000	0.045	pg153_o3_native_lto.cx7a16_gcp_c2s30
0.000	0.000	0.000	40.710	59.290	0.000	0.000	0.000	0.000	0.000	0.046	pg153_o3_native_lto.cx7a18_gcp_c2s30
Delete response time histogram
256us	1ms	4ms	16ms	64ms	256ms	1s	4s	16s	gt	max	tag
83.158	10.554	6.275	0.013	0.000	0.000	0.000	0.000	0.000	0.000	0.011	pg153_o3_native_lto.cx7a_gcp_c2s30
41.083	14.906	26.381	17.621	0.008	0.000	0.000	0.000	0.000	0.000	0.019	pg153_o3_native_lto.cx7a16_gcp_c2s30
71.398	15.977	12.608	0.017	0.000	0.000	0.000	0.000	0.000	0.000	0.014	pg153_o3_native_lto.cx7a18_gcp_c2s30
q1000.1
- q1000.1: range queries with 1000 insert/s per client
- Legend for results is here.
- Each entry lists the percentage of responses that fit in that bucket (slower than max time for previous bucket, faster than min time for next bucket).
Query response time histogram
256us	1ms	4ms	16ms	64ms	256ms	1s	4s	16s	gt	max	tag
99.816	0.180	0.004	0.001	nonzero	0.000	0.000	0.000	0.000	0.000	0.017	pg153_o3_native_lto.cx7a_gcp_c2s30
99.653	0.335	0.009	0.002	nonzero	nonzero	0.000	0.000	0.000	0.000	0.071	pg153_o3_native_lto.cx7a16_gcp_c2s30
99.750	0.245	0.004	0.001	nonzero	0.000	0.000	0.000	0.000	0.000	0.016	pg153_o3_native_lto.cx7a18_gcp_c2s30
Insert response time histogram
256us	1ms	4ms	16ms	64ms	256ms	1s	4s	16s	gt	max	tag
0.000	0.000	0.000	26.879	73.109	0.011	0.000	0.000	0.000	0.000	0.072	pg153_o3_native_lto.cx7a_gcp_c2s30
0.000	0.000	0.000	37.304	62.642	0.054	0.000	0.000	0.000	0.000	0.093	pg153_o3_native_lto.cx7a16_gcp_c2s30
0.000	0.000	0.000	37.009	62.991	0.000	0.000	0.000	0.000	0.000	0.042	pg153_o3_native_lto.cx7a18_gcp_c2s30
Delete response time histogram
256us	1ms	4ms	16ms	64ms	256ms	1s	4s	16s	gt	max	tag
88.546	9.552	1.867	0.034	0.001	0.000	0.000	0.000	0.000	0.000	0.017	pg153_o3_native_lto.cx7a_gcp_c2s30
30.721	6.600	12.456	46.360	3.858	0.004	0.000	0.000	0.000	0.000	0.086	pg153_o3_native_lto.cx7a16_gcp_c2s30
65.894	8.889	13.643	11.569	0.006	0.000	0.000	0.000	0.000	0.000	0.020	pg153_o3_native_lto.cx7a18_gcp_c2s30