Introduction
This is a report for the insert benchmark with 20M docs and 4 client(s). It is generated by scripts (bash, awk, sed) and Tufte might not be impressed. An overview of the insert benchmark is here and a short update is here. Below, by DBMS, I mean DBMS+version.config. An example is my8020.c10b40 where my means MySQL, 8020 is version 8.0.20 and c10b40 is the name for the configuration file.
The test server has 8 AMD cores, 16G RAM and an NVMe SSD. It is described here as the Beelink. The benchmark was run with 4 clients and there were 1 or 2 connections per client (1 for queries, 1 for inserts). It uses 4 tables, 1 per client. It loads 20M rows without secondary indexes, creates secondary indexes, loads another 20M rows then does 3 read+write tests for one hour each that do queries as fast as possible with 100, 500 and then 1000 writes/second/client concurrent with the queries. The database is cached by the OS but not by the database. Clients and the DBMS share one server. The per-database configs are in the per-database subdirectories here.
The tested DBMS are:
- pg1119_o3_native_lto.cx7_1g - Postgres 11.19, the cx7_1g config and the build used: -O3 -march=native -mtune=native
- pg1214_o3_native_lto.cx7_1g - Postgres 12.14, the cx7_1g config and the build used: -O3 -march=native -mtune=native
- pg1310_o3_native_lto.cx7_1g - Postgres 13.10, the cx7_1g config and the build used: -O3 -march=native -mtune=native
- pg147_o3_native_lto.cx7_1g - Postgres 14.7, the cx7_1g config and the build used: -O3 -march=native -mtune=native
- pg151_o3_native_lto.cx7_1g - Postgres 15.1, the cx7_1g config and the build used: -O3 -march=native -mtune=native
- pg152_o3_native_lto.cx7_1g - Postgres 15.2, the cx7_1g config and the build used: -O3 -march=native -mtune=native
Contents
- Summary
- l.i0: load without secondary indexes
- l.x: create secondary indexes
- l.i1: continue load after secondary indexes created
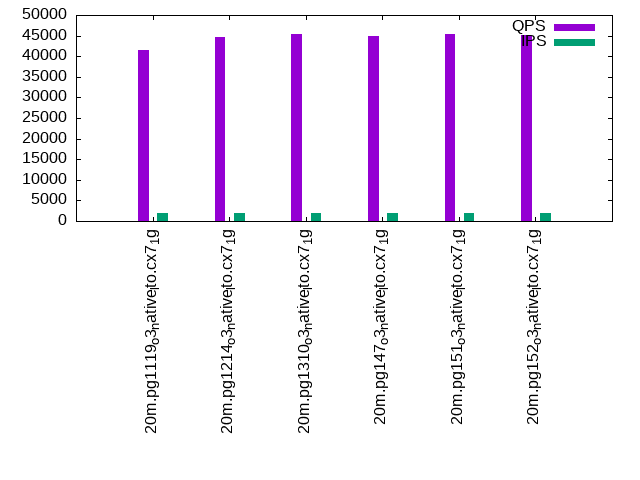
- q100.1: range queries with 100 insert/s per client
- q500.1: range queries with 500 insert/s per client
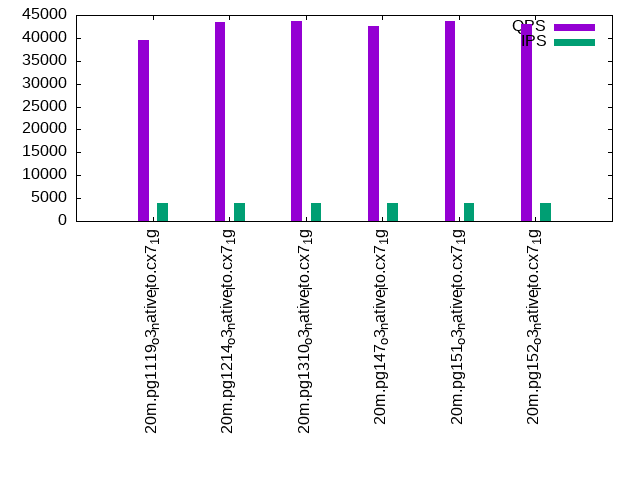
- q1000.1: range queries with 1000 insert/s per client
Summary
The numbers are inserts/s for l.i0 and l.i1, indexed docs (or rows) /s for l.x and queries/s for q*.2. The values are the average rate over the entire test for inserts (IPS) and queries (QPS). The range of values for IPS and QPS is split into 3 parts: bottom 25%, middle 50%, top 25%. Values in the bottom 25% have a red background, values in the top 25% have a green background and values in the middle have no color. A gray background is used for values that can be ignored because the DBMS did not sustain the target insert rate. Red backgrounds are not used when the minimum value is within 80% of the max value.
| dbms | l.i0 | l.x | l.i1 | q100.1 | q500.1 | q1000.1 |
|---|---|---|---|---|---|---|
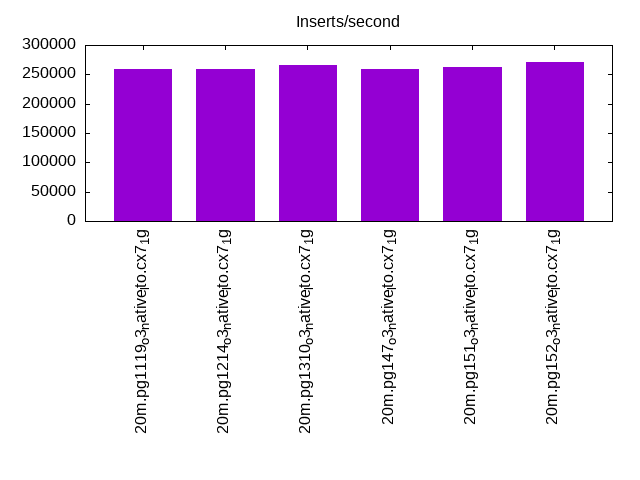
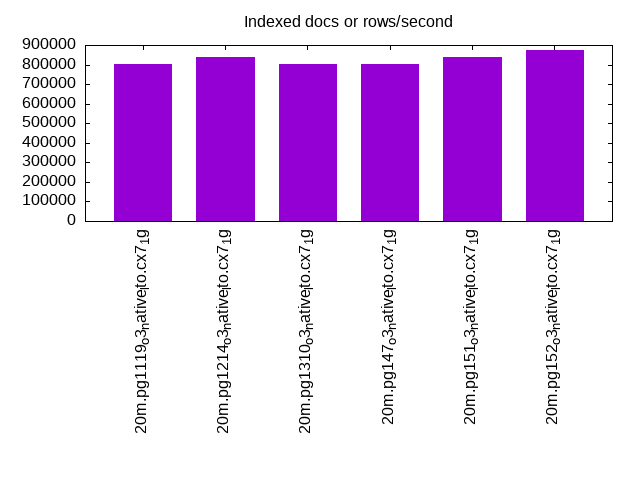
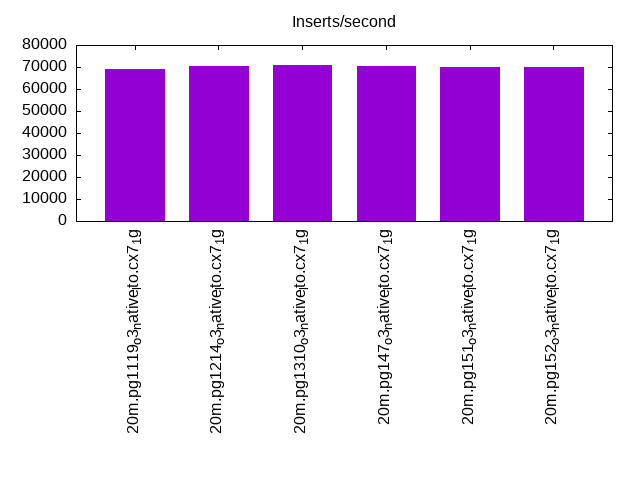
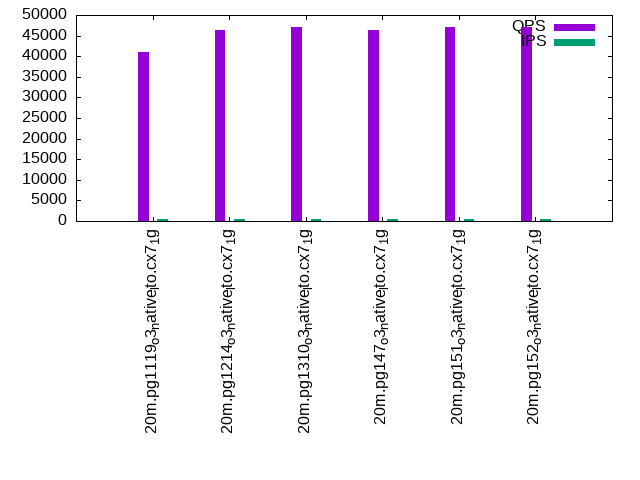
| 20m.pg1119_o3_native_lto.cx7_1g | 259740 | 804000 | 69204 | 41058 | 41410 | 39566 |
| 20m.pg1214_o3_native_lto.cx7_1g | 259740 | 837500 | 70422 | 46289 | 44769 | 43384 |
| 20m.pg1310_o3_native_lto.cx7_1g | 266667 | 804000 | 70922 | 47154 | 45410 | 43714 |
| 20m.pg147_o3_native_lto.cx7_1g | 259740 | 804000 | 70671 | 46376 | 44798 | 42522 |
| 20m.pg151_o3_native_lto.cx7_1g | 263158 | 837500 | 70175 | 47184 | 45508 | 43644 |
| 20m.pg152_o3_native_lto.cx7_1g | 270270 | 873913 | 70175 | 47035 | 45155 | 43029 |
This table has relative throughput, throughput for the DBMS relative to the DBMS in the first line, using the absolute throughput from the previous table.
| dbms | l.i0 | l.x | l.i1 | q100.1 | q500.1 | q1000.1 |
|---|---|---|---|---|---|---|
| 20m.pg1119_o3_native_lto.cx7_1g | 1.00 | 1.00 | 1.00 | 1.00 | 1.00 | 1.00 |
| 20m.pg1214_o3_native_lto.cx7_1g | 1.00 | 1.04 | 1.02 | 1.13 | 1.08 | 1.10 |
| 20m.pg1310_o3_native_lto.cx7_1g | 1.03 | 1.00 | 1.02 | 1.15 | 1.10 | 1.10 |
| 20m.pg147_o3_native_lto.cx7_1g | 1.00 | 1.00 | 1.02 | 1.13 | 1.08 | 1.07 |
| 20m.pg151_o3_native_lto.cx7_1g | 1.01 | 1.04 | 1.01 | 1.15 | 1.10 | 1.10 |
| 20m.pg152_o3_native_lto.cx7_1g | 1.04 | 1.09 | 1.01 | 1.15 | 1.09 | 1.09 |
This lists the average rate of inserts/s for the tests that do inserts concurrent with queries. For such tests the query rate is listed in the table above. The read+write tests are setup so that the insert rate should match the target rate every second. Cells that are not at least 95% of the target have a red background to indicate a failure to satisfy the target.
| dbms | q100.1 | q500.1 | q1000.1 |
|---|---|---|---|
| pg1119_o3_native_lto.cx7_1g | 399 | 1994 | 3989 |
| pg1214_o3_native_lto.cx7_1g | 399 | 1994 | 3989 |
| pg1310_o3_native_lto.cx7_1g | 399 | 1993 | 3989 |
| pg147_o3_native_lto.cx7_1g | 399 | 1994 | 3989 |
| pg151_o3_native_lto.cx7_1g | 399 | 1994 | 3989 |
| pg152_o3_native_lto.cx7_1g | 399 | 1994 | 3989 |
| target | 400 | 2000 | 4000 |
l.i0
l.i0: load without secondary indexes. Graphs for performance per 1-second interval are here.
Average throughput:
Insert response time histogram: each cell has the percentage of responses that take <= the time in the header and max is the max response time in seconds. For the max column values in the top 25% of the range have a red background and in the bottom 25% of the range have a green background. The red background is not used when the min value is within 80% of the max value.
| dbms | 256us | 1ms | 4ms | 16ms | 64ms | 256ms | 1s | 4s | 16s | gt | max |
|---|---|---|---|---|---|---|---|---|---|---|---|
| pg1119_o3_native_lto.cx7_1g | 99.942 | 0.057 | 0.012 | ||||||||
| pg1214_o3_native_lto.cx7_1g | 99.948 | 0.052 | 0.012 | ||||||||
| pg1310_o3_native_lto.cx7_1g | 99.936 | 0.064 | 0.012 | ||||||||
| pg147_o3_native_lto.cx7_1g | 99.941 | 0.059 | 0.011 | ||||||||
| pg151_o3_native_lto.cx7_1g | 0.001 | 99.941 | 0.058 | 0.011 | |||||||
| pg152_o3_native_lto.cx7_1g | 0.005 | 99.933 | 0.062 | 0.001 | 0.026 |
Performance metrics for the DBMS listed above. Some are normalized by throughput, others are not. Legend for results is here.
ips	qps	rps	rmbps	wps	wmbps	rpq	rkbpq	wpi	wkbpi	csps	cpups	cspq	cpupq	dbgb1	dbgb2	rss	maxop	p50	p99	tag
259740	0	0	0.0	502.7	124.4	0.000	0.000	0.002	0.490	26076	70.2	0.100	22	1.9	5.2	0.0	0.012	78915	57436	20m.pg1119_o3_native_lto.cx7_1g
259740	0	0	0.0	573.9	117.0	0.000	0.000	0.002	0.461	25901	70.6	0.100	22	1.9	5.2	0.0	0.012	77216	10688	20m.pg1214_o3_native_lto.cx7_1g
266667	0	0	0.0	492.0	120.6	0.000	0.000	0.002	0.463	26516	69.2	0.099	21	1.9	5.2	0.9	0.012	80912	72043	20m.pg1310_o3_native_lto.cx7_1g
259740	0	0	0.0	477.0	118.5	0.000	0.000	0.002	0.467	26257	70.3	0.101	22	1.9	5.2	1.0	0.011	77416	46849	20m.pg147_o3_native_lto.cx7_1g
263158	0	0	0.0	498.1	120.4	0.000	0.000	0.002	0.469	26166	69.4	0.099	21	1.9	5.2	1.0	0.011	80613	24373	20m.pg151_o3_native_lto.cx7_1g
270270	0	0	0.0	506.9	125.2	0.000	0.000	0.002	0.474	27164	70.7	0.101	21	1.9	5.2	1.0	0.026	82436	11188	20m.pg152_o3_native_lto.cx7_1g
l.x
l.x: create secondary indexes.
Average throughput:
Performance metrics for the DBMS listed above. Some are normalized by throughput, others are not. Legend for results is here.
ips	qps	rps	rmbps	wps	wmbps	rpq	rkbpq	wpi	wkbpi	csps	cpups	cspq	cpupq	dbgb1	dbgb2	rss	maxop	p50	p99	tag
804000	0	0	0.0	585.5	241.2	0.000	0.000	0.001	0.307	2714	37.3	0.003	4	3.7	8.6	0.0	0.004	NA	NA	20m.pg1119_o3_native_lto.cx7_1g
837500	0	0	0.0	728.7	163.3	0.000	0.000	0.001	0.200	1499	40.2	0.002	4	3.7	8.6	0.0	0.003	NA	NA	20m.pg1214_o3_native_lto.cx7_1g
804000	0	0	0.0	509.0	217.3	0.000	0.000	0.001	0.277	2180	37.2	0.003	4	3.7	8.6	0.0	0.004	NA	NA	20m.pg1310_o3_native_lto.cx7_1g
804000	0	0	0.0	479.0	207.1	0.000	0.000	0.001	0.264	2296	37.0	0.003	4	3.7	8.6	0.0	0.003	NA	NA	20m.pg147_o3_native_lto.cx7_1g
837500	0	0	0.0	552.7	218.8	0.000	0.000	0.001	0.268	2042	40.4	0.002	4	3.7	8.6	0.0	0.004	NA	NA	20m.pg151_o3_native_lto.cx7_1g
873913	0	0	0.0	586.3	235.9	0.000	0.000	0.001	0.276	1909	39.8	0.002	4	3.7	8.6	0.0	0.004	NA	NA	20m.pg152_o3_native_lto.cx7_1g
l.i1
l.i1: continue load after secondary indexes created. Graphs for performance per 1-second interval are here.
Average throughput:
Insert response time histogram: each cell has the percentage of responses that take <= the time in the header and max is the max response time in seconds. For the max column values in the top 25% of the range have a red background and in the bottom 25% of the range have a green background. The red background is not used when the min value is within 80% of the max value.
| dbms | 256us | 1ms | 4ms | 16ms | 64ms | 256ms | 1s | 4s | 16s | gt | max |
|---|---|---|---|---|---|---|---|---|---|---|---|
| pg1119_o3_native_lto.cx7_1g | 99.004 | 0.873 | 0.122 | nonzero | 0.079 | ||||||
| pg1214_o3_native_lto.cx7_1g | 99.044 | 0.836 | 0.120 | 0.054 | |||||||
| pg1310_o3_native_lto.cx7_1g | 99.078 | 0.789 | 0.132 | 0.001 | 0.085 | ||||||
| pg147_o3_native_lto.cx7_1g | 99.047 | 0.835 | 0.117 | 0.001 | 0.072 | ||||||
| pg151_o3_native_lto.cx7_1g | 99.010 | 0.881 | 0.109 | 0.054 | |||||||
| pg152_o3_native_lto.cx7_1g | 98.992 | 0.898 | 0.109 | 0.001 | 0.075 |
Performance metrics for the DBMS listed above. Some are normalized by throughput, others are not. Legend for results is here.
ips	qps	rps	rmbps	wps	wmbps	rpq	rkbpq	wpi	wkbpi	csps	cpups	cspq	cpupq	dbgb1	dbgb2	rss	maxop	p50	p99	tag
69204	0	48	2.4	53443.4	979.7	0.001	0.035	0.772	14.497	23958	64.8	0.346	75	7.7	23.8	0.0	0.079	17537	4197	20m.pg1119_o3_native_lto.cx7_1g
70422	0	154	1.9	54580.2	999.0	0.002	0.027	0.775	14.526	24688	65.2	0.351	74	7.6	23.6	0.0	0.054	17973	4445	20m.pg1214_o3_native_lto.cx7_1g
70922	0	113	1.4	55529.8	1021.1	0.002	0.020	0.783	14.744	24839	65.3	0.350	74	7.6	23.9	0.0	0.085	18128	5597	20m.pg1310_o3_native_lto.cx7_1g
70671	0	110	0.7	54263.7	1008.3	0.002	0.010	0.768	14.609	24853	65.8	0.352	74	7.6	24.0	0.0	0.072	18052	6192	20m.pg147_o3_native_lto.cx7_1g
70175	0	110	0.7	54128.1	1008.8	0.002	0.010	0.771	14.720	25506	65.8	0.363	75	7.6	24.0	0.0	0.054	17889	5444	20m.pg151_o3_native_lto.cx7_1g
70175	0	116	0.7	54813.2	1010.9	0.002	0.011	0.781	14.751	25585	65.7	0.365	75	7.6	23.9	0.0	0.075	17930	5643	20m.pg152_o3_native_lto.cx7_1g
q100.1
q100.1: range queries with 100 insert/s per client. Graphs for performance per 1-second interval are here.
Average throughput:
Query response time histogram: each cell has the percentage of responses that take <= the time in the header and max is the max response time in seconds. For max values in the top 25% of the range have a red background and in the bottom 25% of the range have a green background. The red background is not used when the min value is within 80% of the max value.
| dbms | 256us | 1ms | 4ms | 16ms | 64ms | 256ms | 1s | 4s | 16s | gt | max |
|---|---|---|---|---|---|---|---|---|---|---|---|
| pg1119_o3_native_lto.cx7_1g | 99.974 | 0.020 | 0.006 | nonzero | 0.011 | ||||||
| pg1214_o3_native_lto.cx7_1g | 99.983 | 0.011 | 0.006 | nonzero | 0.009 | ||||||
| pg1310_o3_native_lto.cx7_1g | 99.983 | 0.012 | 0.005 | nonzero | 0.013 | ||||||
| pg147_o3_native_lto.cx7_1g | 99.982 | 0.012 | 0.006 | nonzero | 0.011 | ||||||
| pg151_o3_native_lto.cx7_1g | 99.984 | 0.011 | 0.004 | nonzero | 0.010 | ||||||
| pg152_o3_native_lto.cx7_1g | 99.983 | 0.011 | 0.005 | nonzero | 0.010 |
Insert response time histogram: each cell has the percentage of responses that take <= the time in the header and max is the max response time in seconds. For max values in the top 25% of the range have a red background and in the bottom 25% of the range have a green background. The red background is not used when the min value is within 80% of the max value.
| dbms | 256us | 1ms | 4ms | 16ms | 64ms | 256ms | 1s | 4s | 16s | gt | max |
|---|---|---|---|---|---|---|---|---|---|---|---|
| pg1119_o3_native_lto.cx7_1g | 99.736 | 0.264 | 0.011 | ||||||||
| pg1214_o3_native_lto.cx7_1g | 99.646 | 0.354 | 0.011 | ||||||||
| pg1310_o3_native_lto.cx7_1g | 99.868 | 0.132 | 0.008 | ||||||||
| pg147_o3_native_lto.cx7_1g | 99.132 | 0.868 | 0.011 | ||||||||
| pg151_o3_native_lto.cx7_1g | 99.521 | 0.479 | 0.011 | ||||||||
| pg152_o3_native_lto.cx7_1g | 99.229 | 0.771 | 0.011 |
Performance metrics for the DBMS listed above. Some are normalized by throughput, others are not. Legend for results is here.
ips	qps	rps	rmbps	wps	wmbps	rpq	rkbpq	wpi	wkbpi	csps	cpups	cspq	cpupq	dbgb1	dbgb2	rss	maxop	p50	p99	tag
399	41058	1	0.0	1292.6	15.3	0.000	0.000	3.241	39.215	156741	50.4	3.818	98	7.9	20.3	0.0	0.011	10360	8647	20m.pg1119_o3_native_lto.cx7_1g
399	46289	0	0.0	1269.7	15.7	0.000	0.000	3.184	40.392	176639	50.5	3.816	87	7.7	20.1	0.0	0.009	11622	10485	20m.pg1214_o3_native_lto.cx7_1g
399	47154	12	0.1	1322.5	15.8	0.000	0.002	3.318	40.484	180022	50.5	3.818	86	7.8	20.0	0.0	0.013	11742	10648	20m.pg1310_o3_native_lto.cx7_1g
399	46376	16	0.1	1291.8	15.5	0.000	0.002	3.239	39.747	176841	50.5	3.813	87	7.8	23.2	0.0	0.011	11688	10277	20m.pg147_o3_native_lto.cx7_1g
399	47184	9	0.1	1308.4	15.6	0.000	0.001	3.281	40.046	179933	50.5	3.813	86	7.8	23.1	0.0	0.010	11728	10548	20m.pg151_o3_native_lto.cx7_1g
399	47035	10	0.1	1313.3	15.7	0.000	0.001	3.293	40.251	179317	50.5	3.812	86	7.8	23.2	0.0	0.010	11752	10628	20m.pg152_o3_native_lto.cx7_1g
q500.1
q500.1: range queries with 500 insert/s per client. Graphs for performance per 1-second interval are here.
Average throughput:
Query response time histogram: each cell has the percentage of responses that take <= the time in the header and max is the max response time in seconds. For max values in the top 25% of the range have a red background and in the bottom 25% of the range have a green background. The red background is not used when the min value is within 80% of the max value.
| dbms | 256us | 1ms | 4ms | 16ms | 64ms | 256ms | 1s | 4s | 16s | gt | max |
|---|---|---|---|---|---|---|---|---|---|---|---|
| pg1119_o3_native_lto.cx7_1g | 99.943 | 0.038 | 0.017 | 0.002 | nonzero | 0.035 | |||||
| pg1214_o3_native_lto.cx7_1g | 99.951 | 0.031 | 0.017 | 0.002 | nonzero | 0.022 | |||||
| pg1310_o3_native_lto.cx7_1g | 99.954 | 0.027 | 0.017 | 0.002 | nonzero | 0.021 | |||||
| pg147_o3_native_lto.cx7_1g | 99.945 | 0.034 | 0.018 | 0.002 | nonzero | 0.047 | |||||
| pg151_o3_native_lto.cx7_1g | 99.951 | 0.030 | 0.017 | 0.002 | nonzero | 0.019 | |||||
| pg152_o3_native_lto.cx7_1g | 99.948 | 0.033 | 0.018 | 0.001 | nonzero | 0.020 |
Insert response time histogram: each cell has the percentage of responses that take <= the time in the header and max is the max response time in seconds. For max values in the top 25% of the range have a red background and in the bottom 25% of the range have a green background. The red background is not used when the min value is within 80% of the max value.
| dbms | 256us | 1ms | 4ms | 16ms | 64ms | 256ms | 1s | 4s | 16s | gt | max |
|---|---|---|---|---|---|---|---|---|---|---|---|
| pg1119_o3_native_lto.cx7_1g | 95.710 | 4.225 | 0.065 | 0.025 | |||||||
| pg1214_o3_native_lto.cx7_1g | 96.304 | 3.597 | 0.099 | 0.025 | |||||||
| pg1310_o3_native_lto.cx7_1g | 94.178 | 5.682 | 0.140 | 0.033 | |||||||
| pg147_o3_native_lto.cx7_1g | 95.296 | 4.639 | 0.065 | 0.025 | |||||||
| pg151_o3_native_lto.cx7_1g | 95.301 | 4.624 | 0.075 | 0.023 | |||||||
| pg152_o3_native_lto.cx7_1g | 97.893 | 2.083 | 0.024 | 0.022 |
Performance metrics for the DBMS listed above. Some are normalized by throughput, others are not. Legend for results is here.
ips	qps	rps	rmbps	wps	wmbps	rpq	rkbpq	wpi	wkbpi	csps	cpups	cspq	cpupq	dbgb1	dbgb2	rss	maxop	p50	p99	tag
1994	41410	19	0.6	5983.7	59.3	0.000	0.014	3.000	30.436	156706	51.9	3.784	100	9.4	18.5	0.1	0.035	10520	8822	20m.pg1119_o3_native_lto.cx7_1g
1994	44769	31	0.7	5973.8	59.3	0.001	0.015	2.995	30.464	169479	51.9	3.786	93	9.3	18.5	0.0	0.022	11284	9877	20m.pg1214_o3_native_lto.cx7_1g
1993	45410	20	0.4	5995.8	59.4	0.000	0.008	3.008	30.518	171899	52.0	3.786	92	9.4	18.4	0.0	0.021	11304	10149	20m.pg1310_o3_native_lto.cx7_1g
1994	44798	46	0.3	5993.0	59.4	0.001	0.008	3.005	30.495	169454	52.0	3.783	93	9.4	20.8	0.0	0.047	11334	9302	20m.pg147_o3_native_lto.cx7_1g
1994	45508	44	0.3	5995.6	59.4	0.001	0.007	3.006	30.505	172074	52.0	3.781	91	9.4	20.7	0.0	0.019	11400	9321	20m.pg151_o3_native_lto.cx7_1g
1994	45155	55	0.4	5994.7	59.4	0.001	0.009	3.006	30.508	170838	52.0	3.783	92	9.4	20.7	0.0	0.020	11380	9526	20m.pg152_o3_native_lto.cx7_1g
q1000.1
q1000.1: range queries with 1000 insert/s per client. Graphs for performance per 1-second interval are here.
Average throughput:
Query response time histogram: each cell has the percentage of responses that take <= the time in the header and max is the max response time in seconds. For max values in the top 25% of the range have a red background and in the bottom 25% of the range have a green background. The red background is not used when the min value is within 80% of the max value.
| dbms | 256us | 1ms | 4ms | 16ms | 64ms | 256ms | 1s | 4s | 16s | gt | max |
|---|---|---|---|---|---|---|---|---|---|---|---|
| pg1119_o3_native_lto.cx7_1g | 99.881 | 0.089 | 0.027 | 0.003 | nonzero | nonzero | 0.090 | ||||
| pg1214_o3_native_lto.cx7_1g | 99.909 | 0.064 | 0.024 | 0.003 | nonzero | 0.063 | |||||
| pg1310_o3_native_lto.cx7_1g | 99.904 | 0.069 | 0.025 | 0.002 | nonzero | 0.020 | |||||
| pg147_o3_native_lto.cx7_1g | 99.876 | 0.091 | 0.029 | 0.003 | nonzero | 0.063 | |||||
| pg151_o3_native_lto.cx7_1g | 99.893 | 0.078 | 0.027 | 0.002 | nonzero | 0.021 | |||||
| pg152_o3_native_lto.cx7_1g | 99.897 | 0.074 | 0.026 | 0.002 | nonzero | 0.036 |
Insert response time histogram: each cell has the percentage of responses that take <= the time in the header and max is the max response time in seconds. For max values in the top 25% of the range have a red background and in the bottom 25% of the range have a green background. The red background is not used when the min value is within 80% of the max value.
| dbms | 256us | 1ms | 4ms | 16ms | 64ms | 256ms | 1s | 4s | 16s | gt | max |
|---|---|---|---|---|---|---|---|---|---|---|---|
| pg1119_o3_native_lto.cx7_1g | 97.304 | 2.644 | 0.051 | 0.001 | 0.092 | ||||||
| pg1214_o3_native_lto.cx7_1g | 95.362 | 4.557 | 0.080 | 0.001 | 0.088 | ||||||
| pg1310_o3_native_lto.cx7_1g | 97.356 | 2.602 | 0.042 | 0.025 | |||||||
| pg147_o3_native_lto.cx7_1g | 97.078 | 2.875 | 0.047 | 0.001 | 0.072 | ||||||
| pg151_o3_native_lto.cx7_1g | 97.833 | 2.131 | 0.035 | 0.025 | |||||||
| pg152_o3_native_lto.cx7_1g | 97.493 | 2.465 | 0.042 | 0.042 |
Performance metrics for the DBMS listed above. Some are normalized by throughput, others are not. Legend for results is here.
ips	qps	rps	rmbps	wps	wmbps	rpq	rkbpq	wpi	wkbpi	csps	cpups	cspq	cpupq	dbgb1	dbgb2	rss	maxop	p50	p99	tag
3989	39566	67	2.0	11831.7	107.4	0.002	0.051	2.966	27.565	147373	53.9	3.725	109	11.8	19.8	0.0	0.090	9957	8551	20m.pg1119_o3_native_lto.cx7_1g
3989	43384	45	1.2	11857.1	107.6	0.001	0.029	2.973	27.633	161576	54.0	3.724	100	11.9	20.0	0.0	0.063	10820	9529	20m.pg1214_o3_native_lto.cx7_1g
3989	43714	65	1.8	11741.2	107.1	0.001	0.043	2.943	27.496	162995	53.9	3.729	99	11.9	19.9	0.0	0.020	10868	9593	20m.pg1310_o3_native_lto.cx7_1g
3989	42522	81	0.6	11731.0	107.0	0.002	0.015	2.941	27.472	158595	53.8	3.730	101	11.9	22.0	0.0	0.063	10724	8794	20m.pg147_o3_native_lto.cx7_1g
3989	43644	94	0.7	11707.8	107.0	0.002	0.017	2.935	27.458	162785	53.8	3.730	99	11.9	22.0	0.0	0.021	11000	9270	20m.pg151_o3_native_lto.cx7_1g
3989	43029	66	0.5	11789.1	107.3	0.002	0.012	2.955	27.554	160367	53.8	3.727	100	11.9	22.0	0.0	0.036	10852	9238	20m.pg152_o3_native_lto.cx7_1g
l.i0
l.i0: load without secondary indexes
Performance metrics for all DBMS, not just the ones listed above. Some are normalized by throughput, others are not. Legend for results is here.
ips	qps	rps	rmbps	wps	wmbps	rpq	rkbpq	wpi	wkbpi	csps	cpups	cspq	cpupq	dbgb1	dbgb2	rss	maxop	p50	p99	tag
259740	0	0	0.0	502.7	124.4	0.000	0.000	0.002	0.490	26076	70.2	0.100	22	1.9	5.2	0.0	0.012	78915	57436	20m.pg1119_o3_native_lto.cx7_1g
259740	0	0	0.0	573.9	117.0	0.000	0.000	0.002	0.461	25901	70.6	0.100	22	1.9	5.2	0.0	0.012	77216	10688	20m.pg1214_o3_native_lto.cx7_1g
266667	0	0	0.0	492.0	120.6	0.000	0.000	0.002	0.463	26516	69.2	0.099	21	1.9	5.2	0.9	0.012	80912	72043	20m.pg1310_o3_native_lto.cx7_1g
259740	0	0	0.0	477.0	118.5	0.000	0.000	0.002	0.467	26257	70.3	0.101	22	1.9	5.2	1.0	0.011	77416	46849	20m.pg147_o3_native_lto.cx7_1g
263158	0	0	0.0	498.1	120.4	0.000	0.000	0.002	0.469	26166	69.4	0.099	21	1.9	5.2	1.0	0.011	80613	24373	20m.pg151_o3_native_lto.cx7_1g
270270	0	0	0.0	506.9	125.2	0.000	0.000	0.002	0.474	27164	70.7	0.101	21	1.9	5.2	1.0	0.026	82436	11188	20m.pg152_o3_native_lto.cx7_1g
l.x
l.x: create secondary indexes
Performance metrics for all DBMS, not just the ones listed above. Some are normalized by throughput, others are not. Legend for results is here.
ips	qps	rps	rmbps	wps	wmbps	rpq	rkbpq	wpi	wkbpi	csps	cpups	cspq	cpupq	dbgb1	dbgb2	rss	maxop	p50	p99	tag
804000	0	0	0.0	585.5	241.2	0.000	0.000	0.001	0.307	2714	37.3	0.003	4	3.7	8.6	0.0	0.004	NA	NA	20m.pg1119_o3_native_lto.cx7_1g
837500	0	0	0.0	728.7	163.3	0.000	0.000	0.001	0.200	1499	40.2	0.002	4	3.7	8.6	0.0	0.003	NA	NA	20m.pg1214_o3_native_lto.cx7_1g
804000	0	0	0.0	509.0	217.3	0.000	0.000	0.001	0.277	2180	37.2	0.003	4	3.7	8.6	0.0	0.004	NA	NA	20m.pg1310_o3_native_lto.cx7_1g
804000	0	0	0.0	479.0	207.1	0.000	0.000	0.001	0.264	2296	37.0	0.003	4	3.7	8.6	0.0	0.003	NA	NA	20m.pg147_o3_native_lto.cx7_1g
837500	0	0	0.0	552.7	218.8	0.000	0.000	0.001	0.268	2042	40.4	0.002	4	3.7	8.6	0.0	0.004	NA	NA	20m.pg151_o3_native_lto.cx7_1g
873913	0	0	0.0	586.3	235.9	0.000	0.000	0.001	0.276	1909	39.8	0.002	4	3.7	8.6	0.0	0.004	NA	NA	20m.pg152_o3_native_lto.cx7_1g
l.i1
l.i1: continue load after secondary indexes created
Performance metrics for all DBMS, not just the ones listed above. Some are normalized by throughput, others are not. Legend for results is here.
ips	qps	rps	rmbps	wps	wmbps	rpq	rkbpq	wpi	wkbpi	csps	cpups	cspq	cpupq	dbgb1	dbgb2	rss	maxop	p50	p99	tag
69204	0	48	2.4	53443.4	979.7	0.001	0.035	0.772	14.497	23958	64.8	0.346	75	7.7	23.8	0.0	0.079	17537	4197	20m.pg1119_o3_native_lto.cx7_1g
70422	0	154	1.9	54580.2	999.0	0.002	0.027	0.775	14.526	24688	65.2	0.351	74	7.6	23.6	0.0	0.054	17973	4445	20m.pg1214_o3_native_lto.cx7_1g
70922	0	113	1.4	55529.8	1021.1	0.002	0.020	0.783	14.744	24839	65.3	0.350	74	7.6	23.9	0.0	0.085	18128	5597	20m.pg1310_o3_native_lto.cx7_1g
70671	0	110	0.7	54263.7	1008.3	0.002	0.010	0.768	14.609	24853	65.8	0.352	74	7.6	24.0	0.0	0.072	18052	6192	20m.pg147_o3_native_lto.cx7_1g
70175	0	110	0.7	54128.1	1008.8	0.002	0.010	0.771	14.720	25506	65.8	0.363	75	7.6	24.0	0.0	0.054	17889	5444	20m.pg151_o3_native_lto.cx7_1g
70175	0	116	0.7	54813.2	1010.9	0.002	0.011	0.781	14.751	25585	65.7	0.365	75	7.6	23.9	0.0	0.075	17930	5643	20m.pg152_o3_native_lto.cx7_1g
q100.1
q100.1: range queries with 100 insert/s per client
Performance metrics for all DBMS, not just the ones listed above. Some are normalized by throughput, others are not. Legend for results is here.
ips	qps	rps	rmbps	wps	wmbps	rpq	rkbpq	wpi	wkbpi	csps	cpups	cspq	cpupq	dbgb1	dbgb2	rss	maxop	p50	p99	tag
399	41058	1	0.0	1292.6	15.3	0.000	0.000	3.241	39.215	156741	50.4	3.818	98	7.9	20.3	0.0	0.011	10360	8647	20m.pg1119_o3_native_lto.cx7_1g
399	46289	0	0.0	1269.7	15.7	0.000	0.000	3.184	40.392	176639	50.5	3.816	87	7.7	20.1	0.0	0.009	11622	10485	20m.pg1214_o3_native_lto.cx7_1g
399	47154	12	0.1	1322.5	15.8	0.000	0.002	3.318	40.484	180022	50.5	3.818	86	7.8	20.0	0.0	0.013	11742	10648	20m.pg1310_o3_native_lto.cx7_1g
399	46376	16	0.1	1291.8	15.5	0.000	0.002	3.239	39.747	176841	50.5	3.813	87	7.8	23.2	0.0	0.011	11688	10277	20m.pg147_o3_native_lto.cx7_1g
399	47184	9	0.1	1308.4	15.6	0.000	0.001	3.281	40.046	179933	50.5	3.813	86	7.8	23.1	0.0	0.010	11728	10548	20m.pg151_o3_native_lto.cx7_1g
399	47035	10	0.1	1313.3	15.7	0.000	0.001	3.293	40.251	179317	50.5	3.812	86	7.8	23.2	0.0	0.010	11752	10628	20m.pg152_o3_native_lto.cx7_1g
q500.1
q500.1: range queries with 500 insert/s per client
Performance metrics for all DBMS, not just the ones listed above. Some are normalized by throughput, others are not. Legend for results is here.
ips	qps	rps	rmbps	wps	wmbps	rpq	rkbpq	wpi	wkbpi	csps	cpups	cspq	cpupq	dbgb1	dbgb2	rss	maxop	p50	p99	tag
1994	41410	19	0.6	5983.7	59.3	0.000	0.014	3.000	30.436	156706	51.9	3.784	100	9.4	18.5	0.1	0.035	10520	8822	20m.pg1119_o3_native_lto.cx7_1g
1994	44769	31	0.7	5973.8	59.3	0.001	0.015	2.995	30.464	169479	51.9	3.786	93	9.3	18.5	0.0	0.022	11284	9877	20m.pg1214_o3_native_lto.cx7_1g
1993	45410	20	0.4	5995.8	59.4	0.000	0.008	3.008	30.518	171899	52.0	3.786	92	9.4	18.4	0.0	0.021	11304	10149	20m.pg1310_o3_native_lto.cx7_1g
1994	44798	46	0.3	5993.0	59.4	0.001	0.008	3.005	30.495	169454	52.0	3.783	93	9.4	20.8	0.0	0.047	11334	9302	20m.pg147_o3_native_lto.cx7_1g
1994	45508	44	0.3	5995.6	59.4	0.001	0.007	3.006	30.505	172074	52.0	3.781	91	9.4	20.7	0.0	0.019	11400	9321	20m.pg151_o3_native_lto.cx7_1g
1994	45155	55	0.4	5994.7	59.4	0.001	0.009	3.006	30.508	170838	52.0	3.783	92	9.4	20.7	0.0	0.020	11380	9526	20m.pg152_o3_native_lto.cx7_1g
q1000.1
q1000.1: range queries with 1000 insert/s per client
Performance metrics for all DBMS, not just the ones listed above. Some are normalized by throughput, others are not. Legend for results is here.
ips	qps	rps	rmbps	wps	wmbps	rpq	rkbpq	wpi	wkbpi	csps	cpups	cspq	cpupq	dbgb1	dbgb2	rss	maxop	p50	p99	tag
3989	39566	67	2.0	11831.7	107.4	0.002	0.051	2.966	27.565	147373	53.9	3.725	109	11.8	19.8	0.0	0.090	9957	8551	20m.pg1119_o3_native_lto.cx7_1g
3989	43384	45	1.2	11857.1	107.6	0.001	0.029	2.973	27.633	161576	54.0	3.724	100	11.9	20.0	0.0	0.063	10820	9529	20m.pg1214_o3_native_lto.cx7_1g
3989	43714	65	1.8	11741.2	107.1	0.001	0.043	2.943	27.496	162995	53.9	3.729	99	11.9	19.9	0.0	0.020	10868	9593	20m.pg1310_o3_native_lto.cx7_1g
3989	42522	81	0.6	11731.0	107.0	0.002	0.015	2.941	27.472	158595	53.8	3.730	101	11.9	22.0	0.0	0.063	10724	8794	20m.pg147_o3_native_lto.cx7_1g
3989	43644	94	0.7	11707.8	107.0	0.002	0.017	2.935	27.458	162785	53.8	3.730	99	11.9	22.0	0.0	0.021	11000	9270	20m.pg151_o3_native_lto.cx7_1g
3989	43029	66	0.5	11789.1	107.3	0.002	0.012	2.955	27.554	160367	53.8	3.727	100	11.9	22.0	0.0	0.036	10852	9238	20m.pg152_o3_native_lto.cx7_1g
l.i0
- l.i0: load without secondary indexes
- Legend for results is here.
- Each entry lists the percentage of responses that fit in that bucket (slower than max time for previous bucket, faster than min time for next bucket).
Insert response time histogram
256us	1ms	4ms	16ms	64ms	256ms	1s	4s	16s	gt	max	tag
0.000	0.000	99.942	0.057	0.000	0.000	0.000	0.000	0.000	0.000	0.012	pg1119_o3_native_lto.cx7_1g
0.000	0.000	99.948	0.052	0.000	0.000	0.000	0.000	0.000	0.000	0.012	pg1214_o3_native_lto.cx7_1g
0.000	0.000	99.936	0.064	0.000	0.000	0.000	0.000	0.000	0.000	0.012	pg1310_o3_native_lto.cx7_1g
0.000	0.000	99.941	0.059	0.000	0.000	0.000	0.000	0.000	0.000	0.011	pg147_o3_native_lto.cx7_1g
0.000	0.001	99.941	0.058	0.000	0.000	0.000	0.000	0.000	0.000	0.011	pg151_o3_native_lto.cx7_1g
0.000	0.005	99.933	0.062	0.001	0.000	0.000	0.000	0.000	0.000	0.026	pg152_o3_native_lto.cx7_1g
l.x
- l.x: create secondary indexes
- Legend for results is here.
- Each entry lists the percentage of responses that fit in that bucket (slower than max time for previous bucket, faster than min time for next bucket).
TODO - determine whether there is data for create index response time
l.i1
- l.i1: continue load after secondary indexes created
- Legend for results is here.
- Each entry lists the percentage of responses that fit in that bucket (slower than max time for previous bucket, faster than min time for next bucket).
Insert response time histogram
256us	1ms	4ms	16ms	64ms	256ms	1s	4s	16s	gt	max	tag
0.000	0.000	99.004	0.873	0.122	nonzero	0.000	0.000	0.000	0.000	0.079	pg1119_o3_native_lto.cx7_1g
0.000	0.000	99.044	0.836	0.120	0.000	0.000	0.000	0.000	0.000	0.054	pg1214_o3_native_lto.cx7_1g
0.000	0.000	99.078	0.789	0.132	0.001	0.000	0.000	0.000	0.000	0.085	pg1310_o3_native_lto.cx7_1g
0.000	0.000	99.047	0.835	0.117	0.001	0.000	0.000	0.000	0.000	0.072	pg147_o3_native_lto.cx7_1g
0.000	0.000	99.010	0.881	0.109	0.000	0.000	0.000	0.000	0.000	0.054	pg151_o3_native_lto.cx7_1g
0.000	0.000	98.992	0.898	0.109	0.001	0.000	0.000	0.000	0.000	0.075	pg152_o3_native_lto.cx7_1g
q100.1
- q100.1: range queries with 100 insert/s per client
- Legend for results is here.
- Each entry lists the percentage of responses that fit in that bucket (slower than max time for previous bucket, faster than min time for next bucket).
Query response time histogram
256us	1ms	4ms	16ms	64ms	256ms	1s	4s	16s	gt	max	tag
99.974	0.020	0.006	nonzero	0.000	0.000	0.000	0.000	0.000	0.000	0.011	pg1119_o3_native_lto.cx7_1g
99.983	0.011	0.006	nonzero	0.000	0.000	0.000	0.000	0.000	0.000	0.009	pg1214_o3_native_lto.cx7_1g
99.983	0.012	0.005	nonzero	0.000	0.000	0.000	0.000	0.000	0.000	0.013	pg1310_o3_native_lto.cx7_1g
99.982	0.012	0.006	nonzero	0.000	0.000	0.000	0.000	0.000	0.000	0.011	pg147_o3_native_lto.cx7_1g
99.984	0.011	0.004	nonzero	0.000	0.000	0.000	0.000	0.000	0.000	0.010	pg151_o3_native_lto.cx7_1g
99.983	0.011	0.005	nonzero	0.000	0.000	0.000	0.000	0.000	0.000	0.010	pg152_o3_native_lto.cx7_1g
Insert response time histogram
256us	1ms	4ms	16ms	64ms	256ms	1s	4s	16s	gt	max	tag
0.000	0.000	99.736	0.264	0.000	0.000	0.000	0.000	0.000	0.000	0.011	pg1119_o3_native_lto.cx7_1g
0.000	0.000	99.646	0.354	0.000	0.000	0.000	0.000	0.000	0.000	0.011	pg1214_o3_native_lto.cx7_1g
0.000	0.000	99.868	0.132	0.000	0.000	0.000	0.000	0.000	0.000	0.008	pg1310_o3_native_lto.cx7_1g
0.000	0.000	99.132	0.868	0.000	0.000	0.000	0.000	0.000	0.000	0.011	pg147_o3_native_lto.cx7_1g
0.000	0.000	99.521	0.479	0.000	0.000	0.000	0.000	0.000	0.000	0.011	pg151_o3_native_lto.cx7_1g
0.000	0.000	99.229	0.771	0.000	0.000	0.000	0.000	0.000	0.000	0.011	pg152_o3_native_lto.cx7_1g
q500.1
- q500.1: range queries with 500 insert/s per client
- Legend for results is here.
- Each entry lists the percentage of responses that fit in that bucket (slower than max time for previous bucket, faster than min time for next bucket).
Query response time histogram
256us	1ms	4ms	16ms	64ms	256ms	1s	4s	16s	gt	max	tag
99.943	0.038	0.017	0.002	nonzero	0.000	0.000	0.000	0.000	0.000	0.035	pg1119_o3_native_lto.cx7_1g
99.951	0.031	0.017	0.002	nonzero	0.000	0.000	0.000	0.000	0.000	0.022	pg1214_o3_native_lto.cx7_1g
99.954	0.027	0.017	0.002	nonzero	0.000	0.000	0.000	0.000	0.000	0.021	pg1310_o3_native_lto.cx7_1g
99.945	0.034	0.018	0.002	nonzero	0.000	0.000	0.000	0.000	0.000	0.047	pg147_o3_native_lto.cx7_1g
99.951	0.030	0.017	0.002	nonzero	0.000	0.000	0.000	0.000	0.000	0.019	pg151_o3_native_lto.cx7_1g
99.948	0.033	0.018	0.001	nonzero	0.000	0.000	0.000	0.000	0.000	0.020	pg152_o3_native_lto.cx7_1g
Insert response time histogram
256us	1ms	4ms	16ms	64ms	256ms	1s	4s	16s	gt	max	tag
0.000	0.000	95.710	4.225	0.065	0.000	0.000	0.000	0.000	0.000	0.025	pg1119_o3_native_lto.cx7_1g
0.000	0.000	96.304	3.597	0.099	0.000	0.000	0.000	0.000	0.000	0.025	pg1214_o3_native_lto.cx7_1g
0.000	0.000	94.178	5.682	0.140	0.000	0.000	0.000	0.000	0.000	0.033	pg1310_o3_native_lto.cx7_1g
0.000	0.000	95.296	4.639	0.065	0.000	0.000	0.000	0.000	0.000	0.025	pg147_o3_native_lto.cx7_1g
0.000	0.000	95.301	4.624	0.075	0.000	0.000	0.000	0.000	0.000	0.023	pg151_o3_native_lto.cx7_1g
0.000	0.000	97.893	2.083	0.024	0.000	0.000	0.000	0.000	0.000	0.022	pg152_o3_native_lto.cx7_1g
q1000.1
- q1000.1: range queries with 1000 insert/s per client
- Legend for results is here.
- Each entry lists the percentage of responses that fit in that bucket (slower than max time for previous bucket, faster than min time for next bucket).
Query response time histogram
256us	1ms	4ms	16ms	64ms	256ms	1s	4s	16s	gt	max	tag
99.881	0.089	0.027	0.003	nonzero	nonzero	0.000	0.000	0.000	0.000	0.090	pg1119_o3_native_lto.cx7_1g
99.909	0.064	0.024	0.003	nonzero	0.000	0.000	0.000	0.000	0.000	0.063	pg1214_o3_native_lto.cx7_1g
99.904	0.069	0.025	0.002	nonzero	0.000	0.000	0.000	0.000	0.000	0.020	pg1310_o3_native_lto.cx7_1g
99.876	0.091	0.029	0.003	nonzero	0.000	0.000	0.000	0.000	0.000	0.063	pg147_o3_native_lto.cx7_1g
99.893	0.078	0.027	0.002	nonzero	0.000	0.000	0.000	0.000	0.000	0.021	pg151_o3_native_lto.cx7_1g
99.897	0.074	0.026	0.002	nonzero	0.000	0.000	0.000	0.000	0.000	0.036	pg152_o3_native_lto.cx7_1g
Insert response time histogram
256us	1ms	4ms	16ms	64ms	256ms	1s	4s	16s	gt	max	tag
0.000	0.000	97.304	2.644	0.051	0.001	0.000	0.000	0.000	0.000	0.092	pg1119_o3_native_lto.cx7_1g
0.000	0.000	95.362	4.557	0.080	0.001	0.000	0.000	0.000	0.000	0.088	pg1214_o3_native_lto.cx7_1g
0.000	0.000	97.356	2.602	0.042	0.000	0.000	0.000	0.000	0.000	0.025	pg1310_o3_native_lto.cx7_1g
0.000	0.000	97.078	2.875	0.047	0.001	0.000	0.000	0.000	0.000	0.072	pg147_o3_native_lto.cx7_1g
0.000	0.000	97.833	2.131	0.035	0.000	0.000	0.000	0.000	0.000	0.025	pg151_o3_native_lto.cx7_1g
0.000	0.000	97.493	2.465	0.042	0.000	0.000	0.000	0.000	0.000	0.042	pg152_o3_native_lto.cx7_1g