Introduction
This is a report for the insert benchmark with 20M docs and 4 client(s). It is generated by scripts (bash, awk, sed) and Tufte might not be impressed. An overview of the insert benchmark is here and a short update is here. Below, by DBMS, I mean DBMS+version.config. An example is my8020.c10b40 where my means MySQL, 8020 is version 8.0.20 and c10b40 is the name for the configuration file.
The test server has 8 AMD cores, 16G RAM and an NVMe SSD. It is described here as the Beelink. The benchmark was run with 4 clients and there were 1 or 2 connections per client (1 for queries, 1 for inserts). It uses 4 tables, 1 per client. It loads 20M rows without secondary indexes, creates secondary indexes, loads another 20M rows then does 3 read+write tests for one hour each that do queries as fast as possible with 100, 500 and then 1000 writes/second/client concurrent with the queries. The database is cached by the OS but not by the database. Clients and the DBMS share one server. The per-database configs are in the per-database subdirectories here.
The tested DBMS are:
- pg151_def.cx7_1g - Postgres 15.1, the cx7_1g config and the build used: -O2
- pg151_o2_nofp.cx7_1g - Postgres 15.1, the cx7_1g config and the build used: -O2 -no-omit-frame-pointer
- pg151_o3.cx7_1g - Postgres 15.1, the cx7_1g config and the build used: -O3
- pg151_o3_native.cx7_1g - Postgres 15.1, the cx7_1g config and the build used: -O3 -march=native -mtune=native
- pg151_o3_native_lto.cx7_1g - Postgres 15.1, the cx7_1g config and the build used: -O3 -march=native -mtune=native and -flto
Contents
- Summary
- l.i0: load without secondary indexes
- l.x: create secondary indexes
- l.i1: continue load after secondary indexes created
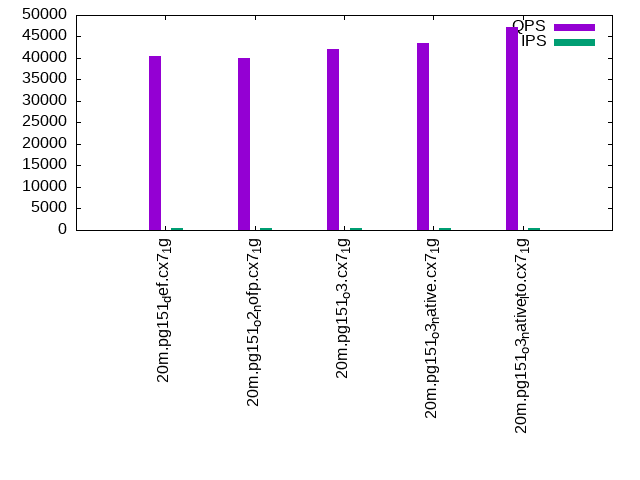
- q100.1: range queries with 100 insert/s per client
- q500.1: range queries with 500 insert/s per client
- q1000.1: range queries with 1000 insert/s per client
Summary
The numbers are inserts/s for l.i0 and l.i1, indexed docs (or rows) /s for l.x and queries/s for q*.2. The values are the average rate over the entire test for inserts (IPS) and queries (QPS). The range of values for IPS and QPS is split into 3 parts: bottom 25%, middle 50%, top 25%. Values in the bottom 25% have a red background, values in the top 25% have a green background and values in the middle have no color. A gray background is used for values that can be ignored because the DBMS did not sustain the target insert rate. Red backgrounds are not used when the minimum value is within 80% of the max value.
| dbms | l.i0 | l.x | l.i1 | q100.1 | q500.1 | q1000.1 |
|---|---|---|---|---|---|---|
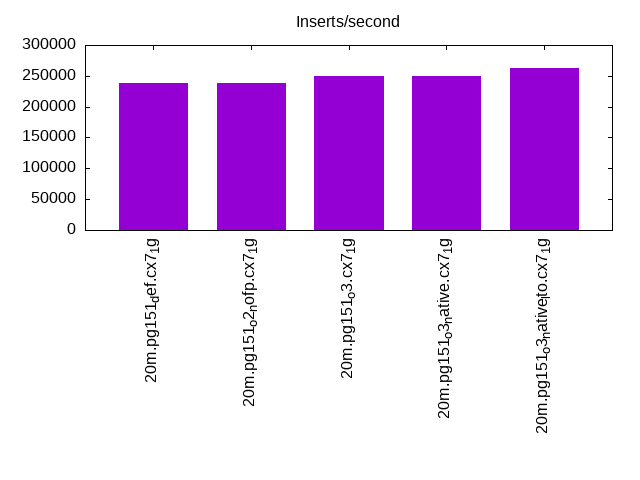
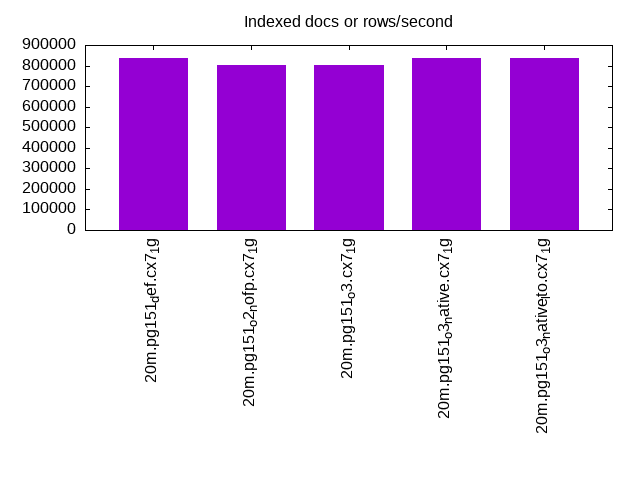
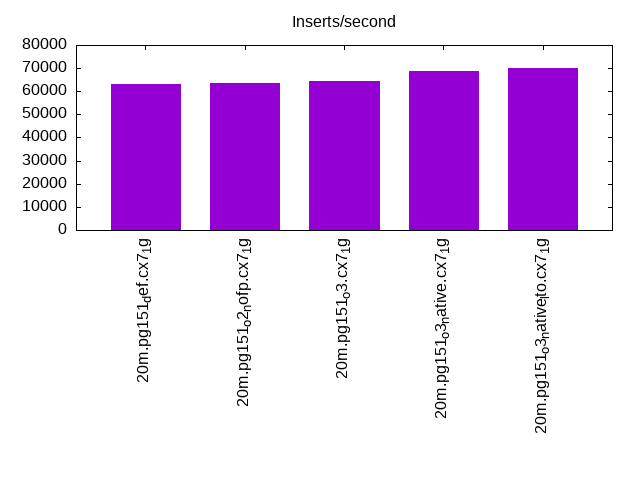
| 20m.pg151_def.cx7_1g | 238095 | 837500 | 63291 | 40427 | 38878 | 37248 |
| 20m.pg151_o2_nofp.cx7_1g | 238095 | 804000 | 63492 | 40003 | 38133 | 36957 |
| 20m.pg151_o3.cx7_1g | 250000 | 804000 | 64309 | 42101 | 40119 | 38758 |
| 20m.pg151_o3_native.cx7_1g | 250000 | 837500 | 68966 | 43494 | 42215 | 40292 |
| 20m.pg151_o3_native_lto.cx7_1g | 263158 | 837500 | 70175 | 47184 | 45508 | 43644 |
This table has relative throughput, throughput for the DBMS relative to the DBMS in the first line, using the absolute throughput from the previous table.
| dbms | l.i0 | l.x | l.i1 | q100.1 | q500.1 | q1000.1 |
|---|---|---|---|---|---|---|
| 20m.pg151_def.cx7_1g | 1.00 | 1.00 | 1.00 | 1.00 | 1.00 | 1.00 |
| 20m.pg151_o2_nofp.cx7_1g | 1.00 | 0.96 | 1.00 | 0.99 | 0.98 | 0.99 |
| 20m.pg151_o3.cx7_1g | 1.05 | 0.96 | 1.02 | 1.04 | 1.03 | 1.04 |
| 20m.pg151_o3_native.cx7_1g | 1.05 | 1.00 | 1.09 | 1.08 | 1.09 | 1.08 |
| 20m.pg151_o3_native_lto.cx7_1g | 1.11 | 1.00 | 1.11 | 1.17 | 1.17 | 1.17 |
This lists the average rate of inserts/s for the tests that do inserts concurrent with queries. For such tests the query rate is listed in the table above. The read+write tests are setup so that the insert rate should match the target rate every second. Cells that are not at least 95% of the target have a red background to indicate a failure to satisfy the target.
| dbms | q100.1 | q500.1 | q1000.1 |
|---|---|---|---|
| pg151_def.cx7_1g | 399 | 1994 | 3987 |
| pg151_o2_nofp.cx7_1g | 399 | 1994 | 3989 |
| pg151_o3.cx7_1g | 399 | 1994 | 3989 |
| pg151_o3_native.cx7_1g | 399 | 1993 | 3989 |
| pg151_o3_native_lto.cx7_1g | 399 | 1994 | 3989 |
| target | 400 | 2000 | 4000 |
l.i0
l.i0: load without secondary indexes. Graphs for performance per 1-second interval are here.
Average throughput:
Insert response time histogram: each cell has the percentage of responses that take <= the time in the header and max is the max response time in seconds. For the max column values in the top 25% of the range have a red background and in the bottom 25% of the range have a green background. The red background is not used when the min value is within 80% of the max value.
| dbms | 256us | 1ms | 4ms | 16ms | 64ms | 256ms | 1s | 4s | 16s | gt | max |
|---|---|---|---|---|---|---|---|---|---|---|---|
| pg151_def.cx7_1g | 99.942 | 0.058 | 0.014 | ||||||||
| pg151_o2_nofp.cx7_1g | 99.942 | 0.059 | 0.011 | ||||||||
| pg151_o3.cx7_1g | 99.944 | 0.056 | 0.011 | ||||||||
| pg151_o3_native.cx7_1g | 99.937 | 0.062 | 0.001 | 0.021 | |||||||
| pg151_o3_native_lto.cx7_1g | 0.001 | 99.941 | 0.058 | 0.011 |
Performance metrics for the DBMS listed above. Some are normalized by throughput, others are not. Legend for results is here.
ips	qps	rps	rmbps	wps	wmbps	rpq	rkbpq	wpi	wkbpi	csps	cpups	cspq	cpupq	dbgb1	dbgb2	rss	maxop	p50	p99	tag
238095	0	0	0.0	450.6	118.8	0.000	0.000	0.002	0.511	24068	71.6	0.101	24	1.9	5.2	1.0	0.014	70224	32563	20m.pg151_def.cx7_1g
238095	0	0	0.0	455.1	119.5	0.000	0.000	0.002	0.514	24197	71.7	0.102	24	1.9	5.2	1.0	0.011	70124	22575	20m.pg151_o2_nofp.cx7_1g
250000	0	0	0.0	477.4	123.8	0.000	0.000	0.002	0.507	24969	69.9	0.100	22	1.9	5.2	1.0	0.011	74319	36860	20m.pg151_o3.cx7_1g
250000	0	0	0.0	477.4	124.0	0.000	0.000	0.002	0.508	24796	69.8	0.099	22	1.9	5.2	1.0	0.021	74320	24274	20m.pg151_o3_native.cx7_1g
263158	0	0	0.0	498.1	120.4	0.000	0.000	0.002	0.469	26166	69.4	0.099	21	1.9	5.2	1.0	0.011	80613	24373	20m.pg151_o3_native_lto.cx7_1g
l.x
l.x: create secondary indexes.
Average throughput:
Performance metrics for the DBMS listed above. Some are normalized by throughput, others are not. Legend for results is here.
ips	qps	rps	rmbps	wps	wmbps	rpq	rkbpq	wpi	wkbpi	csps	cpups	cspq	cpupq	dbgb1	dbgb2	rss	maxop	p50	p99	tag
837500	0	0	0.0	388.8	157.6	0.000	0.000	0.000	0.193	1491	40.8	0.002	4	3.7	8.6	0.0	0.004	NA	NA	20m.pg151_def.cx7_1g
804000	0	0	0.0	501.6	221.7	0.000	0.000	0.001	0.282	2364	39.2	0.003	4	3.7	8.6	0.0	0.004	NA	NA	20m.pg151_o2_nofp.cx7_1g
804000	0	0	0.0	496.3	208.7	0.000	0.000	0.001	0.266	2237	38.8	0.003	4	3.7	8.6	0.0	0.004	NA	NA	20m.pg151_o3.cx7_1g
837500	0	0	0.0	416.1	166.1	0.000	0.000	0.000	0.203	1744	41.0	0.002	4	3.7	8.6	0.0	0.004	NA	NA	20m.pg151_o3_native.cx7_1g
837500	0	0	0.0	552.7	218.8	0.000	0.000	0.001	0.268	2042	40.4	0.002	4	3.7	8.6	0.0	0.004	NA	NA	20m.pg151_o3_native_lto.cx7_1g
l.i1
l.i1: continue load after secondary indexes created. Graphs for performance per 1-second interval are here.
Average throughput:
Insert response time histogram: each cell has the percentage of responses that take <= the time in the header and max is the max response time in seconds. For the max column values in the top 25% of the range have a red background and in the bottom 25% of the range have a green background. The red background is not used when the min value is within 80% of the max value.
| dbms | 256us | 1ms | 4ms | 16ms | 64ms | 256ms | 1s | 4s | 16s | gt | max |
|---|---|---|---|---|---|---|---|---|---|---|---|
| pg151_def.cx7_1g | 98.280 | 1.629 | 0.089 | 0.002 | 0.072 | ||||||
| pg151_o2_nofp.cx7_1g | 98.269 | 1.630 | 0.100 | 0.001 | 0.074 | ||||||
| pg151_o3.cx7_1g | 98.445 | 1.456 | 0.099 | nonzero | 0.069 | ||||||
| pg151_o3_native.cx7_1g | 98.988 | 0.894 | 0.118 | 0.060 | |||||||
| pg151_o3_native_lto.cx7_1g | 99.010 | 0.881 | 0.109 | 0.054 |
Performance metrics for the DBMS listed above. Some are normalized by throughput, others are not. Legend for results is here.
ips	qps	rps	rmbps	wps	wmbps	rpq	rkbpq	wpi	wkbpi	csps	cpups	cspq	cpupq	dbgb1	dbgb2	rss	maxop	p50	p99	tag
63291	0	100	0.6	53196.2	921.9	0.002	0.010	0.841	14.916	21193	64.5	0.335	82	7.6	23.8	0.1	0.072	16041	5194	20m.pg151_def.cx7_1g
63492	0	106	0.7	52186.2	915.1	0.002	0.011	0.822	14.760	21234	64.4	0.334	81	7.6	23.8	0.1	0.074	16131	5094	20m.pg151_o2_nofp.cx7_1g
64309	0	70	0.4	52705.7	928.6	0.001	0.007	0.820	14.786	21941	65.5	0.341	81	7.6	23.9	0.0	0.069	16282	6343	20m.pg151_o3.cx7_1g
68966	0	89	0.5	53284.6	985.2	0.001	0.008	0.773	14.629	24154	66.0	0.350	77	7.6	24.0	0.0	0.060	17581	5145	20m.pg151_o3_native.cx7_1g
70175	0	110	0.7	54128.1	1008.8	0.002	0.010	0.771	14.720	25506	65.8	0.363	75	7.6	24.0	0.0	0.054	17889	5444	20m.pg151_o3_native_lto.cx7_1g
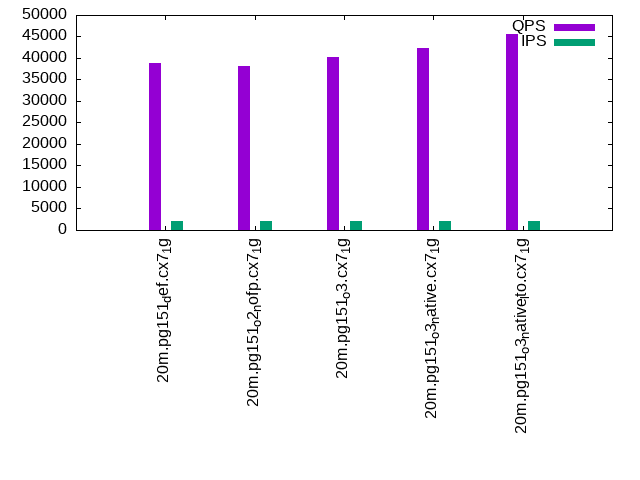
q100.1
q100.1: range queries with 100 insert/s per client. Graphs for performance per 1-second interval are here.
Average throughput:
Query response time histogram: each cell has the percentage of responses that take <= the time in the header and max is the max response time in seconds. For max values in the top 25% of the range have a red background and in the bottom 25% of the range have a green background. The red background is not used when the min value is within 80% of the max value.
| dbms | 256us | 1ms | 4ms | 16ms | 64ms | 256ms | 1s | 4s | 16s | gt | max |
|---|---|---|---|---|---|---|---|---|---|---|---|
| pg151_def.cx7_1g | 99.975 | 0.018 | 0.007 | nonzero | 0.008 | ||||||
| pg151_o2_nofp.cx7_1g | 99.973 | 0.020 | 0.007 | nonzero | 0.008 | ||||||
| pg151_o3.cx7_1g | 99.978 | 0.016 | 0.006 | nonzero | 0.010 | ||||||
| pg151_o3_native.cx7_1g | 99.981 | 0.013 | 0.005 | nonzero | 0.009 | ||||||
| pg151_o3_native_lto.cx7_1g | 99.984 | 0.011 | 0.004 | nonzero | 0.010 |
Insert response time histogram: each cell has the percentage of responses that take <= the time in the header and max is the max response time in seconds. For max values in the top 25% of the range have a red background and in the bottom 25% of the range have a green background. The red background is not used when the min value is within 80% of the max value.
| dbms | 256us | 1ms | 4ms | 16ms | 64ms | 256ms | 1s | 4s | 16s | gt | max |
|---|---|---|---|---|---|---|---|---|---|---|---|
| pg151_def.cx7_1g | 99.306 | 0.694 | 0.012 | ||||||||
| pg151_o2_nofp.cx7_1g | 99.271 | 0.729 | 0.012 | ||||||||
| pg151_o3.cx7_1g | 99.396 | 0.604 | 0.012 | ||||||||
| pg151_o3_native.cx7_1g | 99.368 | 0.632 | 0.013 | ||||||||
| pg151_o3_native_lto.cx7_1g | 99.521 | 0.479 | 0.011 |
Performance metrics for the DBMS listed above. Some are normalized by throughput, others are not. Legend for results is here.
ips	qps	rps	rmbps	wps	wmbps	rpq	rkbpq	wpi	wkbpi	csps	cpups	cspq	cpupq	dbgb1	dbgb2	rss	maxop	p50	p99	tag
399	40427	8	0.1	1317.0	15.9	0.000	0.001	3.304	40.886	154258	50.5	3.816	100	7.8	22.3	0.0	0.008	10181	8215	20m.pg151_def.cx7_1g
399	40003	8	0.1	1323.0	16.0	0.000	0.001	3.317	40.999	152562	50.4	3.814	101	7.8	22.3	0.0	0.008	10181	8490	20m.pg151_o2_nofp.cx7_1g
399	42101	13	0.1	1312.4	15.9	0.000	0.002	3.293	40.871	160639	50.5	3.816	96	7.8	22.5	0.0	0.010	10644	9030	20m.pg151_o3.cx7_1g
399	43494	13	0.1	1300.0	15.5	0.000	0.002	3.260	39.895	165872	50.5	3.814	93	7.8	22.9	0.0	0.009	11044	9270	20m.pg151_o3_native.cx7_1g
399	47184	9	0.1	1308.4	15.6	0.000	0.001	3.281	40.046	179933	50.5	3.813	86	7.8	23.1	0.0	0.010	11728	10548	20m.pg151_o3_native_lto.cx7_1g
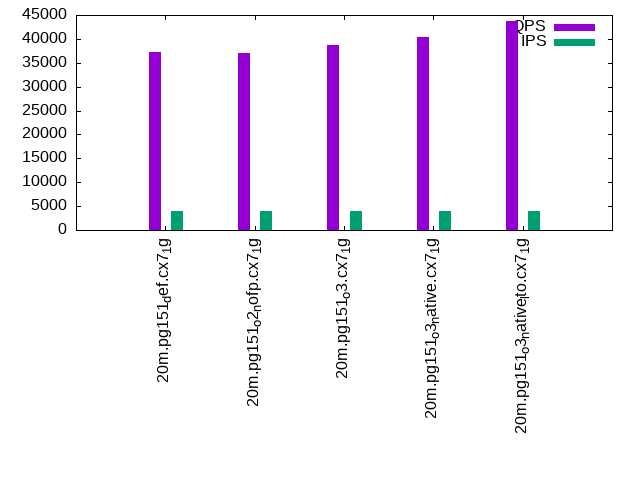
q500.1
q500.1: range queries with 500 insert/s per client. Graphs for performance per 1-second interval are here.
Average throughput:
Query response time histogram: each cell has the percentage of responses that take <= the time in the header and max is the max response time in seconds. For max values in the top 25% of the range have a red background and in the bottom 25% of the range have a green background. The red background is not used when the min value is within 80% of the max value.
| dbms | 256us | 1ms | 4ms | 16ms | 64ms | 256ms | 1s | 4s | 16s | gt | max |
|---|---|---|---|---|---|---|---|---|---|---|---|
| pg151_def.cx7_1g | 99.926 | 0.051 | 0.020 | 0.002 | nonzero | 0.021 | |||||
| pg151_o2_nofp.cx7_1g | 99.922 | 0.055 | 0.020 | 0.002 | nonzero | 0.019 | |||||
| pg151_o3.cx7_1g | 99.932 | 0.047 | 0.019 | 0.002 | nonzero | 0.017 | |||||
| pg151_o3_native.cx7_1g | 99.942 | 0.039 | 0.018 | 0.002 | nonzero | 0.019 | |||||
| pg151_o3_native_lto.cx7_1g | 99.951 | 0.030 | 0.017 | 0.002 | nonzero | 0.019 |
Insert response time histogram: each cell has the percentage of responses that take <= the time in the header and max is the max response time in seconds. For max values in the top 25% of the range have a red background and in the bottom 25% of the range have a green background. The red background is not used when the min value is within 80% of the max value.
| dbms | 256us | 1ms | 4ms | 16ms | 64ms | 256ms | 1s | 4s | 16s | gt | max |
|---|---|---|---|---|---|---|---|---|---|---|---|
| pg151_def.cx7_1g | 93.578 | 6.314 | 0.108 | 0.028 | |||||||
| pg151_o2_nofp.cx7_1g | 95.107 | 4.835 | 0.058 | 0.027 | |||||||
| pg151_o3.cx7_1g | 95.250 | 4.700 | 0.050 | 0.024 | |||||||
| pg151_o3_native.cx7_1g | 95.724 | 4.217 | 0.060 | 0.025 | |||||||
| pg151_o3_native_lto.cx7_1g | 95.301 | 4.624 | 0.075 | 0.023 |
Performance metrics for the DBMS listed above. Some are normalized by throughput, others are not. Legend for results is here.
ips	qps	rps	rmbps	wps	wmbps	rpq	rkbpq	wpi	wkbpi	csps	cpups	cspq	cpupq	dbgb1	dbgb2	rss	maxop	p50	p99	tag
1994	38878	62	0.5	5962.7	59.2	0.002	0.012	2.990	30.384	146674	52.0	3.773	107	9.4	20.2	0.0	0.021	9814	8135	20m.pg151_def.cx7_1g
1994	38133	62	0.5	5958.3	59.1	0.002	0.013	2.988	30.368	143838	52.1	3.772	109	9.4	20.2	0.0	0.019	9653	7752	20m.pg151_o2_nofp.cx7_1g
1994	40119	61	0.5	5968.9	59.2	0.002	0.012	2.993	30.415	151459	52.1	3.775	104	9.4	20.3	0.0	0.017	10149	8279	20m.pg151_o3.cx7_1g
1993	42215	62	0.5	5980.8	59.3	0.001	0.012	3.000	30.479	159697	52.0	3.783	99	9.4	20.5	0.0	0.019	10648	8679	20m.pg151_o3_native.cx7_1g
1994	45508	44	0.3	5995.6	59.4	0.001	0.007	3.006	30.505	172074	52.0	3.781	91	9.4	20.7	0.0	0.019	11400	9321	20m.pg151_o3_native_lto.cx7_1g
q1000.1
q1000.1: range queries with 1000 insert/s per client. Graphs for performance per 1-second interval are here.
Average throughput:
Query response time histogram: each cell has the percentage of responses that take <= the time in the header and max is the max response time in seconds. For max values in the top 25% of the range have a red background and in the bottom 25% of the range have a green background. The red background is not used when the min value is within 80% of the max value.
| dbms | 256us | 1ms | 4ms | 16ms | 64ms | 256ms | 1s | 4s | 16s | gt | max |
|---|---|---|---|---|---|---|---|---|---|---|---|
| pg151_def.cx7_1g | 99.849 | 0.119 | 0.028 | 0.003 | nonzero | 0.021 | |||||
| pg151_o2_nofp.cx7_1g | 99.840 | 0.127 | 0.029 | 0.003 | nonzero | 0.022 | |||||
| pg151_o3.cx7_1g | 99.863 | 0.106 | 0.028 | 0.003 | nonzero | nonzero | 0.086 | ||||
| pg151_o3_native.cx7_1g | 99.879 | 0.092 | 0.027 | 0.003 | nonzero | 0.021 | |||||
| pg151_o3_native_lto.cx7_1g | 99.893 | 0.078 | 0.027 | 0.002 | nonzero | 0.021 |
Insert response time histogram: each cell has the percentage of responses that take <= the time in the header and max is the max response time in seconds. For max values in the top 25% of the range have a red background and in the bottom 25% of the range have a green background. The red background is not used when the min value is within 80% of the max value.
| dbms | 256us | 1ms | 4ms | 16ms | 64ms | 256ms | 1s | 4s | 16s | gt | max |
|---|---|---|---|---|---|---|---|---|---|---|---|
| pg151_def.cx7_1g | 94.460 | 5.451 | 0.089 | 0.060 | |||||||
| pg151_o2_nofp.cx7_1g | 94.614 | 5.310 | 0.076 | 0.030 | |||||||
| pg151_o3.cx7_1g | 95.106 | 4.804 | 0.088 | 0.003 | 0.091 | ||||||
| pg151_o3_native.cx7_1g | 96.822 | 3.140 | 0.038 | 0.026 | |||||||
| pg151_o3_native_lto.cx7_1g | 97.833 | 2.131 | 0.035 | 0.025 |
Performance metrics for the DBMS listed above. Some are normalized by throughput, others are not. Legend for results is here.
ips	qps	rps	rmbps	wps	wmbps	rpq	rkbpq	wpi	wkbpi	csps	cpups	cspq	cpupq	dbgb1	dbgb2	rss	maxop	p50	p99	tag
3987	37248	66	0.5	11854.2	107.6	0.002	0.014	2.973	27.625	137809	54.2	3.700	116	11.9	21.7	0.0	0.021	9385	7834	20m.pg151_def.cx7_1g
3989	36957	66	0.5	11849.3	107.5	0.002	0.014	2.971	27.600	136649	54.3	3.698	118	11.9	21.7	0.0	0.022	9257	7607	20m.pg151_o2_nofp.cx7_1g
3989	38758	66	0.5	11839.8	107.5	0.002	0.013	2.968	27.595	143586	54.2	3.705	112	11.9	21.8	0.0	0.086	9737	8106	20m.pg151_o3.cx7_1g
3989	40292	66	0.5	11801.9	107.3	0.002	0.013	2.959	27.546	149921	53.9	3.721	107	11.9	21.9	0.0	0.021	10101	8266	20m.pg151_o3_native.cx7_1g
3989	43644	94	0.7	11707.8	107.0	0.002	0.017	2.935	27.458	162785	53.8	3.730	99	11.9	22.0	0.0	0.021	11000	9270	20m.pg151_o3_native_lto.cx7_1g
l.i0
l.i0: load without secondary indexes
Performance metrics for all DBMS, not just the ones listed above. Some are normalized by throughput, others are not. Legend for results is here.
ips	qps	rps	rmbps	wps	wmbps	rpq	rkbpq	wpi	wkbpi	csps	cpups	cspq	cpupq	dbgb1	dbgb2	rss	maxop	p50	p99	tag
238095	0	0	0.0	450.6	118.8	0.000	0.000	0.002	0.511	24068	71.6	0.101	24	1.9	5.2	1.0	0.014	70224	32563	20m.pg151_def.cx7_1g
238095	0	0	0.0	455.1	119.5	0.000	0.000	0.002	0.514	24197	71.7	0.102	24	1.9	5.2	1.0	0.011	70124	22575	20m.pg151_o2_nofp.cx7_1g
250000	0	0	0.0	477.4	123.8	0.000	0.000	0.002	0.507	24969	69.9	0.100	22	1.9	5.2	1.0	0.011	74319	36860	20m.pg151_o3.cx7_1g
250000	0	0	0.0	477.4	124.0	0.000	0.000	0.002	0.508	24796	69.8	0.099	22	1.9	5.2	1.0	0.021	74320	24274	20m.pg151_o3_native.cx7_1g
263158	0	0	0.0	498.1	120.4	0.000	0.000	0.002	0.469	26166	69.4	0.099	21	1.9	5.2	1.0	0.011	80613	24373	20m.pg151_o3_native_lto.cx7_1g
l.x
l.x: create secondary indexes
Performance metrics for all DBMS, not just the ones listed above. Some are normalized by throughput, others are not. Legend for results is here.
ips	qps	rps	rmbps	wps	wmbps	rpq	rkbpq	wpi	wkbpi	csps	cpups	cspq	cpupq	dbgb1	dbgb2	rss	maxop	p50	p99	tag
837500	0	0	0.0	388.8	157.6	0.000	0.000	0.000	0.193	1491	40.8	0.002	4	3.7	8.6	0.0	0.004	NA	NA	20m.pg151_def.cx7_1g
804000	0	0	0.0	501.6	221.7	0.000	0.000	0.001	0.282	2364	39.2	0.003	4	3.7	8.6	0.0	0.004	NA	NA	20m.pg151_o2_nofp.cx7_1g
804000	0	0	0.0	496.3	208.7	0.000	0.000	0.001	0.266	2237	38.8	0.003	4	3.7	8.6	0.0	0.004	NA	NA	20m.pg151_o3.cx7_1g
837500	0	0	0.0	416.1	166.1	0.000	0.000	0.000	0.203	1744	41.0	0.002	4	3.7	8.6	0.0	0.004	NA	NA	20m.pg151_o3_native.cx7_1g
837500	0	0	0.0	552.7	218.8	0.000	0.000	0.001	0.268	2042	40.4	0.002	4	3.7	8.6	0.0	0.004	NA	NA	20m.pg151_o3_native_lto.cx7_1g
l.i1
l.i1: continue load after secondary indexes created
Performance metrics for all DBMS, not just the ones listed above. Some are normalized by throughput, others are not. Legend for results is here.
ips	qps	rps	rmbps	wps	wmbps	rpq	rkbpq	wpi	wkbpi	csps	cpups	cspq	cpupq	dbgb1	dbgb2	rss	maxop	p50	p99	tag
63291	0	100	0.6	53196.2	921.9	0.002	0.010	0.841	14.916	21193	64.5	0.335	82	7.6	23.8	0.1	0.072	16041	5194	20m.pg151_def.cx7_1g
63492	0	106	0.7	52186.2	915.1	0.002	0.011	0.822	14.760	21234	64.4	0.334	81	7.6	23.8	0.1	0.074	16131	5094	20m.pg151_o2_nofp.cx7_1g
64309	0	70	0.4	52705.7	928.6	0.001	0.007	0.820	14.786	21941	65.5	0.341	81	7.6	23.9	0.0	0.069	16282	6343	20m.pg151_o3.cx7_1g
68966	0	89	0.5	53284.6	985.2	0.001	0.008	0.773	14.629	24154	66.0	0.350	77	7.6	24.0	0.0	0.060	17581	5145	20m.pg151_o3_native.cx7_1g
70175	0	110	0.7	54128.1	1008.8	0.002	0.010	0.771	14.720	25506	65.8	0.363	75	7.6	24.0	0.0	0.054	17889	5444	20m.pg151_o3_native_lto.cx7_1g
q100.1
q100.1: range queries with 100 insert/s per client
Performance metrics for all DBMS, not just the ones listed above. Some are normalized by throughput, others are not. Legend for results is here.
ips	qps	rps	rmbps	wps	wmbps	rpq	rkbpq	wpi	wkbpi	csps	cpups	cspq	cpupq	dbgb1	dbgb2	rss	maxop	p50	p99	tag
399	40427	8	0.1	1317.0	15.9	0.000	0.001	3.304	40.886	154258	50.5	3.816	100	7.8	22.3	0.0	0.008	10181	8215	20m.pg151_def.cx7_1g
399	40003	8	0.1	1323.0	16.0	0.000	0.001	3.317	40.999	152562	50.4	3.814	101	7.8	22.3	0.0	0.008	10181	8490	20m.pg151_o2_nofp.cx7_1g
399	42101	13	0.1	1312.4	15.9	0.000	0.002	3.293	40.871	160639	50.5	3.816	96	7.8	22.5	0.0	0.010	10644	9030	20m.pg151_o3.cx7_1g
399	43494	13	0.1	1300.0	15.5	0.000	0.002	3.260	39.895	165872	50.5	3.814	93	7.8	22.9	0.0	0.009	11044	9270	20m.pg151_o3_native.cx7_1g
399	47184	9	0.1	1308.4	15.6	0.000	0.001	3.281	40.046	179933	50.5	3.813	86	7.8	23.1	0.0	0.010	11728	10548	20m.pg151_o3_native_lto.cx7_1g
q500.1
q500.1: range queries with 500 insert/s per client
Performance metrics for all DBMS, not just the ones listed above. Some are normalized by throughput, others are not. Legend for results is here.
ips	qps	rps	rmbps	wps	wmbps	rpq	rkbpq	wpi	wkbpi	csps	cpups	cspq	cpupq	dbgb1	dbgb2	rss	maxop	p50	p99	tag
1994	38878	62	0.5	5962.7	59.2	0.002	0.012	2.990	30.384	146674	52.0	3.773	107	9.4	20.2	0.0	0.021	9814	8135	20m.pg151_def.cx7_1g
1994	38133	62	0.5	5958.3	59.1	0.002	0.013	2.988	30.368	143838	52.1	3.772	109	9.4	20.2	0.0	0.019	9653	7752	20m.pg151_o2_nofp.cx7_1g
1994	40119	61	0.5	5968.9	59.2	0.002	0.012	2.993	30.415	151459	52.1	3.775	104	9.4	20.3	0.0	0.017	10149	8279	20m.pg151_o3.cx7_1g
1993	42215	62	0.5	5980.8	59.3	0.001	0.012	3.000	30.479	159697	52.0	3.783	99	9.4	20.5	0.0	0.019	10648	8679	20m.pg151_o3_native.cx7_1g
1994	45508	44	0.3	5995.6	59.4	0.001	0.007	3.006	30.505	172074	52.0	3.781	91	9.4	20.7	0.0	0.019	11400	9321	20m.pg151_o3_native_lto.cx7_1g
q1000.1
q1000.1: range queries with 1000 insert/s per client
Performance metrics for all DBMS, not just the ones listed above. Some are normalized by throughput, others are not. Legend for results is here.
ips	qps	rps	rmbps	wps	wmbps	rpq	rkbpq	wpi	wkbpi	csps	cpups	cspq	cpupq	dbgb1	dbgb2	rss	maxop	p50	p99	tag
3987	37248	66	0.5	11854.2	107.6	0.002	0.014	2.973	27.625	137809	54.2	3.700	116	11.9	21.7	0.0	0.021	9385	7834	20m.pg151_def.cx7_1g
3989	36957	66	0.5	11849.3	107.5	0.002	0.014	2.971	27.600	136649	54.3	3.698	118	11.9	21.7	0.0	0.022	9257	7607	20m.pg151_o2_nofp.cx7_1g
3989	38758	66	0.5	11839.8	107.5	0.002	0.013	2.968	27.595	143586	54.2	3.705	112	11.9	21.8	0.0	0.086	9737	8106	20m.pg151_o3.cx7_1g
3989	40292	66	0.5	11801.9	107.3	0.002	0.013	2.959	27.546	149921	53.9	3.721	107	11.9	21.9	0.0	0.021	10101	8266	20m.pg151_o3_native.cx7_1g
3989	43644	94	0.7	11707.8	107.0	0.002	0.017	2.935	27.458	162785	53.8	3.730	99	11.9	22.0	0.0	0.021	11000	9270	20m.pg151_o3_native_lto.cx7_1g
l.i0
- l.i0: load without secondary indexes
- Legend for results is here.
- Each entry lists the percentage of responses that fit in that bucket (slower than max time for previous bucket, faster than min time for next bucket).
Insert response time histogram
256us	1ms	4ms	16ms	64ms	256ms	1s	4s	16s	gt	max	tag
0.000	0.000	99.942	0.058	0.000	0.000	0.000	0.000	0.000	0.000	0.014	pg151_def.cx7_1g
0.000	0.000	99.942	0.059	0.000	0.000	0.000	0.000	0.000	0.000	0.011	pg151_o2_nofp.cx7_1g
0.000	0.000	99.944	0.056	0.000	0.000	0.000	0.000	0.000	0.000	0.011	pg151_o3.cx7_1g
0.000	0.000	99.937	0.062	0.001	0.000	0.000	0.000	0.000	0.000	0.021	pg151_o3_native.cx7_1g
0.000	0.001	99.941	0.058	0.000	0.000	0.000	0.000	0.000	0.000	0.011	pg151_o3_native_lto.cx7_1g
l.x
- l.x: create secondary indexes
- Legend for results is here.
- Each entry lists the percentage of responses that fit in that bucket (slower than max time for previous bucket, faster than min time for next bucket).
TODO - determine whether there is data for create index response time
l.i1
- l.i1: continue load after secondary indexes created
- Legend for results is here.
- Each entry lists the percentage of responses that fit in that bucket (slower than max time for previous bucket, faster than min time for next bucket).
Insert response time histogram
256us	1ms	4ms	16ms	64ms	256ms	1s	4s	16s	gt	max	tag
0.000	0.000	98.280	1.629	0.089	0.002	0.000	0.000	0.000	0.000	0.072	pg151_def.cx7_1g
0.000	0.000	98.269	1.630	0.100	0.001	0.000	0.000	0.000	0.000	0.074	pg151_o2_nofp.cx7_1g
0.000	0.000	98.445	1.456	0.099	nonzero	0.000	0.000	0.000	0.000	0.069	pg151_o3.cx7_1g
0.000	0.000	98.988	0.894	0.118	0.000	0.000	0.000	0.000	0.000	0.060	pg151_o3_native.cx7_1g
0.000	0.000	99.010	0.881	0.109	0.000	0.000	0.000	0.000	0.000	0.054	pg151_o3_native_lto.cx7_1g
q100.1
- q100.1: range queries with 100 insert/s per client
- Legend for results is here.
- Each entry lists the percentage of responses that fit in that bucket (slower than max time for previous bucket, faster than min time for next bucket).
Query response time histogram
256us	1ms	4ms	16ms	64ms	256ms	1s	4s	16s	gt	max	tag
99.975	0.018	0.007	nonzero	0.000	0.000	0.000	0.000	0.000	0.000	0.008	pg151_def.cx7_1g
99.973	0.020	0.007	nonzero	0.000	0.000	0.000	0.000	0.000	0.000	0.008	pg151_o2_nofp.cx7_1g
99.978	0.016	0.006	nonzero	0.000	0.000	0.000	0.000	0.000	0.000	0.010	pg151_o3.cx7_1g
99.981	0.013	0.005	nonzero	0.000	0.000	0.000	0.000	0.000	0.000	0.009	pg151_o3_native.cx7_1g
99.984	0.011	0.004	nonzero	0.000	0.000	0.000	0.000	0.000	0.000	0.010	pg151_o3_native_lto.cx7_1g
Insert response time histogram
256us	1ms	4ms	16ms	64ms	256ms	1s	4s	16s	gt	max	tag
0.000	0.000	99.306	0.694	0.000	0.000	0.000	0.000	0.000	0.000	0.012	pg151_def.cx7_1g
0.000	0.000	99.271	0.729	0.000	0.000	0.000	0.000	0.000	0.000	0.012	pg151_o2_nofp.cx7_1g
0.000	0.000	99.396	0.604	0.000	0.000	0.000	0.000	0.000	0.000	0.012	pg151_o3.cx7_1g
0.000	0.000	99.368	0.632	0.000	0.000	0.000	0.000	0.000	0.000	0.013	pg151_o3_native.cx7_1g
0.000	0.000	99.521	0.479	0.000	0.000	0.000	0.000	0.000	0.000	0.011	pg151_o3_native_lto.cx7_1g
q500.1
- q500.1: range queries with 500 insert/s per client
- Legend for results is here.
- Each entry lists the percentage of responses that fit in that bucket (slower than max time for previous bucket, faster than min time for next bucket).
Query response time histogram
256us	1ms	4ms	16ms	64ms	256ms	1s	4s	16s	gt	max	tag
99.926	0.051	0.020	0.002	nonzero	0.000	0.000	0.000	0.000	0.000	0.021	pg151_def.cx7_1g
99.922	0.055	0.020	0.002	nonzero	0.000	0.000	0.000	0.000	0.000	0.019	pg151_o2_nofp.cx7_1g
99.932	0.047	0.019	0.002	nonzero	0.000	0.000	0.000	0.000	0.000	0.017	pg151_o3.cx7_1g
99.942	0.039	0.018	0.002	nonzero	0.000	0.000	0.000	0.000	0.000	0.019	pg151_o3_native.cx7_1g
99.951	0.030	0.017	0.002	nonzero	0.000	0.000	0.000	0.000	0.000	0.019	pg151_o3_native_lto.cx7_1g
Insert response time histogram
256us	1ms	4ms	16ms	64ms	256ms	1s	4s	16s	gt	max	tag
0.000	0.000	93.578	6.314	0.108	0.000	0.000	0.000	0.000	0.000	0.028	pg151_def.cx7_1g
0.000	0.000	95.107	4.835	0.058	0.000	0.000	0.000	0.000	0.000	0.027	pg151_o2_nofp.cx7_1g
0.000	0.000	95.250	4.700	0.050	0.000	0.000	0.000	0.000	0.000	0.024	pg151_o3.cx7_1g
0.000	0.000	95.724	4.217	0.060	0.000	0.000	0.000	0.000	0.000	0.025	pg151_o3_native.cx7_1g
0.000	0.000	95.301	4.624	0.075	0.000	0.000	0.000	0.000	0.000	0.023	pg151_o3_native_lto.cx7_1g
q1000.1
- q1000.1: range queries with 1000 insert/s per client
- Legend for results is here.
- Each entry lists the percentage of responses that fit in that bucket (slower than max time for previous bucket, faster than min time for next bucket).
Query response time histogram
256us	1ms	4ms	16ms	64ms	256ms	1s	4s	16s	gt	max	tag
99.849	0.119	0.028	0.003	nonzero	0.000	0.000	0.000	0.000	0.000	0.021	pg151_def.cx7_1g
99.840	0.127	0.029	0.003	nonzero	0.000	0.000	0.000	0.000	0.000	0.022	pg151_o2_nofp.cx7_1g
99.863	0.106	0.028	0.003	nonzero	nonzero	0.000	0.000	0.000	0.000	0.086	pg151_o3.cx7_1g
99.879	0.092	0.027	0.003	nonzero	0.000	0.000	0.000	0.000	0.000	0.021	pg151_o3_native.cx7_1g
99.893	0.078	0.027	0.002	nonzero	0.000	0.000	0.000	0.000	0.000	0.021	pg151_o3_native_lto.cx7_1g
Insert response time histogram
256us	1ms	4ms	16ms	64ms	256ms	1s	4s	16s	gt	max	tag
0.000	0.000	94.460	5.451	0.089	0.000	0.000	0.000	0.000	0.000	0.060	pg151_def.cx7_1g
0.000	0.000	94.614	5.310	0.076	0.000	0.000	0.000	0.000	0.000	0.030	pg151_o2_nofp.cx7_1g
0.000	0.000	95.106	4.804	0.088	0.003	0.000	0.000	0.000	0.000	0.091	pg151_o3.cx7_1g
0.000	0.000	96.822	3.140	0.038	0.000	0.000	0.000	0.000	0.000	0.026	pg151_o3_native.cx7_1g
0.000	0.000	97.833	2.131	0.035	0.000	0.000	0.000	0.000	0.000	0.025	pg151_o3_native_lto.cx7_1g