Introduction
This is a report for the insert benchmark with 20M docs and 4 client(s). It is generated by scripts (bash, awk, sed) and Tufte might not be impressed. An overview of the insert benchmark is here and a short update is here. Below, by DBMS, I mean DBMS+version.config. An example is my8020.c10b40 where my means MySQL, 8020 is version 8.0.20 and c10b40 is the name for the configuration file.
The test server has 8 AMD cores, 16G RAM and an NVMe SSD. It is described here as the Beelink. The benchmark was run with 4 clients and there were 1 or 2 connections per client (1 for queries, 1 for inserts). The benchmark loads 20M rows without secondary indexes, creates secondary indexes, loads another 20M rows then does 3 read+write tests for one hour each that do queries as fast as possible with 100, 500 and then 1000 writes/second/client concurrent with the queries. All clients share one table. The database is cached by the OS page cache but not by the storage engine. Clients and the DBMS share one server. The per-database configs are in the per-database subdirectories here.
The tested DBMS are:
- fbmy5635_rel_withdbg.cay9c1g - MyRocks 5.6.35, the cay9c1g config and compiled with CMAKE_BUILD_TYPE=RelWithDebInfo and -O2
- fbmy5635_rel_o2.cay9c1g - MyRocks 5.6.35, the cay9c1g config and compiled with CMAKE_BUILD_TYPE=Release and -O2
- fbmy5635_rel.cay9c1g - MyRocks 5.6.35, the cay9c1g config and compiled with CMAKE_BUILD_TYPE=Release and -O3
Contents
- Summary
- l.i0: load without secondary indexes
- l.x: create secondary indexes
- l.i1: continue load after secondary indexes created
- q100.1: range queries with 100 insert/s per client
- q500.1: range queries with 500 insert/s per client
- q1000.1: range queries with 1000 insert/s per client
Summary
The numbers are inserts/s for l.i0 and l.i1, indexed docs (or rows) /s for l.x and queries/s for q*.2. The values are the average rate over the entire test for inserts (IPS) and queries (QPS). The range of values for IPS and QPS is split into 3 parts: bottom 25%, middle 50%, top 25%. Values in the bottom 25% have a red background, values in the top 25% have a green background and values in the middle have no color. A gray background is used for values that can be ignored because the DBMS did not sustain the target insert rate. Red backgrounds are not used when the minimum value is within 80% of the max value.
| dbms | l.i0 | l.x | l.i1 | q100.1 | q500.1 | q1000.1 |
|---|---|---|---|---|---|---|
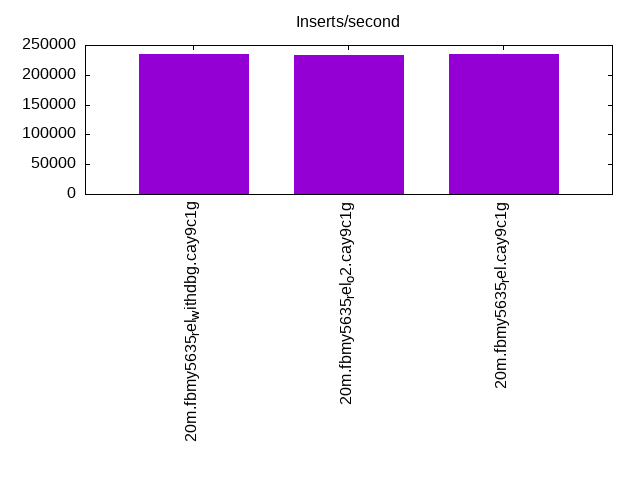
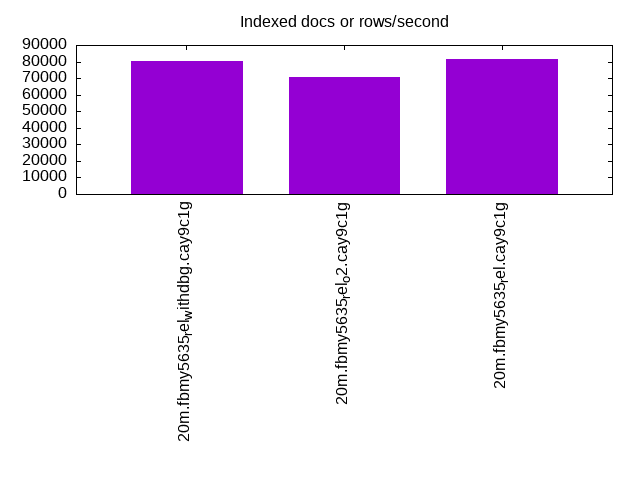
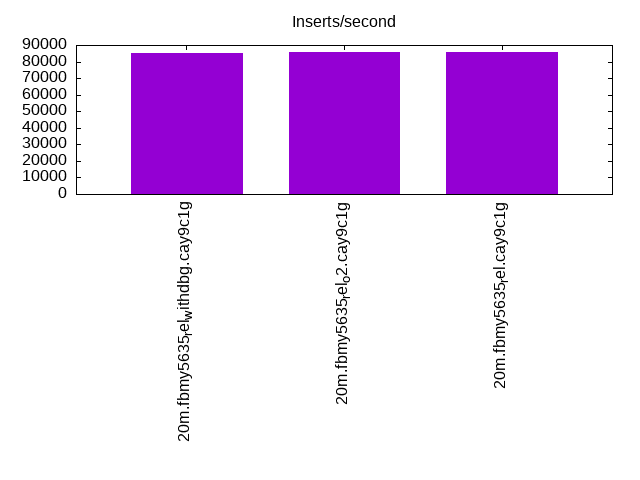
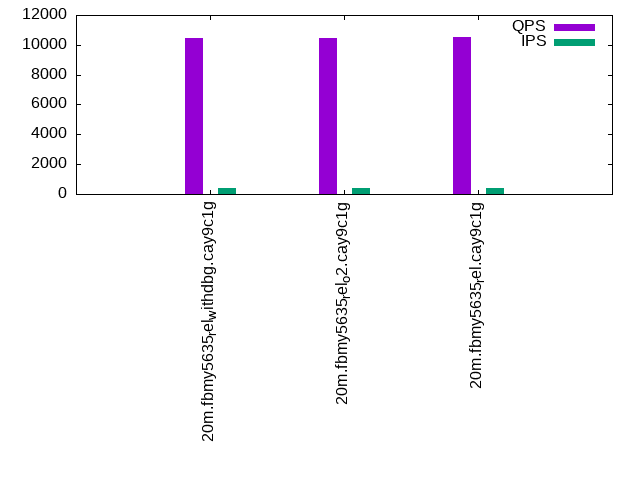
| 20m.fbmy5635_rel_withdbg.cay9c1g | 235294 | 80400 | 85106 | 10476 | 10144 | 10236 |
| 20m.fbmy5635_rel_o2.cay9c1g | 232558 | 70775 | 85470 | 10484 | 10214 | 10228 |
| 20m.fbmy5635_rel.cay9c1g | 235294 | 81707 | 85470 | 10530 | 10287 | 10466 |
This table has relative throughput, throughput for the DBMS relative to the DBMS in the first line, using the absolute throughput from the previous table.
| dbms | l.i0 | l.x | l.i1 | q100.1 | q500.1 | q1000.1 |
|---|---|---|---|---|---|---|
| 20m.fbmy5635_rel_withdbg.cay9c1g | 1.00 | 1.00 | 1.00 | 1.00 | 1.00 | 1.00 |
| 20m.fbmy5635_rel_o2.cay9c1g | 0.99 | 0.88 | 1.00 | 1.00 | 1.01 | 1.00 |
| 20m.fbmy5635_rel.cay9c1g | 1.00 | 1.02 | 1.00 | 1.01 | 1.01 | 1.02 |
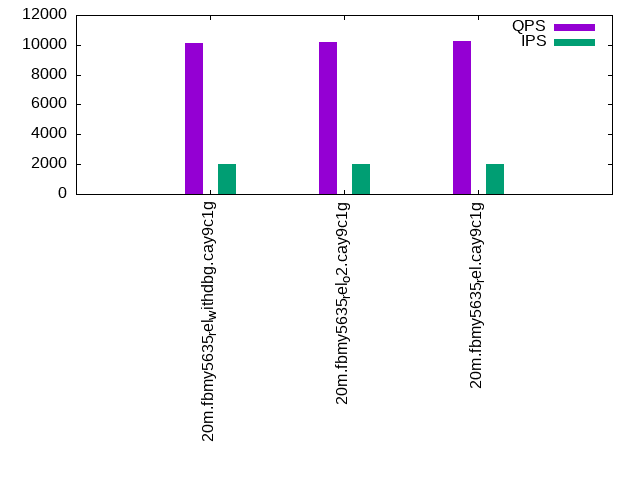
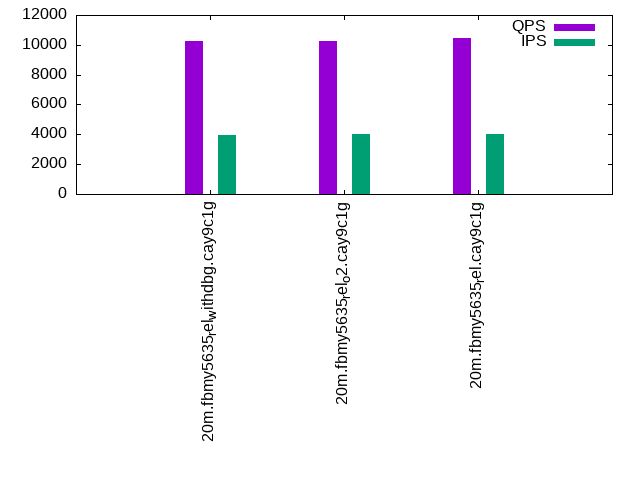
This lists the average rate of inserts/s for the tests that do inserts concurrent with queries. For such tests the query rate is listed in the table above. The read+write tests are setup so that the insert rate should match the target rate every second. Cells that are not at least 95% of the target have a red background to indicate a failure to satisfy the target.
| dbms | q100.1 | q500.1 | q1000.1 |
|---|---|---|---|
| fbmy5635_rel_withdbg.cay9c1g | 399 | 1994 | 3987 |
| fbmy5635_rel_o2.cay9c1g | 399 | 1993 | 3989 |
| fbmy5635_rel.cay9c1g | 399 | 1993 | 3989 |
| target | 400 | 2000 | 4000 |
l.i0
l.i0: load without secondary indexes. Graphs for performance per 1-second interval are here.
Average throughput:
Insert response time histogram: each cell has the percentage of responses that take <= the time in the header and max is the max response time in seconds. For the max column values in the top 25% of the range have a red background and in the bottom 25% of the range have a green background. The red background is not used when the min value is within 80% of the max value.
| dbms | 256us | 1ms | 4ms | 16ms | 64ms | 256ms | 1s | 4s | 16s | gt | max |
|---|---|---|---|---|---|---|---|---|---|---|---|
| fbmy5635_rel_withdbg.cay9c1g | 99.764 | 0.218 | 0.005 | 0.013 | 0.116 | ||||||
| fbmy5635_rel_o2.cay9c1g | 99.762 | 0.224 | 0.001 | 0.013 | 0.104 | ||||||
| fbmy5635_rel.cay9c1g | 99.779 | 0.204 | 0.003 | 0.013 | 0.117 |
Performance metrics for the DBMS listed above. Some are normalized by throughput, others are not. Legend for results is here.
ips	qps	rps	rmbps	wps	wmbps	rpq	rkbpq	wpi	wkbpi	csps	cpups	cspq	cpupq	dbgb1	dbgb2	rss	maxop	p50	p99	tag
235294	0	0	0.0	123.8	48.9	0.000	0.000	0.001	0.213	21773	72.0	0.093	24	0.7	1.8	0.3	0.116	69425	47581	20m.fbmy5635_rel_withdbg.cay9c1g
232558	0	0	0.0	124.4	49.3	0.000	0.000	0.001	0.217	21842	73.7	0.094	25	0.7	1.8	0.3	0.104	68947	12886	20m.fbmy5635_rel_o2.cay9c1g
235294	0	0	0.0	125.4	49.7	0.000	0.000	0.001	0.216	21854	72.2	0.093	25	0.7	1.7	0.3	0.117	70024	17881	20m.fbmy5635_rel.cay9c1g
l.x
l.x: create secondary indexes.
Average throughput:
Performance metrics for the DBMS listed above. Some are normalized by throughput, others are not. Legend for results is here.
ips	qps	rps	rmbps	wps	wmbps	rpq	rkbpq	wpi	wkbpi	csps	cpups	cspq	cpupq	dbgb1	dbgb2	rss	maxop	p50	p99	tag
80400	0	0	0.0	31.9	12.1	0.000	0.000	0.000	0.154	234	12.7	0.003	13	1.4	2.5	1.3	0.007	NA	NA	20m.fbmy5635_rel_withdbg.cay9c1g
70775	0	0	0.0	27.9	10.7	0.000	0.000	0.000	0.154	211	12.7	0.003	14	1.4	2.5	1.3	0.007	NA	NA	20m.fbmy5635_rel_o2.cay9c1g
81707	0	0	0.0	32.1	12.4	0.000	0.000	0.000	0.155	229	12.7	0.003	12	1.4	2.5	1.3	0.008	NA	NA	20m.fbmy5635_rel.cay9c1g
l.i1
l.i1: continue load after secondary indexes created. Graphs for performance per 1-second interval are here.
Average throughput:
Insert response time histogram: each cell has the percentage of responses that take <= the time in the header and max is the max response time in seconds. For the max column values in the top 25% of the range have a red background and in the bottom 25% of the range have a green background. The red background is not used when the min value is within 80% of the max value.
| dbms | 256us | 1ms | 4ms | 16ms | 64ms | 256ms | 1s | 4s | 16s | gt | max |
|---|---|---|---|---|---|---|---|---|---|---|---|
| fbmy5635_rel_withdbg.cay9c1g | 99.628 | 0.363 | 0.002 | 0.007 | 0.125 | ||||||
| fbmy5635_rel_o2.cay9c1g | 99.559 | 0.432 | 0.002 | 0.007 | 0.115 | ||||||
| fbmy5635_rel.cay9c1g | 99.540 | 0.451 | 0.005 | 0.004 | 0.103 |
Performance metrics for the DBMS listed above. Some are normalized by throughput, others are not. Legend for results is here.
ips	qps	rps	rmbps	wps	wmbps	rpq	rkbpq	wpi	wkbpi	csps	cpups	cspq	cpupq	dbgb1	dbgb2	rss	maxop	p50	p99	tag
85106	0	7	0.8	156.7	63.5	0.000	0.010	0.002	0.764	19619	69.3	0.231	65	4.6	6.4	1.4	0.125	21776	16940	20m.fbmy5635_rel_withdbg.cay9c1g
85470	0	11	1.4	154.0	62.8	0.000	0.017	0.002	0.753	19374	71.1	0.227	67	3.5	5.2	1.3	0.115	21776	16882	20m.fbmy5635_rel_o2.cay9c1g
85470	0	7	0.8	158.5	64.3	0.000	0.010	0.002	0.770	19439	70.0	0.227	66	3.8	5.5	1.4	0.103	21776	15589	20m.fbmy5635_rel.cay9c1g
q100.1
q100.1: range queries with 100 insert/s per client. Graphs for performance per 1-second interval are here.
Average throughput:
Query response time histogram: each cell has the percentage of responses that take <= the time in the header and max is the max response time in seconds. For max values in the top 25% of the range have a red background and in the bottom 25% of the range have a green background. The red background is not used when the min value is within 80% of the max value.
| dbms | 256us | 1ms | 4ms | 16ms | 64ms | 256ms | 1s | 4s | 16s | gt | max |
|---|---|---|---|---|---|---|---|---|---|---|---|
| fbmy5635_rel_withdbg.cay9c1g | 9.234 | 90.759 | 0.007 | 0.001 | nonzero | 0.020 | |||||
| fbmy5635_rel_o2.cay9c1g | 9.436 | 90.558 | 0.006 | nonzero | nonzero | 0.039 | |||||
| fbmy5635_rel.cay9c1g | 9.885 | 90.107 | 0.007 | 0.001 | 0.010 |
Insert response time histogram: each cell has the percentage of responses that take <= the time in the header and max is the max response time in seconds. For max values in the top 25% of the range have a red background and in the bottom 25% of the range have a green background. The red background is not used when the min value is within 80% of the max value.
| dbms | 256us | 1ms | 4ms | 16ms | 64ms | 256ms | 1s | 4s | 16s | gt | max |
|---|---|---|---|---|---|---|---|---|---|---|---|
| fbmy5635_rel_withdbg.cay9c1g | 99.535 | 0.458 | 0.007 | 0.021 | |||||||
| fbmy5635_rel_o2.cay9c1g | 99.778 | 0.222 | 0.008 | ||||||||
| fbmy5635_rel.cay9c1g | 99.514 | 0.486 | 0.014 |
Performance metrics for the DBMS listed above. Some are normalized by throughput, others are not. Legend for results is here.
ips	qps	rps	rmbps	wps	wmbps	rpq	rkbpq	wpi	wkbpi	csps	cpups	cspq	cpupq	dbgb1	dbgb2	rss	maxop	p50	p99	tag
399	10476	24	0.3	7.7	1.9	0.002	0.029	0.019	4.837	39307	50.7	3.752	387	2.8	4.6	1.4	0.020	2605	2269	20m.fbmy5635_rel_withdbg.cay9c1g
399	10484	16	0.2	7.0	1.6	0.001	0.021	0.018	4.146	39412	50.5	3.759	385	2.8	4.6	1.4	0.039	2621	2270	20m.fbmy5635_rel_o2.cay9c1g
399	10530	25	0.3	7.3	1.7	0.002	0.029	0.018	4.319	39663	50.4	3.767	383	2.8	4.7	1.4	0.010	2606	2254	20m.fbmy5635_rel.cay9c1g
q500.1
q500.1: range queries with 500 insert/s per client. Graphs for performance per 1-second interval are here.
Average throughput:
Query response time histogram: each cell has the percentage of responses that take <= the time in the header and max is the max response time in seconds. For max values in the top 25% of the range have a red background and in the bottom 25% of the range have a green background. The red background is not used when the min value is within 80% of the max value.
| dbms | 256us | 1ms | 4ms | 16ms | 64ms | 256ms | 1s | 4s | 16s | gt | max |
|---|---|---|---|---|---|---|---|---|---|---|---|
| fbmy5635_rel_withdbg.cay9c1g | 6.201 | 93.763 | 0.035 | 0.001 | 0.012 | ||||||
| fbmy5635_rel_o2.cay9c1g | 6.716 | 93.250 | 0.033 | 0.002 | 0.015 | ||||||
| fbmy5635_rel.cay9c1g | 7.349 | 92.619 | 0.031 | 0.001 | nonzero | 0.024 |
Insert response time histogram: each cell has the percentage of responses that take <= the time in the header and max is the max response time in seconds. For max values in the top 25% of the range have a red background and in the bottom 25% of the range have a green background. The red background is not used when the min value is within 80% of the max value.
| dbms | 256us | 1ms | 4ms | 16ms | 64ms | 256ms | 1s | 4s | 16s | gt | max |
|---|---|---|---|---|---|---|---|---|---|---|---|
| fbmy5635_rel_withdbg.cay9c1g | 97.293 | 2.679 | 0.028 | 0.047 | |||||||
| fbmy5635_rel_o2.cay9c1g | 98.700 | 1.290 | 0.010 | 0.048 | |||||||
| fbmy5635_rel.cay9c1g | 98.842 | 1.147 | 0.011 | 0.046 |
Performance metrics for the DBMS listed above. Some are normalized by throughput, others are not. Legend for results is here.
ips	qps	rps	rmbps	wps	wmbps	rpq	rkbpq	wpi	wkbpi	csps	cpups	cspq	cpupq	dbgb1	dbgb2	rss	maxop	p50	p99	tag
1994	10144	0	0.0	6.5	1.5	0.000	0.000	0.003	0.753	38194	50.8	3.765	401	3.2	3.5	1.4	0.012	2493	2207	20m.fbmy5635_rel_withdbg.cay9c1g
1993	10214	0	0.0	6.7	1.5	0.000	0.000	0.003	0.784	38420	50.9	3.762	399	3.2	3.5	1.4	0.015	2557	2238	20m.fbmy5635_rel_o2.cay9c1g
1993	10287	0	0.0	7.3	1.8	0.000	0.000	0.004	0.902	38706	50.9	3.763	396	3.2	3.5	1.4	0.024	2541	2254	20m.fbmy5635_rel.cay9c1g
q1000.1
q1000.1: range queries with 1000 insert/s per client. Graphs for performance per 1-second interval are here.
Average throughput:
Query response time histogram: each cell has the percentage of responses that take <= the time in the header and max is the max response time in seconds. For max values in the top 25% of the range have a red background and in the bottom 25% of the range have a green background. The red background is not used when the min value is within 80% of the max value.
| dbms | 256us | 1ms | 4ms | 16ms | 64ms | 256ms | 1s | 4s | 16s | gt | max |
|---|---|---|---|---|---|---|---|---|---|---|---|
| fbmy5635_rel_withdbg.cay9c1g | 5.188 | 94.701 | 0.107 | 0.004 | nonzero | 0.024 | |||||
| fbmy5635_rel_o2.cay9c1g | 5.027 | 94.877 | 0.091 | 0.004 | nonzero | 0.025 | |||||
| fbmy5635_rel.cay9c1g | 6.563 | 93.324 | 0.108 | 0.005 | nonzero | 0.019 |
Insert response time histogram: each cell has the percentage of responses that take <= the time in the header and max is the max response time in seconds. For max values in the top 25% of the range have a red background and in the bottom 25% of the range have a green background. The red background is not used when the min value is within 80% of the max value.
| dbms | 256us | 1ms | 4ms | 16ms | 64ms | 256ms | 1s | 4s | 16s | gt | max |
|---|---|---|---|---|---|---|---|---|---|---|---|
| fbmy5635_rel_withdbg.cay9c1g | 85.140 | 14.805 | 0.055 | 0.058 | |||||||
| fbmy5635_rel_o2.cay9c1g | 84.762 | 15.187 | 0.051 | 0.049 | |||||||
| fbmy5635_rel.cay9c1g | 86.126 | 13.806 | 0.069 | 0.047 |
Performance metrics for the DBMS listed above. Some are normalized by throughput, others are not. Legend for results is here.
ips	qps	rps	rmbps	wps	wmbps	rpq	rkbpq	wpi	wkbpi	csps	cpups	cspq	cpupq	dbgb1	dbgb2	rss	maxop	p50	p99	tag
3987	10236	0	0.0	15.1	5.0	0.000	0.000	0.004	1.279	37480	53.4	3.662	417	3.6	4.8	1.4	0.024	2526	2234	20m.fbmy5635_rel_withdbg.cay9c1g
3989	10228	0	0.0	14.1	4.5	0.000	0.000	0.004	1.167	37333	53.3	3.650	417	3.7	4.9	1.4	0.025	2541	2238	20m.fbmy5635_rel_o2.cay9c1g
3989	10466	0	0.0	14.9	5.0	0.000	0.000	0.004	1.286	38177	53.6	3.648	410	3.7	4.9	1.4	0.019	2589	2285	20m.fbmy5635_rel.cay9c1g
l.i0
l.i0: load without secondary indexes
Performance metrics for all DBMS, not just the ones listed above. Some are normalized by throughput, others are not. Legend for results is here.
ips	qps	rps	rmbps	wps	wmbps	rpq	rkbpq	wpi	wkbpi	csps	cpups	cspq	cpupq	dbgb1	dbgb2	rss	maxop	p50	p99	tag
235294	0	0	0.0	123.8	48.9	0.000	0.000	0.001	0.213	21773	72.0	0.093	24	0.7	1.8	0.3	0.116	69425	47581	20m.fbmy5635_rel_withdbg.cay9c1g
232558	0	0	0.0	124.4	49.3	0.000	0.000	0.001	0.217	21842	73.7	0.094	25	0.7	1.8	0.3	0.104	68947	12886	20m.fbmy5635_rel_o2.cay9c1g
235294	0	0	0.0	125.4	49.7	0.000	0.000	0.001	0.216	21854	72.2	0.093	25	0.7	1.7	0.3	0.117	70024	17881	20m.fbmy5635_rel.cay9c1g
l.x
l.x: create secondary indexes
Performance metrics for all DBMS, not just the ones listed above. Some are normalized by throughput, others are not. Legend for results is here.
ips	qps	rps	rmbps	wps	wmbps	rpq	rkbpq	wpi	wkbpi	csps	cpups	cspq	cpupq	dbgb1	dbgb2	rss	maxop	p50	p99	tag
80400	0	0	0.0	31.9	12.1	0.000	0.000	0.000	0.154	234	12.7	0.003	13	1.4	2.5	1.3	0.007	NA	NA	20m.fbmy5635_rel_withdbg.cay9c1g
70775	0	0	0.0	27.9	10.7	0.000	0.000	0.000	0.154	211	12.7	0.003	14	1.4	2.5	1.3	0.007	NA	NA	20m.fbmy5635_rel_o2.cay9c1g
81707	0	0	0.0	32.1	12.4	0.000	0.000	0.000	0.155	229	12.7	0.003	12	1.4	2.5	1.3	0.008	NA	NA	20m.fbmy5635_rel.cay9c1g
l.i1
l.i1: continue load after secondary indexes created
Performance metrics for all DBMS, not just the ones listed above. Some are normalized by throughput, others are not. Legend for results is here.
ips	qps	rps	rmbps	wps	wmbps	rpq	rkbpq	wpi	wkbpi	csps	cpups	cspq	cpupq	dbgb1	dbgb2	rss	maxop	p50	p99	tag
85106	0	7	0.8	156.7	63.5	0.000	0.010	0.002	0.764	19619	69.3	0.231	65	4.6	6.4	1.4	0.125	21776	16940	20m.fbmy5635_rel_withdbg.cay9c1g
85470	0	11	1.4	154.0	62.8	0.000	0.017	0.002	0.753	19374	71.1	0.227	67	3.5	5.2	1.3	0.115	21776	16882	20m.fbmy5635_rel_o2.cay9c1g
85470	0	7	0.8	158.5	64.3	0.000	0.010	0.002	0.770	19439	70.0	0.227	66	3.8	5.5	1.4	0.103	21776	15589	20m.fbmy5635_rel.cay9c1g
q100.1
q100.1: range queries with 100 insert/s per client
Performance metrics for all DBMS, not just the ones listed above. Some are normalized by throughput, others are not. Legend for results is here.
ips	qps	rps	rmbps	wps	wmbps	rpq	rkbpq	wpi	wkbpi	csps	cpups	cspq	cpupq	dbgb1	dbgb2	rss	maxop	p50	p99	tag
399	10476	24	0.3	7.7	1.9	0.002	0.029	0.019	4.837	39307	50.7	3.752	387	2.8	4.6	1.4	0.020	2605	2269	20m.fbmy5635_rel_withdbg.cay9c1g
399	10484	16	0.2	7.0	1.6	0.001	0.021	0.018	4.146	39412	50.5	3.759	385	2.8	4.6	1.4	0.039	2621	2270	20m.fbmy5635_rel_o2.cay9c1g
399	10530	25	0.3	7.3	1.7	0.002	0.029	0.018	4.319	39663	50.4	3.767	383	2.8	4.7	1.4	0.010	2606	2254	20m.fbmy5635_rel.cay9c1g
q500.1
q500.1: range queries with 500 insert/s per client
Performance metrics for all DBMS, not just the ones listed above. Some are normalized by throughput, others are not. Legend for results is here.
ips	qps	rps	rmbps	wps	wmbps	rpq	rkbpq	wpi	wkbpi	csps	cpups	cspq	cpupq	dbgb1	dbgb2	rss	maxop	p50	p99	tag
1994	10144	0	0.0	6.5	1.5	0.000	0.000	0.003	0.753	38194	50.8	3.765	401	3.2	3.5	1.4	0.012	2493	2207	20m.fbmy5635_rel_withdbg.cay9c1g
1993	10214	0	0.0	6.7	1.5	0.000	0.000	0.003	0.784	38420	50.9	3.762	399	3.2	3.5	1.4	0.015	2557	2238	20m.fbmy5635_rel_o2.cay9c1g
1993	10287	0	0.0	7.3	1.8	0.000	0.000	0.004	0.902	38706	50.9	3.763	396	3.2	3.5	1.4	0.024	2541	2254	20m.fbmy5635_rel.cay9c1g
q1000.1
q1000.1: range queries with 1000 insert/s per client
Performance metrics for all DBMS, not just the ones listed above. Some are normalized by throughput, others are not. Legend for results is here.
ips	qps	rps	rmbps	wps	wmbps	rpq	rkbpq	wpi	wkbpi	csps	cpups	cspq	cpupq	dbgb1	dbgb2	rss	maxop	p50	p99	tag
3987	10236	0	0.0	15.1	5.0	0.000	0.000	0.004	1.279	37480	53.4	3.662	417	3.6	4.8	1.4	0.024	2526	2234	20m.fbmy5635_rel_withdbg.cay9c1g
3989	10228	0	0.0	14.1	4.5	0.000	0.000	0.004	1.167	37333	53.3	3.650	417	3.7	4.9	1.4	0.025	2541	2238	20m.fbmy5635_rel_o2.cay9c1g
3989	10466	0	0.0	14.9	5.0	0.000	0.000	0.004	1.286	38177	53.6	3.648	410	3.7	4.9	1.4	0.019	2589	2285	20m.fbmy5635_rel.cay9c1g
l.i0
- l.i0: load without secondary indexes
- Legend for results is here.
- Each entry lists the percentage of responses that fit in that bucket (slower than max time for previous bucket, faster than min time for next bucket).
Insert response time histogram
256us	1ms	4ms	16ms	64ms	256ms	1s	4s	16s	gt	max	tag
0.000	0.000	99.764	0.218	0.005	0.013	0.000	0.000	0.000	0.000	0.116	fbmy5635_rel_withdbg.cay9c1g
0.000	0.000	99.762	0.224	0.001	0.013	0.000	0.000	0.000	0.000	0.104	fbmy5635_rel_o2.cay9c1g
0.000	0.000	99.779	0.204	0.003	0.013	0.000	0.000	0.000	0.000	0.117	fbmy5635_rel.cay9c1g
l.x
- l.x: create secondary indexes
- Legend for results is here.
- Each entry lists the percentage of responses that fit in that bucket (slower than max time for previous bucket, faster than min time for next bucket).
TODO - determine whether there is data for create index response time
l.i1
- l.i1: continue load after secondary indexes created
- Legend for results is here.
- Each entry lists the percentage of responses that fit in that bucket (slower than max time for previous bucket, faster than min time for next bucket).
Insert response time histogram
256us	1ms	4ms	16ms	64ms	256ms	1s	4s	16s	gt	max	tag
0.000	0.000	99.628	0.363	0.002	0.007	0.000	0.000	0.000	0.000	0.125	fbmy5635_rel_withdbg.cay9c1g
0.000	0.000	99.559	0.432	0.002	0.007	0.000	0.000	0.000	0.000	0.115	fbmy5635_rel_o2.cay9c1g
0.000	0.000	99.540	0.451	0.005	0.004	0.000	0.000	0.000	0.000	0.103	fbmy5635_rel.cay9c1g
q100.1
- q100.1: range queries with 100 insert/s per client
- Legend for results is here.
- Each entry lists the percentage of responses that fit in that bucket (slower than max time for previous bucket, faster than min time for next bucket).
Query response time histogram
256us	1ms	4ms	16ms	64ms	256ms	1s	4s	16s	gt	max	tag
9.234	90.759	0.007	0.001	nonzero	0.000	0.000	0.000	0.000	0.000	0.020	fbmy5635_rel_withdbg.cay9c1g
9.436	90.558	0.006	nonzero	nonzero	0.000	0.000	0.000	0.000	0.000	0.039	fbmy5635_rel_o2.cay9c1g
9.885	90.107	0.007	0.001	0.000	0.000	0.000	0.000	0.000	0.000	0.010	fbmy5635_rel.cay9c1g
Insert response time histogram
256us	1ms	4ms	16ms	64ms	256ms	1s	4s	16s	gt	max	tag
0.000	0.000	99.535	0.458	0.007	0.000	0.000	0.000	0.000	0.000	0.021	fbmy5635_rel_withdbg.cay9c1g
0.000	0.000	99.778	0.222	0.000	0.000	0.000	0.000	0.000	0.000	0.008	fbmy5635_rel_o2.cay9c1g
0.000	0.000	99.514	0.486	0.000	0.000	0.000	0.000	0.000	0.000	0.014	fbmy5635_rel.cay9c1g
q500.1
- q500.1: range queries with 500 insert/s per client
- Legend for results is here.
- Each entry lists the percentage of responses that fit in that bucket (slower than max time for previous bucket, faster than min time for next bucket).
Query response time histogram
256us	1ms	4ms	16ms	64ms	256ms	1s	4s	16s	gt	max	tag
6.201	93.763	0.035	0.001	0.000	0.000	0.000	0.000	0.000	0.000	0.012	fbmy5635_rel_withdbg.cay9c1g
6.716	93.250	0.033	0.002	0.000	0.000	0.000	0.000	0.000	0.000	0.015	fbmy5635_rel_o2.cay9c1g
7.349	92.619	0.031	0.001	nonzero	0.000	0.000	0.000	0.000	0.000	0.024	fbmy5635_rel.cay9c1g
Insert response time histogram
256us	1ms	4ms	16ms	64ms	256ms	1s	4s	16s	gt	max	tag
0.000	0.000	97.293	2.679	0.028	0.000	0.000	0.000	0.000	0.000	0.047	fbmy5635_rel_withdbg.cay9c1g
0.000	0.000	98.700	1.290	0.010	0.000	0.000	0.000	0.000	0.000	0.048	fbmy5635_rel_o2.cay9c1g
0.000	0.000	98.842	1.147	0.011	0.000	0.000	0.000	0.000	0.000	0.046	fbmy5635_rel.cay9c1g
q1000.1
- q1000.1: range queries with 1000 insert/s per client
- Legend for results is here.
- Each entry lists the percentage of responses that fit in that bucket (slower than max time for previous bucket, faster than min time for next bucket).
Query response time histogram
256us	1ms	4ms	16ms	64ms	256ms	1s	4s	16s	gt	max	tag
5.188	94.701	0.107	0.004	nonzero	0.000	0.000	0.000	0.000	0.000	0.024	fbmy5635_rel_withdbg.cay9c1g
5.027	94.877	0.091	0.004	nonzero	0.000	0.000	0.000	0.000	0.000	0.025	fbmy5635_rel_o2.cay9c1g
6.563	93.324	0.108	0.005	nonzero	0.000	0.000	0.000	0.000	0.000	0.019	fbmy5635_rel.cay9c1g
Insert response time histogram
256us	1ms	4ms	16ms	64ms	256ms	1s	4s	16s	gt	max	tag
0.000	0.000	85.140	14.805	0.055	0.000	0.000	0.000	0.000	0.000	0.058	fbmy5635_rel_withdbg.cay9c1g
0.000	0.000	84.762	15.187	0.051	0.000	0.000	0.000	0.000	0.000	0.049	fbmy5635_rel_o2.cay9c1g
0.000	0.000	86.126	13.806	0.069	0.000	0.000	0.000	0.000	0.000	0.047	fbmy5635_rel.cay9c1g