Introduction
This is a report for the insert benchmark with 400M docs and 20 client(s). It is generated by scripts (bash, awk, sed) and Tufte might not be impressed. An overview of the insert benchmark is here and a short update is here. Below, by DBMS, I mean DBMS+version.config. An example is my8020.c10b40 where my means MySQL, 8020 is version 8.0.20 and c10b40 is the name for the configuration file.
The test server is a c2-standard-60 from GCP with 30 cores, hyperthreading disabled, 240G RAM and 3T from XFS and SW RAID 0 striped over 8 local NVMe drives. The benchmark was run with 20 clients and there were 1 or 2 connections per client (1 for queries, 1 for inserts). The benchmark loads 400M rows without secondary indexes, creates secondary indexes, loads another 400M rows then does 3 read+write tests for one hour each that do queries as fast as possible with 100, 500 and then 1000 writes/second/client concurrent with the queries. Each read-write test runs for 1800 seconds. The test was configured to use one table. The database fits in the DBMS buffer pool. Clients and the DBMS share one server. The per-database configs are in the per-database subdirectories here.
The tested DBMS are:
- pg1119_o3_native_lto.cx7_gcp_c2s60 - Postgres 11.19, the cx7_gcp_c2s60 config and a build that uses -O3 -march=native -mtune=native -flto (link-time optimization)
- pg1214_o3_native_lto.cx7_gcp_c2s60 - Postgres 12.14, the cx7_gcp_c2s60 config and a build that uses -O3 -march=native -mtune=native -flto (link-time optimization)
- pg1310_o3_native_lto.cx7_gcp_c2s60 - Postgres 13.10, the cx7_gcp_c2s60 config and a build that uses -O3 -march=native -mtune=native -flto (link-time optimization)
- pg147_o3_native_lto.cx7_gcp_c2s60 - Postgres 14.7, the cx7_gcp_c2s60 config and a build that uses -O3 -march=native -mtune=native -flto (link-time optimization)
- pg151_o3_native_lto.cx7_gcp_c2s60 - Postgres 15.1, the cx7_gcp_c2s60 config and a build that uses -O3 -march=native -mtune=native -flto (link-time optimization)
- pg152_o3_native_lto.cx7_gcp_c2s60 - Postgres 15.2, the cx7_gcp_c2s60 config and a build that uses -O3 -march=native -mtune=native -flto (link-time optimization)
Contents
- Summary
- l.i0: load without secondary indexes
- l.x: create secondary indexes
- l.i1: continue load after secondary indexes created
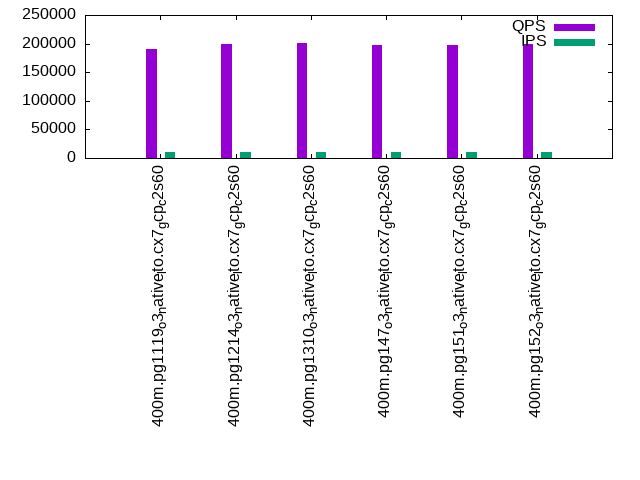
- q100.1: range queries with 100 insert/s per client
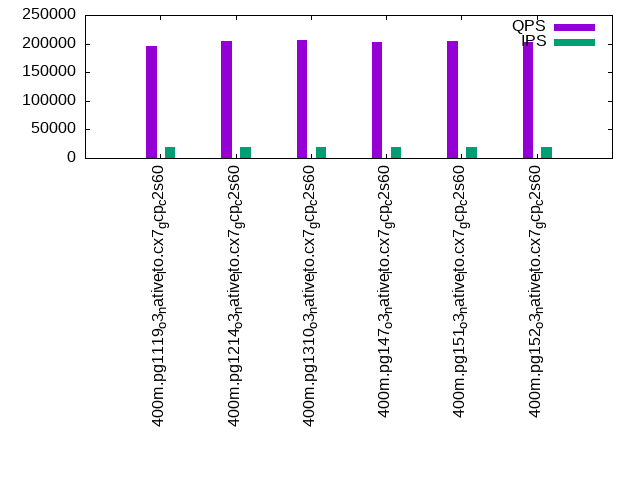
- q500.1: range queries with 500 insert/s per client
- q1000.1: range queries with 1000 insert/s per client
Summary
The numbers are inserts/s for l.i0 and l.i1, indexed docs (or rows) /s for l.x and queries/s for q*.2. The values are the average rate over the entire test for inserts (IPS) and queries (QPS). The range of values for IPS and QPS is split into 3 parts: bottom 25%, middle 50%, top 25%. Values in the bottom 25% have a red background, values in the top 25% have a green background and values in the middle have no color. A gray background is used for values that can be ignored because the DBMS did not sustain the target insert rate. Red backgrounds are not used when the minimum value is within 80% of the max value.
| dbms | l.i0 | l.x | l.i1 | q100.1 | q500.1 | q1000.1 |
|---|---|---|---|---|---|---|
| 400m.pg1119_o3_native_lto.cx7_gcp_c2s60 | 1108033 | 326879 | 396432 | 189845 | 191245 | 195503 |
| 400m.pg1214_o3_native_lto.cx7_gcp_c2s60 | 1111111 | 327951 | 398010 | 197494 | 200007 | 205299 |
| 400m.pg1310_o3_native_lto.cx7_gcp_c2s60 | 1101928 | 338208 | 388350 | 199219 | 201186 | 205778 |
| 400m.pg147_o3_native_lto.cx7_gcp_c2s60 | 1072386 | 331483 | 392157 | 196892 | 198364 | 203390 |
| 400m.pg151_o3_native_lto.cx7_gcp_c2s60 | 1114206 | 328220 | 396040 | 197884 | 198355 | 203902 |
| 400m.pg152_o3_native_lto.cx7_gcp_c2s60 | 1117318 | 331483 | 396040 | 197851 | 198846 | 203524 |
This lists the average rate of inserts/s for the tests that do inserts concurrent with queries. For such tests the query rate is listed in the table above. The read+write tests are setup so that the insert rate should match the target rate every second. Cells that are not at least 95% of the target have a red background to indicate a failure to satisfy the target.
| dbms | q100.1 | q500.1 | q1000.1 |
|---|---|---|---|
| pg1119_o3_native_lto.cx7_gcp_c2s60 | 1976 | 9890 | 19758 |
| pg1214_o3_native_lto.cx7_gcp_c2s60 | 1977 | 9885 | 19769 |
| pg1310_o3_native_lto.cx7_gcp_c2s60 | 1976 | 9885 | 19769 |
| pg147_o3_native_lto.cx7_gcp_c2s60 | 1976 | 9885 | 19769 |
| pg151_o3_native_lto.cx7_gcp_c2s60 | 1976 | 9885 | 19769 |
| pg152_o3_native_lto.cx7_gcp_c2s60 | 1976 | 9885 | 19769 |
| target | 2000 | 10000 | 20000 |
l.i0
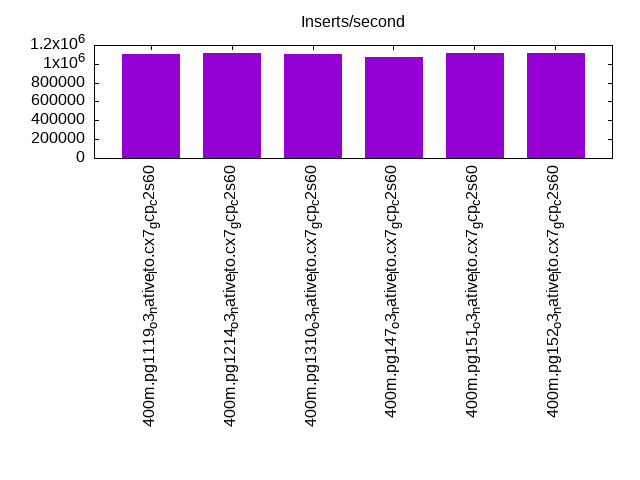
l.i0: load without secondary indexes. Graphs for performance per 1-second interval are here.
Average throughput:
Insert response time histogram: each cell has the percentage of responses that take <= the time in the header and max is the max response time in seconds. For the max column values in the top 25% of the range have a red background and in the bottom 25% of the range have a green background. The red background is not used when the min value is within 80% of the max value.
| dbms | 256us | 1ms | 4ms | 16ms | 64ms | 256ms | 1s | 4s | 16s | gt | max |
|---|---|---|---|---|---|---|---|---|---|---|---|
| pg1119_o3_native_lto.cx7_gcp_c2s60 | 25.318 | 71.429 | 3.195 | 0.015 | 0.025 | 0.018 | 0.813 | ||||
| pg1214_o3_native_lto.cx7_gcp_c2s60 | 25.467 | 71.174 | 3.311 | 0.009 | 0.025 | 0.015 | 0.729 | ||||
| pg1310_o3_native_lto.cx7_gcp_c2s60 | 26.135 | 70.323 | 3.484 | 0.019 | 0.023 | 0.016 | nonzero | 1.290 | |||
| pg147_o3_native_lto.cx7_gcp_c2s60 | 22.426 | 74.038 | 3.478 | 0.019 | 0.025 | 0.013 | 0.001 | 1.364 | |||
| pg151_o3_native_lto.cx7_gcp_c2s60 | 27.644 | 69.081 | 3.222 | 0.012 | 0.028 | 0.013 | 0.984 | ||||
| pg152_o3_native_lto.cx7_gcp_c2s60 | 27.447 | 69.365 | 3.137 | 0.015 | 0.024 | 0.012 | 0.001 | 1.151 |
Performance metrics for the DBMS listed above. Some are normalized by throughput, others are not. Legend for results is here.
ips	qps	rps	rmbps	wps	wmbps	rpq	rkbpq	wpi	wkbpi	csps	cpups	cspq	cpupq	dbgb1	dbgb2	rss	maxop	p50	p99	tag
1108033	0	0	0.0	1764.4	421.0	0.000	0.000	0.002	0.389	350126	57.7	0.316	16	44.2	114.1	NA	0.813	61833	9693	400m.pg1119_o3_native_lto.cx7_gcp_c2s60
1111111	0	0	0.0	1785.1	427.3	0.000	0.000	0.002	0.394	308509	57.4	0.278	15	43.0	112.3	0.0	0.729	61833	12986	400m.pg1214_o3_native_lto.cx7_gcp_c2s60
1101928	0	0	0.0	1726.0	422.9	0.000	0.000	0.002	0.393	324734	57.2	0.295	16	43.0	114.9	NA	1.290	61563	8091	400m.pg1310_o3_native_lto.cx7_gcp_c2s60
1072386	0	0	0.0	1621.8	407.2	0.000	0.000	0.002	0.389	331475	56.6	0.309	16	43.0	116.5	NA	1.364	59833	12990	400m.pg147_o3_native_lto.cx7_gcp_c2s60
1114206	0	0	0.0	1707.0	419.3	0.000	0.000	0.002	0.385	328361	56.9	0.295	15	43.0	113.7	NA	0.984	61933	11287	400m.pg151_o3_native_lto.cx7_gcp_c2s60
1117318	0	0	0.0	1662.9	414.6	0.000	0.000	0.001	0.380	327166	57.3	0.293	15	43.0	113.5	NA	1.151	61733	9190	400m.pg152_o3_native_lto.cx7_gcp_c2s60
l.x
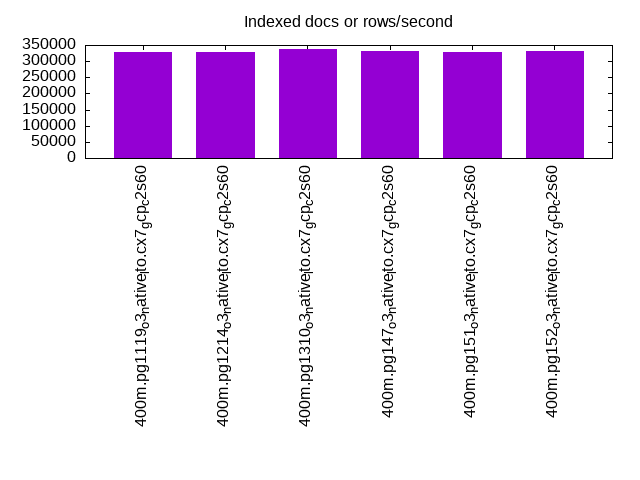
l.x: create secondary indexes.
Average throughput:
Performance metrics for the DBMS listed above. Some are normalized by throughput, others are not. Legend for results is here.
ips	qps	rps	rmbps	wps	wmbps	rpq	rkbpq	wpi	wkbpi	csps	cpups	cspq	cpupq	dbgb1	dbgb2	rss	maxop	p50	p99	tag
326879	0	1438	19.7	640.6	133.1	0.004	0.062	0.002	0.417	2019	3.3	0.006	3	79.5	155.2	0.0	0.002	NA	NA	400m.pg1119_o3_native_lto.cx7_gcp_c2s60
327951	0	1654	19.8	650.3	129.4	0.005	0.062	0.002	0.404	1882	3.3	0.006	3	78.3	153.5	0.0	0.002	NA	NA	400m.pg1214_o3_native_lto.cx7_gcp_c2s60
338208	0	890	16.2	395.3	93.3	0.003	0.049	0.001	0.282	802	3.3	0.002	3	78.3	150.8	0.0	0.013	NA	NA	400m.pg1310_o3_native_lto.cx7_gcp_c2s60
331483	0	1607	17.2	399.6	95.1	0.005	0.053	0.001	0.294	1304	3.2	0.004	3	78.3	152.5	0.0	0.002	NA	NA	400m.pg147_o3_native_lto.cx7_gcp_c2s60
328220	0	2422	15.3	450.2	105.2	0.007	0.048	0.001	0.328	1397	3.1	0.004	3	78.3	152.2	0.0	0.011	NA	NA	400m.pg151_o3_native_lto.cx7_gcp_c2s60
331483	0	2487	17.2	469.2	108.7	0.008	0.053	0.001	0.336	1395	3.1	0.004	3	78.3	152.7	0.0	0.010	NA	NA	400m.pg152_o3_native_lto.cx7_gcp_c2s60
l.i1
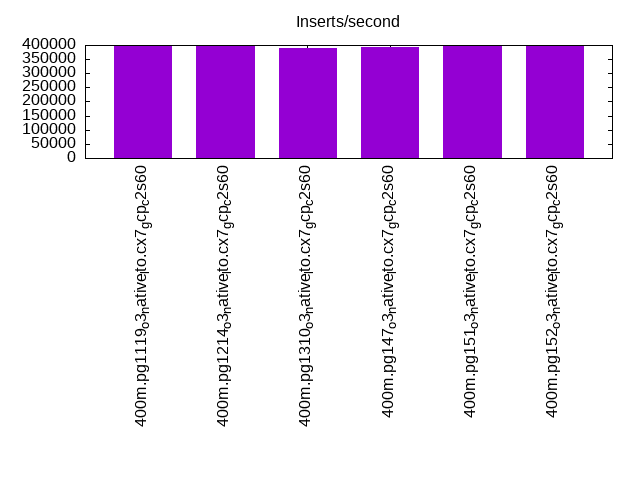
l.i1: continue load after secondary indexes created. Graphs for performance per 1-second interval are here.
Average throughput:
Insert response time histogram: each cell has the percentage of responses that take <= the time in the header and max is the max response time in seconds. For the max column values in the top 25% of the range have a red background and in the bottom 25% of the range have a green background. The red background is not used when the min value is within 80% of the max value.
| dbms | 256us | 1ms | 4ms | 16ms | 64ms | 256ms | 1s | 4s | 16s | gt | max |
|---|---|---|---|---|---|---|---|---|---|---|---|
| pg1119_o3_native_lto.cx7_gcp_c2s60 | 94.637 | 4.305 | 1.015 | 0.026 | 0.016 | 0.001 | 1.199 | ||||
| pg1214_o3_native_lto.cx7_gcp_c2s60 | 94.561 | 4.407 | 0.992 | 0.026 | 0.013 | 0.865 | |||||
| pg1310_o3_native_lto.cx7_gcp_c2s60 | 94.303 | 4.575 | 1.079 | 0.027 | 0.017 | 0.775 | |||||
| pg147_o3_native_lto.cx7_gcp_c2s60 | 94.401 | 4.571 | 0.993 | 0.022 | 0.012 | 0.001 | 1.155 | ||||
| pg151_o3_native_lto.cx7_gcp_c2s60 | 94.504 | 4.490 | 0.968 | 0.020 | 0.018 | nonzero | 1.046 | ||||
| pg152_o3_native_lto.cx7_gcp_c2s60 | 94.562 | 4.391 | 1.005 | 0.026 | 0.016 | 0.959 |
Performance metrics for the DBMS listed above. Some are normalized by throughput, others are not. Legend for results is here.
ips	qps	rps	rmbps	wps	wmbps	rpq	rkbpq	wpi	wkbpi	csps	cpups	cspq	cpupq	dbgb1	dbgb2	rss	maxop	p50	p99	tag
396432	0	3106	28.0	2489.5	417.0	0.008	0.072	0.006	1.077	286909	52.8	0.724	40	176.5	312.4	0.0	1.199	24484	1698	400m.pg1119_o3_native_lto.cx7_gcp_c2s60
398010	0	2999	27.8	2466.9	390.4	0.008	0.072	0.006	1.004	277376	53.3	0.697	40	170.2	305.6	0.0	0.865	24473	1848	400m.pg1214_o3_native_lto.cx7_gcp_c2s60
388350	0	2910	27.0	2535.3	440.4	0.007	0.071	0.007	1.161	285834	52.1	0.736	40	170.2	317.5	NA	0.775	24269	1399	400m.pg1310_o3_native_lto.cx7_gcp_c2s60
392157	0	2982	27.3	2367.0	421.9	0.008	0.071	0.006	1.102	298429	52.7	0.761	40	170.2	330.7	0.0	1.155	24074	1648	400m.pg147_o3_native_lto.cx7_gcp_c2s60
396040	0	2999	27.7	2388.5	419.8	0.008	0.072	0.006	1.085	290452	52.3	0.733	40	170.2	329.1	NA	1.046	24383	1448	400m.pg151_o3_native_lto.cx7_gcp_c2s60
396040	0	3098	27.8	2399.0	433.7	0.008	0.072	0.006	1.121	282779	52.6	0.714	40	170.2	324.2	NA	0.959	24473	1648	400m.pg152_o3_native_lto.cx7_gcp_c2s60
q100.1
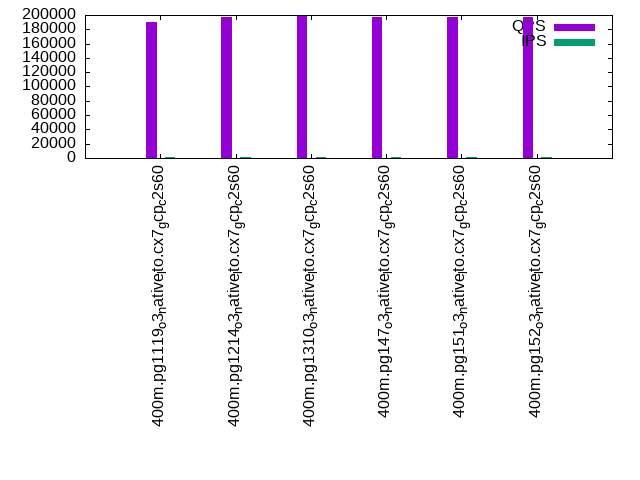
q100.1: range queries with 100 insert/s per client. Graphs for performance per 1-second interval are here.
Average throughput:
Query response time histogram: each cell has the percentage of responses that take <= the time in the header and max is the max response time in seconds. For max values in the top 25% of the range have a red background and in the bottom 25% of the range have a green background. The red background is not used when the min value is within 80% of the max value.
| dbms | 256us | 1ms | 4ms | 16ms | 64ms | 256ms | 1s | 4s | 16s | gt | max |
|---|---|---|---|---|---|---|---|---|---|---|---|
| pg1119_o3_native_lto.cx7_gcp_c2s60 | 99.971 | 0.022 | 0.006 | 0.001 | nonzero | 0.025 | |||||
| pg1214_o3_native_lto.cx7_gcp_c2s60 | 99.975 | 0.018 | 0.006 | 0.001 | nonzero | 0.023 | |||||
| pg1310_o3_native_lto.cx7_gcp_c2s60 | 99.977 | 0.016 | 0.006 | 0.001 | nonzero | 0.024 | |||||
| pg147_o3_native_lto.cx7_gcp_c2s60 | 99.975 | 0.018 | 0.006 | 0.001 | nonzero | 0.028 | |||||
| pg151_o3_native_lto.cx7_gcp_c2s60 | 99.976 | 0.018 | 0.006 | 0.001 | nonzero | 0.025 | |||||
| pg152_o3_native_lto.cx7_gcp_c2s60 | 99.976 | 0.017 | 0.006 | 0.001 | nonzero | 0.024 |
Insert response time histogram: each cell has the percentage of responses that take <= the time in the header and max is the max response time in seconds. For max values in the top 25% of the range have a red background and in the bottom 25% of the range have a green background. The red background is not used when the min value is within 80% of the max value.
| dbms | 256us | 1ms | 4ms | 16ms | 64ms | 256ms | 1s | 4s | 16s | gt | max |
|---|---|---|---|---|---|---|---|---|---|---|---|
| pg1119_o3_native_lto.cx7_gcp_c2s60 | 98.812 | 0.992 | 0.196 | 0.047 | |||||||
| pg1214_o3_native_lto.cx7_gcp_c2s60 | 98.608 | 1.206 | 0.186 | 0.040 | |||||||
| pg1310_o3_native_lto.cx7_gcp_c2s60 | 97.158 | 2.371 | 0.468 | 0.003 | 0.118 | ||||||
| pg147_o3_native_lto.cx7_gcp_c2s60 | 99.018 | 0.808 | 0.174 | 0.036 | |||||||
| pg151_o3_native_lto.cx7_gcp_c2s60 | 98.606 | 1.081 | 0.311 | 0.003 | 0.090 | ||||||
| pg152_o3_native_lto.cx7_gcp_c2s60 | 98.579 | 1.211 | 0.210 | 0.032 |
Performance metrics for the DBMS listed above. Some are normalized by throughput, others are not. Legend for results is here.
ips	qps	rps	rmbps	wps	wmbps	rpq	rkbpq	wpi	wkbpi	csps	cpups	cspq	cpupq	dbgb1	dbgb2	rss	maxop	p50	p99	tag
1976	189845	0	0.0	2873.6	74.5	0.000	0.000	1.454	38.594	677689	62.7	3.570	99	177.6	299.1	0.0	0.025	9414	9082	400m.pg1119_o3_native_lto.cx7_gcp_c2s60
1977	197494	0	0.0	2772.4	79.9	0.000	0.000	1.402	41.384	703046	63.0	3.560	96	171.1	293.7	0.0	0.023	9850	9494	400m.pg1214_o3_native_lto.cx7_gcp_c2s60
1976	199219	0	0.0	2578.1	72.6	0.000	0.000	1.305	37.645	709285	62.8	3.560	95	171.1	275.6	0.0	0.024	9898	9530	400m.pg1310_o3_native_lto.cx7_gcp_c2s60
1976	196892	0	0.0	2532.4	68.8	0.000	0.000	1.282	35.633	702693	62.7	3.569	96	171.1	315.6	0.0	0.028	9817	9477	400m.pg147_o3_native_lto.cx7_gcp_c2s60
1976	197884	0	0.0	2523.9	67.8	0.000	0.000	1.277	35.164	705334	62.9	3.564	95	171.1	303.9	0.0	0.025	9817	9477	400m.pg151_o3_native_lto.cx7_gcp_c2s60
1976	197851	0	0.0	2538.2	69.5	0.000	0.000	1.285	36.005	705631	62.7	3.566	95	171.1	303.2	0.0	0.024	9813	9494	400m.pg152_o3_native_lto.cx7_gcp_c2s60
q500.1
q500.1: range queries with 500 insert/s per client. Graphs for performance per 1-second interval are here.
Average throughput:
Query response time histogram: each cell has the percentage of responses that take <= the time in the header and max is the max response time in seconds. For max values in the top 25% of the range have a red background and in the bottom 25% of the range have a green background. The red background is not used when the min value is within 80% of the max value.
| dbms | 256us | 1ms | 4ms | 16ms | 64ms | 256ms | 1s | 4s | 16s | gt | max |
|---|---|---|---|---|---|---|---|---|---|---|---|
| pg1119_o3_native_lto.cx7_gcp_c2s60 | 99.910 | 0.060 | 0.027 | 0.003 | nonzero | nonzero | 0.133 | ||||
| pg1214_o3_native_lto.cx7_gcp_c2s60 | 99.919 | 0.052 | 0.026 | 0.003 | nonzero | 0.032 | |||||
| pg1310_o3_native_lto.cx7_gcp_c2s60 | 99.920 | 0.052 | 0.026 | 0.003 | nonzero | nonzero | 0.072 | ||||
| pg147_o3_native_lto.cx7_gcp_c2s60 | 99.917 | 0.053 | 0.026 | 0.003 | nonzero | 0.033 | |||||
| pg151_o3_native_lto.cx7_gcp_c2s60 | 99.919 | 0.052 | 0.026 | 0.003 | nonzero | 0.035 | |||||
| pg152_o3_native_lto.cx7_gcp_c2s60 | 99.919 | 0.052 | 0.026 | 0.003 | nonzero | 0.031 |
Insert response time histogram: each cell has the percentage of responses that take <= the time in the header and max is the max response time in seconds. For max values in the top 25% of the range have a red background and in the bottom 25% of the range have a green background. The red background is not used when the min value is within 80% of the max value.
| dbms | 256us | 1ms | 4ms | 16ms | 64ms | 256ms | 1s | 4s | 16s | gt | max |
|---|---|---|---|---|---|---|---|---|---|---|---|
| pg1119_o3_native_lto.cx7_gcp_c2s60 | 52.091 | 28.115 | 19.492 | 0.298 | 0.005 | 0.319 | |||||
| pg1214_o3_native_lto.cx7_gcp_c2s60 | 51.870 | 27.890 | 19.893 | 0.342 | 0.005 | 0.334 | |||||
| pg1310_o3_native_lto.cx7_gcp_c2s60 | 52.274 | 28.005 | 19.395 | 0.325 | 0.166 | ||||||
| pg147_o3_native_lto.cx7_gcp_c2s60 | 52.797 | 27.533 | 19.385 | 0.284 | 0.174 | ||||||
| pg151_o3_native_lto.cx7_gcp_c2s60 | 52.851 | 27.141 | 19.714 | 0.293 | 0.164 | ||||||
| pg152_o3_native_lto.cx7_gcp_c2s60 | 52.730 | 27.138 | 19.853 | 0.279 | 0.174 |
Performance metrics for the DBMS listed above. Some are normalized by throughput, others are not. Legend for results is here.
ips	qps	rps	rmbps	wps	wmbps	rpq	rkbpq	wpi	wkbpi	csps	cpups	cspq	cpupq	dbgb1	dbgb2	rss	maxop	p50	p99	tag
9890	191245	0	0.0	5211.0	158.3	0.000	0.000	0.527	16.391	668357	63.9	3.495	100	183.7	264.2	0.0	0.133	9513	9078	400m.pg1119_o3_native_lto.cx7_gcp_c2s60
9885	200007	0	0.0	4794.9	156.4	0.000	0.000	0.485	16.204	697274	63.8	3.486	96	176.0	257.7	0.0	0.032	9893	9477	400m.pg1214_o3_native_lto.cx7_gcp_c2s60
9885	201186	0	0.0	4691.4	151.6	0.000	0.000	0.475	15.703	701820	63.7	3.488	95	176.0	243.7	0.0	0.072	9989	9498	400m.pg1310_o3_native_lto.cx7_gcp_c2s60
9885	198364	0	0.0	4593.5	143.8	0.000	0.000	0.465	14.902	694761	63.5	3.502	96	176.0	262.0	0.0	0.033	9909	9465	400m.pg147_o3_native_lto.cx7_gcp_c2s60
9885	198355	0	0.0	4565.5	143.8	0.000	0.000	0.462	14.900	694603	63.5	3.502	96	176.0	260.7	0.0	0.035	9813	9353	400m.pg151_o3_native_lto.cx7_gcp_c2s60
9885	198846	0	0.0	4572.0	143.9	0.000	0.000	0.463	14.903	696337	63.5	3.502	96	176.0	259.8	0.0	0.031	9913	9478	400m.pg152_o3_native_lto.cx7_gcp_c2s60
q1000.1
q1000.1: range queries with 1000 insert/s per client. Graphs for performance per 1-second interval are here.
Average throughput:
Query response time histogram: each cell has the percentage of responses that take <= the time in the header and max is the max response time in seconds. For max values in the top 25% of the range have a red background and in the bottom 25% of the range have a green background. The red background is not used when the min value is within 80% of the max value.
| dbms | 256us | 1ms | 4ms | 16ms | 64ms | 256ms | 1s | 4s | 16s | gt | max |
|---|---|---|---|---|---|---|---|---|---|---|---|
| pg1119_o3_native_lto.cx7_gcp_c2s60 | 99.849 | 0.109 | 0.038 | 0.003 | nonzero | nonzero | nonzero | 0.443 | |||
| pg1214_o3_native_lto.cx7_gcp_c2s60 | 99.869 | 0.091 | 0.037 | 0.004 | nonzero | nonzero | 0.146 | ||||
| pg1310_o3_native_lto.cx7_gcp_c2s60 | 99.871 | 0.089 | 0.036 | 0.004 | nonzero | 0.053 | |||||
| pg147_o3_native_lto.cx7_gcp_c2s60 | 99.867 | 0.093 | 0.037 | 0.004 | nonzero | 0.030 | |||||
| pg151_o3_native_lto.cx7_gcp_c2s60 | 99.869 | 0.090 | 0.037 | 0.004 | nonzero | 0.036 | |||||
| pg152_o3_native_lto.cx7_gcp_c2s60 | 99.867 | 0.092 | 0.037 | 0.004 | nonzero | 0.041 |
Insert response time histogram: each cell has the percentage of responses that take <= the time in the header and max is the max response time in seconds. For max values in the top 25% of the range have a red background and in the bottom 25% of the range have a green background. The red background is not used when the min value is within 80% of the max value.
| dbms | 256us | 1ms | 4ms | 16ms | 64ms | 256ms | 1s | 4s | 16s | gt | max |
|---|---|---|---|---|---|---|---|---|---|---|---|
| pg1119_o3_native_lto.cx7_gcp_c2s60 | 66.895 | 22.762 | 10.093 | 0.246 | 0.001 | 0.003 | 1.889 | ||||
| pg1214_o3_native_lto.cx7_gcp_c2s60 | 60.416 | 26.150 | 13.099 | 0.335 | nonzero | 0.273 | |||||
| pg1310_o3_native_lto.cx7_gcp_c2s60 | 62.085 | 25.567 | 12.043 | 0.304 | 0.221 | ||||||
| pg147_o3_native_lto.cx7_gcp_c2s60 | 61.090 | 26.286 | 12.363 | 0.261 | 0.179 | ||||||
| pg151_o3_native_lto.cx7_gcp_c2s60 | 61.050 | 26.220 | 12.487 | 0.243 | 0.243 | ||||||
| pg152_o3_native_lto.cx7_gcp_c2s60 | 60.347 | 26.725 | 12.675 | 0.252 | 0.174 |
Performance metrics for the DBMS listed above. Some are normalized by throughput, others are not. Legend for results is here.
ips	qps	rps	rmbps	wps	wmbps	rpq	rkbpq	wpi	wkbpi	csps	cpups	cspq	cpupq	dbgb1	dbgb2	rss	maxop	p50	p99	tag
19758	195503	152	1.4	5260.2	222.5	0.001	0.007	0.266	11.530	658328	65.4	3.367	100	197.2	266.4	0.0	0.443	9733	9110	400m.pg1119_o3_native_lto.cx7_gcp_c2s60
19769	205299	0	0.0	4435.9	218.3	0.000	0.000	0.224	11.307	688133	65.4	3.352	96	189.4	259.9	0.0	0.146	10261	9526	400m.pg1214_o3_native_lto.cx7_gcp_c2s60
19769	205778	0	0.0	4370.8	209.3	0.000	0.000	0.221	10.839	692687	65.3	3.366	95	189.4	252.7	0.0	0.053	10168	9513	400m.pg1310_o3_native_lto.cx7_gcp_c2s60
19769	203390	0	0.0	4751.6	203.2	0.000	0.000	0.240	10.528	686455	65.0	3.375	96	189.4	269.8	0.0	0.030	10101	9430	400m.pg147_o3_native_lto.cx7_gcp_c2s60
19769	203902	0	0.0	4750.1	205.0	0.000	0.000	0.240	10.616	688505	65.1	3.377	96	189.4	269.0	0.0	0.036	10153	9462	400m.pg151_o3_native_lto.cx7_gcp_c2s60
19769	203524	0	0.0	4752.0	204.9	0.000	0.000	0.240	10.613	687289	65.0	3.377	96	189.4	268.6	0.0	0.041	10121	9382	400m.pg152_o3_native_lto.cx7_gcp_c2s60
l.i0
l.i0: load without secondary indexes
Performance metrics for all DBMS, not just the ones listed above. Some are normalized by throughput, others are not. Legend for results is here.
ips	qps	rps	rmbps	wps	wmbps	rpq	rkbpq	wpi	wkbpi	csps	cpups	cspq	cpupq	dbgb1	dbgb2	rss	maxop	p50	p99	tag
1108033	0	0	0.0	1764.4	421.0	0.000	0.000	0.002	0.389	350126	57.7	0.316	16	44.2	114.1	NA	0.813	61833	9693	400m.pg1119_o3_native_lto.cx7_gcp_c2s60
1111111	0	0	0.0	1785.1	427.3	0.000	0.000	0.002	0.394	308509	57.4	0.278	15	43.0	112.3	0.0	0.729	61833	12986	400m.pg1214_o3_native_lto.cx7_gcp_c2s60
1101928	0	0	0.0	1726.0	422.9	0.000	0.000	0.002	0.393	324734	57.2	0.295	16	43.0	114.9	NA	1.290	61563	8091	400m.pg1310_o3_native_lto.cx7_gcp_c2s60
1072386	0	0	0.0	1621.8	407.2	0.000	0.000	0.002	0.389	331475	56.6	0.309	16	43.0	116.5	NA	1.364	59833	12990	400m.pg147_o3_native_lto.cx7_gcp_c2s60
1114206	0	0	0.0	1707.0	419.3	0.000	0.000	0.002	0.385	328361	56.9	0.295	15	43.0	113.7	NA	0.984	61933	11287	400m.pg151_o3_native_lto.cx7_gcp_c2s60
1117318	0	0	0.0	1662.9	414.6	0.000	0.000	0.001	0.380	327166	57.3	0.293	15	43.0	113.5	NA	1.151	61733	9190	400m.pg152_o3_native_lto.cx7_gcp_c2s60
l.x
l.x: create secondary indexes
Performance metrics for all DBMS, not just the ones listed above. Some are normalized by throughput, others are not. Legend for results is here.
ips	qps	rps	rmbps	wps	wmbps	rpq	rkbpq	wpi	wkbpi	csps	cpups	cspq	cpupq	dbgb1	dbgb2	rss	maxop	p50	p99	tag
326879	0	1438	19.7	640.6	133.1	0.004	0.062	0.002	0.417	2019	3.3	0.006	3	79.5	155.2	0.0	0.002	NA	NA	400m.pg1119_o3_native_lto.cx7_gcp_c2s60
327951	0	1654	19.8	650.3	129.4	0.005	0.062	0.002	0.404	1882	3.3	0.006	3	78.3	153.5	0.0	0.002	NA	NA	400m.pg1214_o3_native_lto.cx7_gcp_c2s60
338208	0	890	16.2	395.3	93.3	0.003	0.049	0.001	0.282	802	3.3	0.002	3	78.3	150.8	0.0	0.013	NA	NA	400m.pg1310_o3_native_lto.cx7_gcp_c2s60
331483	0	1607	17.2	399.6	95.1	0.005	0.053	0.001	0.294	1304	3.2	0.004	3	78.3	152.5	0.0	0.002	NA	NA	400m.pg147_o3_native_lto.cx7_gcp_c2s60
328220	0	2422	15.3	450.2	105.2	0.007	0.048	0.001	0.328	1397	3.1	0.004	3	78.3	152.2	0.0	0.011	NA	NA	400m.pg151_o3_native_lto.cx7_gcp_c2s60
331483	0	2487	17.2	469.2	108.7	0.008	0.053	0.001	0.336	1395	3.1	0.004	3	78.3	152.7	0.0	0.010	NA	NA	400m.pg152_o3_native_lto.cx7_gcp_c2s60
l.i1
l.i1: continue load after secondary indexes created
Performance metrics for all DBMS, not just the ones listed above. Some are normalized by throughput, others are not. Legend for results is here.
ips	qps	rps	rmbps	wps	wmbps	rpq	rkbpq	wpi	wkbpi	csps	cpups	cspq	cpupq	dbgb1	dbgb2	rss	maxop	p50	p99	tag
396432	0	3106	28.0	2489.5	417.0	0.008	0.072	0.006	1.077	286909	52.8	0.724	40	176.5	312.4	0.0	1.199	24484	1698	400m.pg1119_o3_native_lto.cx7_gcp_c2s60
398010	0	2999	27.8	2466.9	390.4	0.008	0.072	0.006	1.004	277376	53.3	0.697	40	170.2	305.6	0.0	0.865	24473	1848	400m.pg1214_o3_native_lto.cx7_gcp_c2s60
388350	0	2910	27.0	2535.3	440.4	0.007	0.071	0.007	1.161	285834	52.1	0.736	40	170.2	317.5	NA	0.775	24269	1399	400m.pg1310_o3_native_lto.cx7_gcp_c2s60
392157	0	2982	27.3	2367.0	421.9	0.008	0.071	0.006	1.102	298429	52.7	0.761	40	170.2	330.7	0.0	1.155	24074	1648	400m.pg147_o3_native_lto.cx7_gcp_c2s60
396040	0	2999	27.7	2388.5	419.8	0.008	0.072	0.006	1.085	290452	52.3	0.733	40	170.2	329.1	NA	1.046	24383	1448	400m.pg151_o3_native_lto.cx7_gcp_c2s60
396040	0	3098	27.8	2399.0	433.7	0.008	0.072	0.006	1.121	282779	52.6	0.714	40	170.2	324.2	NA	0.959	24473	1648	400m.pg152_o3_native_lto.cx7_gcp_c2s60
q100.1
q100.1: range queries with 100 insert/s per client
Performance metrics for all DBMS, not just the ones listed above. Some are normalized by throughput, others are not. Legend for results is here.
ips	qps	rps	rmbps	wps	wmbps	rpq	rkbpq	wpi	wkbpi	csps	cpups	cspq	cpupq	dbgb1	dbgb2	rss	maxop	p50	p99	tag
1976	189845	0	0.0	2873.6	74.5	0.000	0.000	1.454	38.594	677689	62.7	3.570	99	177.6	299.1	0.0	0.025	9414	9082	400m.pg1119_o3_native_lto.cx7_gcp_c2s60
1977	197494	0	0.0	2772.4	79.9	0.000	0.000	1.402	41.384	703046	63.0	3.560	96	171.1	293.7	0.0	0.023	9850	9494	400m.pg1214_o3_native_lto.cx7_gcp_c2s60
1976	199219	0	0.0	2578.1	72.6	0.000	0.000	1.305	37.645	709285	62.8	3.560	95	171.1	275.6	0.0	0.024	9898	9530	400m.pg1310_o3_native_lto.cx7_gcp_c2s60
1976	196892	0	0.0	2532.4	68.8	0.000	0.000	1.282	35.633	702693	62.7	3.569	96	171.1	315.6	0.0	0.028	9817	9477	400m.pg147_o3_native_lto.cx7_gcp_c2s60
1976	197884	0	0.0	2523.9	67.8	0.000	0.000	1.277	35.164	705334	62.9	3.564	95	171.1	303.9	0.0	0.025	9817	9477	400m.pg151_o3_native_lto.cx7_gcp_c2s60
1976	197851	0	0.0	2538.2	69.5	0.000	0.000	1.285	36.005	705631	62.7	3.566	95	171.1	303.2	0.0	0.024	9813	9494	400m.pg152_o3_native_lto.cx7_gcp_c2s60
q500.1
q500.1: range queries with 500 insert/s per client
Performance metrics for all DBMS, not just the ones listed above. Some are normalized by throughput, others are not. Legend for results is here.
ips	qps	rps	rmbps	wps	wmbps	rpq	rkbpq	wpi	wkbpi	csps	cpups	cspq	cpupq	dbgb1	dbgb2	rss	maxop	p50	p99	tag
9890	191245	0	0.0	5211.0	158.3	0.000	0.000	0.527	16.391	668357	63.9	3.495	100	183.7	264.2	0.0	0.133	9513	9078	400m.pg1119_o3_native_lto.cx7_gcp_c2s60
9885	200007	0	0.0	4794.9	156.4	0.000	0.000	0.485	16.204	697274	63.8	3.486	96	176.0	257.7	0.0	0.032	9893	9477	400m.pg1214_o3_native_lto.cx7_gcp_c2s60
9885	201186	0	0.0	4691.4	151.6	0.000	0.000	0.475	15.703	701820	63.7	3.488	95	176.0	243.7	0.0	0.072	9989	9498	400m.pg1310_o3_native_lto.cx7_gcp_c2s60
9885	198364	0	0.0	4593.5	143.8	0.000	0.000	0.465	14.902	694761	63.5	3.502	96	176.0	262.0	0.0	0.033	9909	9465	400m.pg147_o3_native_lto.cx7_gcp_c2s60
9885	198355	0	0.0	4565.5	143.8	0.000	0.000	0.462	14.900	694603	63.5	3.502	96	176.0	260.7	0.0	0.035	9813	9353	400m.pg151_o3_native_lto.cx7_gcp_c2s60
9885	198846	0	0.0	4572.0	143.9	0.000	0.000	0.463	14.903	696337	63.5	3.502	96	176.0	259.8	0.0	0.031	9913	9478	400m.pg152_o3_native_lto.cx7_gcp_c2s60
q1000.1
q1000.1: range queries with 1000 insert/s per client
Performance metrics for all DBMS, not just the ones listed above. Some are normalized by throughput, others are not. Legend for results is here.
ips	qps	rps	rmbps	wps	wmbps	rpq	rkbpq	wpi	wkbpi	csps	cpups	cspq	cpupq	dbgb1	dbgb2	rss	maxop	p50	p99	tag
19758	195503	152	1.4	5260.2	222.5	0.001	0.007	0.266	11.530	658328	65.4	3.367	100	197.2	266.4	0.0	0.443	9733	9110	400m.pg1119_o3_native_lto.cx7_gcp_c2s60
19769	205299	0	0.0	4435.9	218.3	0.000	0.000	0.224	11.307	688133	65.4	3.352	96	189.4	259.9	0.0	0.146	10261	9526	400m.pg1214_o3_native_lto.cx7_gcp_c2s60
19769	205778	0	0.0	4370.8	209.3	0.000	0.000	0.221	10.839	692687	65.3	3.366	95	189.4	252.7	0.0	0.053	10168	9513	400m.pg1310_o3_native_lto.cx7_gcp_c2s60
19769	203390	0	0.0	4751.6	203.2	0.000	0.000	0.240	10.528	686455	65.0	3.375	96	189.4	269.8	0.0	0.030	10101	9430	400m.pg147_o3_native_lto.cx7_gcp_c2s60
19769	203902	0	0.0	4750.1	205.0	0.000	0.000	0.240	10.616	688505	65.1	3.377	96	189.4	269.0	0.0	0.036	10153	9462	400m.pg151_o3_native_lto.cx7_gcp_c2s60
19769	203524	0	0.0	4752.0	204.9	0.000	0.000	0.240	10.613	687289	65.0	3.377	96	189.4	268.6	0.0	0.041	10121	9382	400m.pg152_o3_native_lto.cx7_gcp_c2s60
l.i0
- l.i0: load without secondary indexes
- Legend for results is here.
- Each entry lists the percentage of responses that fit in that bucket (slower than max time for previous bucket, faster than min time for next bucket).
Insert response time histogram
256us	1ms	4ms	16ms	64ms	256ms	1s	4s	16s	gt	max	tag
0.000	25.318	71.429	3.195	0.015	0.025	0.018	0.000	0.000	0.000	0.813	pg1119_o3_native_lto.cx7_gcp_c2s60
0.000	25.467	71.174	3.311	0.009	0.025	0.015	0.000	0.000	0.000	0.729	pg1214_o3_native_lto.cx7_gcp_c2s60
0.000	26.135	70.323	3.484	0.019	0.023	0.016	nonzero	0.000	0.000	1.290	pg1310_o3_native_lto.cx7_gcp_c2s60
0.000	22.426	74.038	3.478	0.019	0.025	0.013	0.001	0.000	0.000	1.364	pg147_o3_native_lto.cx7_gcp_c2s60
0.000	27.644	69.081	3.222	0.012	0.028	0.013	0.000	0.000	0.000	0.984	pg151_o3_native_lto.cx7_gcp_c2s60
0.000	27.447	69.365	3.137	0.015	0.024	0.012	0.001	0.000	0.000	1.151	pg152_o3_native_lto.cx7_gcp_c2s60
l.x
- l.x: create secondary indexes
- Legend for results is here.
- Each entry lists the percentage of responses that fit in that bucket (slower than max time for previous bucket, faster than min time for next bucket).
TODO - determine whether there is data for create index response time
l.i1
- l.i1: continue load after secondary indexes created
- Legend for results is here.
- Each entry lists the percentage of responses that fit in that bucket (slower than max time for previous bucket, faster than min time for next bucket).
Insert response time histogram
256us	1ms	4ms	16ms	64ms	256ms	1s	4s	16s	gt	max	tag
0.000	0.000	94.637	4.305	1.015	0.026	0.016	0.001	0.000	0.000	1.199	pg1119_o3_native_lto.cx7_gcp_c2s60
0.000	0.000	94.561	4.407	0.992	0.026	0.013	0.000	0.000	0.000	0.865	pg1214_o3_native_lto.cx7_gcp_c2s60
0.000	0.000	94.303	4.575	1.079	0.027	0.017	0.000	0.000	0.000	0.775	pg1310_o3_native_lto.cx7_gcp_c2s60
0.000	0.000	94.401	4.571	0.993	0.022	0.012	0.001	0.000	0.000	1.155	pg147_o3_native_lto.cx7_gcp_c2s60
0.000	0.000	94.504	4.490	0.968	0.020	0.018	nonzero	0.000	0.000	1.046	pg151_o3_native_lto.cx7_gcp_c2s60
0.000	0.000	94.562	4.391	1.005	0.026	0.016	0.000	0.000	0.000	0.959	pg152_o3_native_lto.cx7_gcp_c2s60
q100.1
- q100.1: range queries with 100 insert/s per client
- Legend for results is here.
- Each entry lists the percentage of responses that fit in that bucket (slower than max time for previous bucket, faster than min time for next bucket).
Query response time histogram
256us	1ms	4ms	16ms	64ms	256ms	1s	4s	16s	gt	max	tag
99.971	0.022	0.006	0.001	nonzero	0.000	0.000	0.000	0.000	0.000	0.025	pg1119_o3_native_lto.cx7_gcp_c2s60
99.975	0.018	0.006	0.001	nonzero	0.000	0.000	0.000	0.000	0.000	0.023	pg1214_o3_native_lto.cx7_gcp_c2s60
99.977	0.016	0.006	0.001	nonzero	0.000	0.000	0.000	0.000	0.000	0.024	pg1310_o3_native_lto.cx7_gcp_c2s60
99.975	0.018	0.006	0.001	nonzero	0.000	0.000	0.000	0.000	0.000	0.028	pg147_o3_native_lto.cx7_gcp_c2s60
99.976	0.018	0.006	0.001	nonzero	0.000	0.000	0.000	0.000	0.000	0.025	pg151_o3_native_lto.cx7_gcp_c2s60
99.976	0.017	0.006	0.001	nonzero	0.000	0.000	0.000	0.000	0.000	0.024	pg152_o3_native_lto.cx7_gcp_c2s60
Insert response time histogram
256us	1ms	4ms	16ms	64ms	256ms	1s	4s	16s	gt	max	tag
0.000	0.000	98.812	0.992	0.196	0.000	0.000	0.000	0.000	0.000	0.047	pg1119_o3_native_lto.cx7_gcp_c2s60
0.000	0.000	98.608	1.206	0.186	0.000	0.000	0.000	0.000	0.000	0.040	pg1214_o3_native_lto.cx7_gcp_c2s60
0.000	0.000	97.158	2.371	0.468	0.003	0.000	0.000	0.000	0.000	0.118	pg1310_o3_native_lto.cx7_gcp_c2s60
0.000	0.000	99.018	0.808	0.174	0.000	0.000	0.000	0.000	0.000	0.036	pg147_o3_native_lto.cx7_gcp_c2s60
0.000	0.000	98.606	1.081	0.311	0.003	0.000	0.000	0.000	0.000	0.090	pg151_o3_native_lto.cx7_gcp_c2s60
0.000	0.000	98.579	1.211	0.210	0.000	0.000	0.000	0.000	0.000	0.032	pg152_o3_native_lto.cx7_gcp_c2s60
q500.1
- q500.1: range queries with 500 insert/s per client
- Legend for results is here.
- Each entry lists the percentage of responses that fit in that bucket (slower than max time for previous bucket, faster than min time for next bucket).
Query response time histogram
256us	1ms	4ms	16ms	64ms	256ms	1s	4s	16s	gt	max	tag
99.910	0.060	0.027	0.003	nonzero	nonzero	0.000	0.000	0.000	0.000	0.133	pg1119_o3_native_lto.cx7_gcp_c2s60
99.919	0.052	0.026	0.003	nonzero	0.000	0.000	0.000	0.000	0.000	0.032	pg1214_o3_native_lto.cx7_gcp_c2s60
99.920	0.052	0.026	0.003	nonzero	nonzero	0.000	0.000	0.000	0.000	0.072	pg1310_o3_native_lto.cx7_gcp_c2s60
99.917	0.053	0.026	0.003	nonzero	0.000	0.000	0.000	0.000	0.000	0.033	pg147_o3_native_lto.cx7_gcp_c2s60
99.919	0.052	0.026	0.003	nonzero	0.000	0.000	0.000	0.000	0.000	0.035	pg151_o3_native_lto.cx7_gcp_c2s60
99.919	0.052	0.026	0.003	nonzero	0.000	0.000	0.000	0.000	0.000	0.031	pg152_o3_native_lto.cx7_gcp_c2s60
Insert response time histogram
256us	1ms	4ms	16ms	64ms	256ms	1s	4s	16s	gt	max	tag
0.000	0.000	52.091	28.115	19.492	0.298	0.005	0.000	0.000	0.000	0.319	pg1119_o3_native_lto.cx7_gcp_c2s60
0.000	0.000	51.870	27.890	19.893	0.342	0.005	0.000	0.000	0.000	0.334	pg1214_o3_native_lto.cx7_gcp_c2s60
0.000	0.000	52.274	28.005	19.395	0.325	0.000	0.000	0.000	0.000	0.166	pg1310_o3_native_lto.cx7_gcp_c2s60
0.000	0.000	52.797	27.533	19.385	0.284	0.000	0.000	0.000	0.000	0.174	pg147_o3_native_lto.cx7_gcp_c2s60
0.000	0.000	52.851	27.141	19.714	0.293	0.000	0.000	0.000	0.000	0.164	pg151_o3_native_lto.cx7_gcp_c2s60
0.000	0.000	52.730	27.138	19.853	0.279	0.000	0.000	0.000	0.000	0.174	pg152_o3_native_lto.cx7_gcp_c2s60
q1000.1
- q1000.1: range queries with 1000 insert/s per client
- Legend for results is here.
- Each entry lists the percentage of responses that fit in that bucket (slower than max time for previous bucket, faster than min time for next bucket).
Query response time histogram
256us	1ms	4ms	16ms	64ms	256ms	1s	4s	16s	gt	max	tag
99.849	0.109	0.038	0.003	nonzero	nonzero	nonzero	0.000	0.000	0.000	0.443	pg1119_o3_native_lto.cx7_gcp_c2s60
99.869	0.091	0.037	0.004	nonzero	nonzero	0.000	0.000	0.000	0.000	0.146	pg1214_o3_native_lto.cx7_gcp_c2s60
99.871	0.089	0.036	0.004	nonzero	0.000	0.000	0.000	0.000	0.000	0.053	pg1310_o3_native_lto.cx7_gcp_c2s60
99.867	0.093	0.037	0.004	nonzero	0.000	0.000	0.000	0.000	0.000	0.030	pg147_o3_native_lto.cx7_gcp_c2s60
99.869	0.090	0.037	0.004	nonzero	0.000	0.000	0.000	0.000	0.000	0.036	pg151_o3_native_lto.cx7_gcp_c2s60
99.867	0.092	0.037	0.004	nonzero	0.000	0.000	0.000	0.000	0.000	0.041	pg152_o3_native_lto.cx7_gcp_c2s60
Insert response time histogram
256us	1ms	4ms	16ms	64ms	256ms	1s	4s	16s	gt	max	tag
0.000	0.000	66.895	22.762	10.093	0.246	0.001	0.003	0.000	0.000	1.889	pg1119_o3_native_lto.cx7_gcp_c2s60
0.000	0.000	60.416	26.150	13.099	0.335	nonzero	0.000	0.000	0.000	0.273	pg1214_o3_native_lto.cx7_gcp_c2s60
0.000	0.000	62.085	25.567	12.043	0.304	0.000	0.000	0.000	0.000	0.221	pg1310_o3_native_lto.cx7_gcp_c2s60
0.000	0.000	61.090	26.286	12.363	0.261	0.000	0.000	0.000	0.000	0.179	pg147_o3_native_lto.cx7_gcp_c2s60
0.000	0.000	61.050	26.220	12.487	0.243	0.000	0.000	0.000	0.000	0.243	pg151_o3_native_lto.cx7_gcp_c2s60
0.000	0.000	60.347	26.725	12.675	0.252	0.000	0.000	0.000	0.000	0.174	pg152_o3_native_lto.cx7_gcp_c2s60