Introduction
This is a report for the insert benchmark with 400M docs and 20 client(s). It is generated by scripts (bash, awk, sed) and Tufte might not be impressed. An overview of the insert benchmark is here and a short update is here. Below, by DBMS, I mean DBMS+version.config. An example is my8020.c10b40 where my means MySQL, 8020 is version 8.0.20 and c10b40 is the name for the configuration file.
The test server is a c2-standard-60 from GCP with 30 cores, hyperthreading disabled, 240G RAM and 3T from XFS and SW RAID 0 striped over 8 local NVMe drives. The benchmark was run with 20 clients and there were 1 or 2 connections per client (1 for queries, 1 for inserts). The benchmark loads 400M rows without secondary indexes, creates secondary indexes, loads another 400M rows then does 3 read+write tests for one hour each that do queries as fast as possible with 100, 500 and then 1000 writes/second/client concurrent with the queries. Each read-write test runs for 1800 seconds. The test was configured to use one table. The database fits in the OS page cache but not the DBMS buffer pool. Clients and the DBMS share one server. The per-database configs are in the per-database subdirectories here.
The tested DBMS are:
- pg1119_o3_native_lto.cx7_gcp_c2s60_4g - Postgres 11.19, the cx7_gcp_c2s60_4g config and a build that uses -O3 -march=native -mtune=native -flto (link-time optimization)
- pg1214_o3_native_lto.cx7_gcp_c2s60_4g - Postgres 12.14, the cx7_gcp_c2s60_4g config and a build that uses -O3 -march=native -mtune=native -flto (link-time optimization)
- pg1310_o3_native_lto.cx7_gcp_c2s60_4g - Postgres 13.10, the cx7_gcp_c2s60_4g config and a build that uses -O3 -march=native -mtune=native -flto (link-time optimization)
- pg147_o3_native_lto.cx7_gcp_c2s60_4g - Postgres 14.7, the cx7_gcp_c2s60_4g config and a build that uses -O3 -march=native -mtune=native -flto (link-time optimization)
- pg151_o3_native_lto.cx7_gcp_c2s60_4g - Postgres 15.1, the cx7_gcp_c2s60_4g config and a build that uses -O3 -march=native -mtune=native -flto (link-time optimization)
- pg152_o3_native_lto.cx7_gcp_c2s60_4g - Postgres 15.2, the cx7_gcp_c2s60_4g config and a build that uses -O3 -march=native -mtune=native -flto (link-time optimization)
Contents
- Summary
- l.i0: load without secondary indexes
- l.x: create secondary indexes
- l.i1: continue load after secondary indexes created
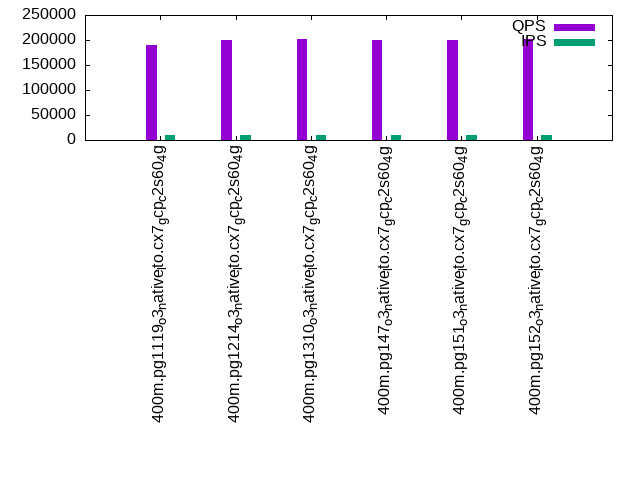
- q100.1: range queries with 100 insert/s per client
- q500.1: range queries with 500 insert/s per client
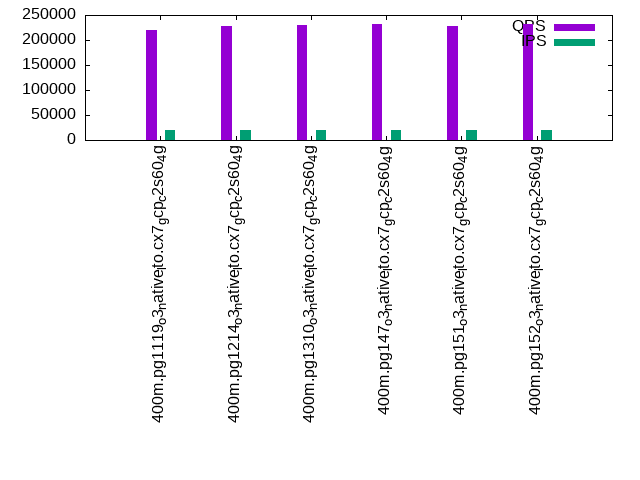
- q1000.1: range queries with 1000 insert/s per client
Summary
The numbers are inserts/s for l.i0 and l.i1, indexed docs (or rows) /s for l.x and queries/s for q*.2. The values are the average rate over the entire test for inserts (IPS) and queries (QPS). The range of values for IPS and QPS is split into 3 parts: bottom 25%, middle 50%, top 25%. Values in the bottom 25% have a red background, values in the top 25% have a green background and values in the middle have no color. A gray background is used for values that can be ignored because the DBMS did not sustain the target insert rate. Red backgrounds are not used when the minimum value is within 80% of the max value.
| dbms | l.i0 | l.x | l.i1 | q100.1 | q500.1 | q1000.1 |
|---|---|---|---|---|---|---|
| 400m.pg1119_o3_native_lto.cx7_gcp_c2s60_4g | 1129944 | 312090 | 33758 | 188553 | 190603 | 219889 |
| 400m.pg1214_o3_native_lto.cx7_gcp_c2s60_4g | 1120448 | 310637 | 33650 | 198191 | 199459 | 227352 |
| 400m.pg1310_o3_native_lto.cx7_gcp_c2s60_4g | 1101928 | 308243 | 33667 | 200022 | 202718 | 229618 |
| 400m.pg147_o3_native_lto.cx7_gcp_c2s60_4g | 1108033 | 302648 | 33428 | 199166 | 200818 | 232711 |
| 400m.pg151_o3_native_lto.cx7_gcp_c2s60_4g | 1104972 | 300150 | 33470 | 197081 | 199585 | 227015 |
| 400m.pg152_o3_native_lto.cx7_gcp_c2s60_4g | 1120448 | 301734 | 33484 | 199988 | 202582 | 231098 |
This lists the average rate of inserts/s for the tests that do inserts concurrent with queries. For such tests the query rate is listed in the table above. The read+write tests are setup so that the insert rate should match the target rate every second. Cells that are not at least 95% of the target have a red background to indicate a failure to satisfy the target.
| dbms | q100.1 | q500.1 | q1000.1 |
|---|---|---|---|
| pg1119_o3_native_lto.cx7_gcp_c2s60_4g | 1976 | 9885 | 19683 |
| pg1214_o3_native_lto.cx7_gcp_c2s60_4g | 1976 | 9890 | 19661 |
| pg1310_o3_native_lto.cx7_gcp_c2s60_4g | 1976 | 9885 | 19672 |
| pg147_o3_native_lto.cx7_gcp_c2s60_4g | 1976 | 9885 | 19694 |
| pg151_o3_native_lto.cx7_gcp_c2s60_4g | 1976 | 9885 | 19683 |
| pg152_o3_native_lto.cx7_gcp_c2s60_4g | 1976 | 9885 | 19694 |
| target | 2000 | 10000 | 20000 |
l.i0
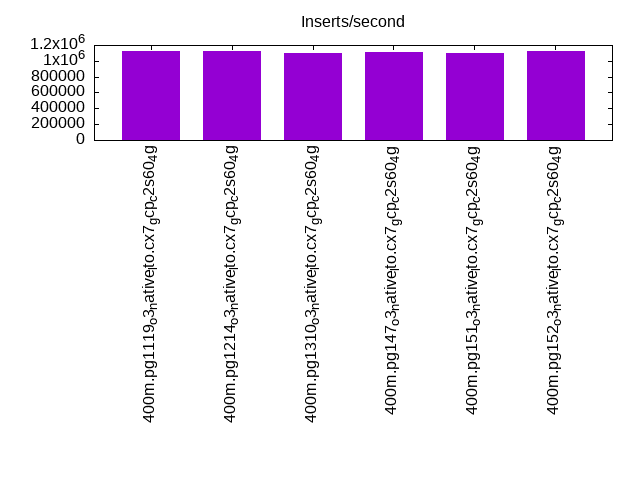
l.i0: load without secondary indexes. Graphs for performance per 1-second interval are here.
Average throughput:
Insert response time histogram: each cell has the percentage of responses that take <= the time in the header and max is the max response time in seconds. For the max column values in the top 25% of the range have a red background and in the bottom 25% of the range have a green background. The red background is not used when the min value is within 80% of the max value.
| dbms | 256us | 1ms | 4ms | 16ms | 64ms | 256ms | 1s | 4s | 16s | gt | max |
|---|---|---|---|---|---|---|---|---|---|---|---|
| pg1119_o3_native_lto.cx7_gcp_c2s60_4g | 28.387 | 68.721 | 2.800 | 0.050 | 0.029 | 0.012 | 0.760 | ||||
| pg1214_o3_native_lto.cx7_gcp_c2s60_4g | 26.679 | 70.318 | 2.939 | 0.022 | 0.025 | 0.016 | 0.001 | 1.283 | |||
| pg1310_o3_native_lto.cx7_gcp_c2s60_4g | 28.161 | 68.546 | 3.218 | 0.029 | 0.031 | 0.014 | 0.001 | 1.307 | |||
| pg147_o3_native_lto.cx7_gcp_c2s60_4g | 26.313 | 70.766 | 2.854 | 0.024 | 0.024 | 0.018 | 0.756 | ||||
| pg151_o3_native_lto.cx7_gcp_c2s60_4g | 28.125 | 68.867 | 2.944 | 0.023 | 0.022 | 0.017 | 0.001 | 1.273 | |||
| pg152_o3_native_lto.cx7_gcp_c2s60_4g | 30.850 | 66.192 | 2.886 | 0.025 | 0.031 | 0.016 | 0.001 | 1.153 |
Performance metrics for the DBMS listed above. Some are normalized by throughput, others are not. Legend for results is here.
ips	qps	rps	rmbps	wps	wmbps	rpq	rkbpq	wpi	wkbpi	csps	cpups	cspq	cpupq	dbgb1	dbgb2	rss	maxop	p50	p99	tag
1129944	0	195	2.1	2368.0	482.6	0.000	0.002	0.002	0.437	336807	58.6	0.298	16	44.2	114.2	NA	0.760	62754	12486	400m.pg1119_o3_native_lto.cx7_gcp_c2s60_4g
1120448	0	320	2.5	2481.0	469.8	0.000	0.002	0.002	0.429	308124	58.1	0.275	16	43.0	112.4	NA	1.283	62158	12186	400m.pg1214_o3_native_lto.cx7_gcp_c2s60_4g
1101928	0	132	3.8	2161.3	466.1	0.000	0.004	0.002	0.433	330578	56.9	0.300	15	43.0	112.5	0.0	1.307	61632	10793	400m.pg1310_o3_native_lto.cx7_gcp_c2s60_4g
1108033	0	206	4.4	2265.0	469.1	0.000	0.004	0.002	0.433	313624	57.1	0.283	15	43.0	112.4	NA	0.756	62041	8990	400m.pg147_o3_native_lto.cx7_gcp_c2s60_4g
1104972	0	204	4.8	2258.8	464.8	0.000	0.004	0.002	0.431	321474	56.8	0.291	15	43.0	112.6	NA	1.273	61932	5194	400m.pg151_o3_native_lto.cx7_gcp_c2s60_4g
1120448	0	207	4.7	2271.6	476.3	0.000	0.004	0.002	0.435	323412	56.7	0.289	15	43.0	112.5	NA	1.153	62732	10189	400m.pg152_o3_native_lto.cx7_gcp_c2s60_4g
l.x
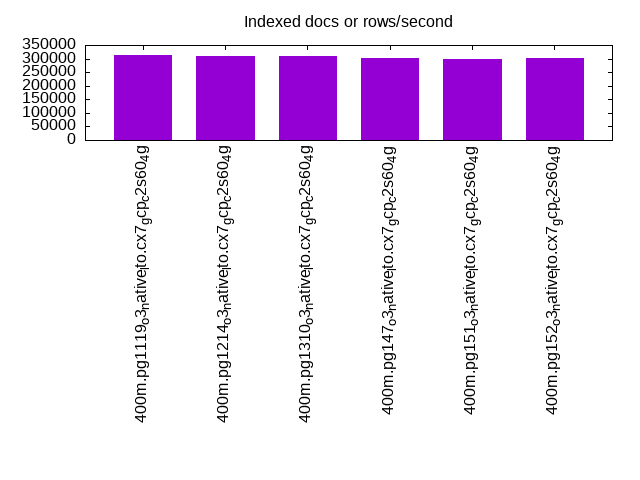
l.x: create secondary indexes.
Average throughput:
Performance metrics for the DBMS listed above. Some are normalized by throughput, others are not. Legend for results is here.
ips	qps	rps	rmbps	wps	wmbps	rpq	rkbpq	wpi	wkbpi	csps	cpups	cspq	cpupq	dbgb1	dbgb2	rss	maxop	p50	p99	tag
312090	0	2091	44.6	521.2	113.0	0.007	0.146	0.002	0.371	1861	3.4	0.006	3	79.5	152.9	0.0	0.003	NA	NA	400m.pg1119_o3_native_lto.cx7_gcp_c2s60_4g
310637	0	1457	44.0	596.7	115.3	0.005	0.145	0.002	0.380	1937	3.4	0.006	3	78.3	150.2	0.0	0.002	NA	NA	400m.pg1214_o3_native_lto.cx7_gcp_c2s60_4g
308243	0	1726	42.0	439.0	103.9	0.006	0.139	0.001	0.345	1903	3.4	0.006	3	78.3	147.7	0.0	0.002	NA	NA	400m.pg1310_o3_native_lto.cx7_gcp_c2s60_4g
302648	0	2093	41.7	478.4	110.0	0.007	0.141	0.002	0.372	1833	3.4	0.006	3	78.3	162.6	0.0	0.002	NA	NA	400m.pg147_o3_native_lto.cx7_gcp_c2s60_4g
300150	0	3117	43.3	506.1	114.9	0.010	0.148	0.002	0.392	2039	3.3	0.007	3	78.3	162.3	0.0	0.002	NA	NA	400m.pg151_o3_native_lto.cx7_gcp_c2s60_4g
301734	0	2211	43.4	517.5	117.7	0.007	0.147	0.002	0.399	2043	3.3	0.007	3	78.3	162.9	0.0	0.002	NA	NA	400m.pg152_o3_native_lto.cx7_gcp_c2s60_4g
l.i1
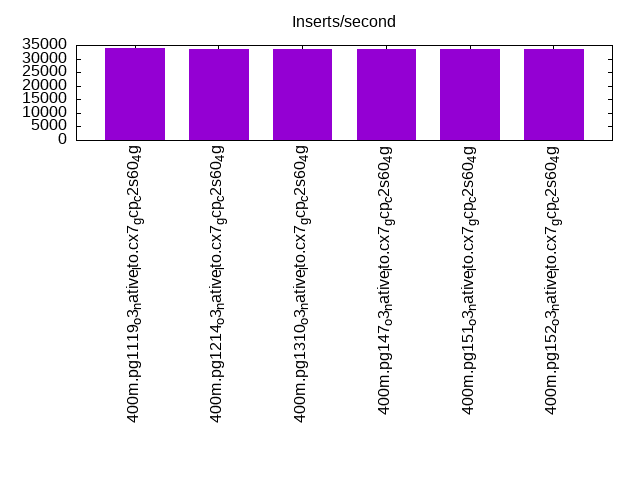
l.i1: continue load after secondary indexes created. Graphs for performance per 1-second interval are here.
Average throughput:
Insert response time histogram: each cell has the percentage of responses that take <= the time in the header and max is the max response time in seconds. For the max column values in the top 25% of the range have a red background and in the bottom 25% of the range have a green background. The red background is not used when the min value is within 80% of the max value.
| dbms | 256us | 1ms | 4ms | 16ms | 64ms | 256ms | 1s | 4s | 16s | gt | max |
|---|---|---|---|---|---|---|---|---|---|---|---|
| pg1119_o3_native_lto.cx7_gcp_c2s60_4g | 0.194 | 6.555 | 87.950 | 5.300 | nonzero | 0.688 | |||||
| pg1214_o3_native_lto.cx7_gcp_c2s60_4g | 0.209 | 6.571 | 87.937 | 5.282 | 0.001 | 0.623 | |||||
| pg1310_o3_native_lto.cx7_gcp_c2s60_4g | 0.209 | 6.256 | 88.214 | 5.320 | 0.001 | 0.650 | |||||
| pg147_o3_native_lto.cx7_gcp_c2s60_4g | 0.056 | 5.848 | 88.743 | 5.351 | 0.002 | 0.430 | |||||
| pg151_o3_native_lto.cx7_gcp_c2s60_4g | 0.058 | 5.720 | 88.869 | 5.352 | 0.002 | 0.646 | |||||
| pg152_o3_native_lto.cx7_gcp_c2s60_4g | 0.059 | 5.799 | 88.801 | 5.339 | 0.003 | 0.415 |
Performance metrics for the DBMS listed above. Some are normalized by throughput, others are not. Legend for results is here.
ips	qps	rps	rmbps	wps	wmbps	rpq	rkbpq	wpi	wkbpi	csps	cpups	cspq	cpupq	dbgb1	dbgb2	rss	maxop	p50	p99	tag
33758	0	71047	658.0	61534.1	596.1	2.105	19.960	1.823	18.082	130209	12.8	3.857	114	176.4	241.8	0.0	0.688	1698	749	400m.pg1119_o3_native_lto.cx7_gcp_c2s60_4g
33650	0	72355	664.8	61181.5	592.8	2.150	20.232	1.818	18.040	130254	12.6	3.871	112	170.2	235.1	0.0	0.623	1698	749	400m.pg1214_o3_native_lto.cx7_gcp_c2s60_4g
33667	0	70250	656.6	61298.0	596.1	2.087	19.972	1.821	18.131	130376	12.6	3.872	112	170.2	241.6	0.0	0.650	1698	749	400m.pg1310_o3_native_lto.cx7_gcp_c2s60_4g
33428	0	71455	661.7	60900.2	583.5	2.138	20.270	1.822	17.874	129296	12.5	3.868	112	170.2	251.4	0.0	0.430	1698	749	400m.pg147_o3_native_lto.cx7_gcp_c2s60_4g
33470	0	71636	663.3	60894.0	584.4	2.140	20.295	1.819	17.879	129469	12.5	3.868	112	170.2	250.2	0.0	0.646	1698	749	400m.pg151_o3_native_lto.cx7_gcp_c2s60_4g
33484	0	71454	663.1	60922.3	584.9	2.134	20.277	1.819	17.888	129359	12.5	3.863	112	170.2	252.0	0.0	0.415	1698	749	400m.pg152_o3_native_lto.cx7_gcp_c2s60_4g
q100.1
q100.1: range queries with 100 insert/s per client. Graphs for performance per 1-second interval are here.
Average throughput:
Query response time histogram: each cell has the percentage of responses that take <= the time in the header and max is the max response time in seconds. For max values in the top 25% of the range have a red background and in the bottom 25% of the range have a green background. The red background is not used when the min value is within 80% of the max value.
| dbms | 256us | 1ms | 4ms | 16ms | 64ms | 256ms | 1s | 4s | 16s | gt | max |
|---|---|---|---|---|---|---|---|---|---|---|---|
| pg1119_o3_native_lto.cx7_gcp_c2s60_4g | 99.912 | 0.085 | 0.002 | 0.001 | nonzero | 0.032 | |||||
| pg1214_o3_native_lto.cx7_gcp_c2s60_4g | 99.926 | 0.071 | 0.002 | 0.001 | nonzero | 0.026 | |||||
| pg1310_o3_native_lto.cx7_gcp_c2s60_4g | 99.927 | 0.070 | 0.002 | 0.001 | nonzero | nonzero | 0.230 | ||||
| pg147_o3_native_lto.cx7_gcp_c2s60_4g | 99.926 | 0.071 | 0.002 | 0.001 | nonzero | 0.029 | |||||
| pg151_o3_native_lto.cx7_gcp_c2s60_4g | 99.922 | 0.075 | 0.002 | 0.001 | nonzero | 0.027 | |||||
| pg152_o3_native_lto.cx7_gcp_c2s60_4g | 99.927 | 0.070 | 0.002 | 0.001 | nonzero | 0.027 |
Insert response time histogram: each cell has the percentage of responses that take <= the time in the header and max is the max response time in seconds. For max values in the top 25% of the range have a red background and in the bottom 25% of the range have a green background. The red background is not used when the min value is within 80% of the max value.
| dbms | 256us | 1ms | 4ms | 16ms | 64ms | 256ms | 1s | 4s | 16s | gt | max |
|---|---|---|---|---|---|---|---|---|---|---|---|
| pg1119_o3_native_lto.cx7_gcp_c2s60_4g | 0.397 | 99.576 | 0.026 | 0.126 | |||||||
| pg1214_o3_native_lto.cx7_gcp_c2s60_4g | 0.603 | 99.392 | 0.004 | 0.001 | 0.322 | ||||||
| pg1310_o3_native_lto.cx7_gcp_c2s60_4g | 0.572 | 99.251 | 0.111 | 0.065 | 0.426 | ||||||
| pg147_o3_native_lto.cx7_gcp_c2s60_4g | 0.696 | 99.207 | 0.097 | 0.252 | |||||||
| pg151_o3_native_lto.cx7_gcp_c2s60_4g | 0.504 | 99.431 | 0.065 | 0.184 | |||||||
| pg152_o3_native_lto.cx7_gcp_c2s60_4g | 0.690 | 99.239 | 0.036 | 0.035 | 0.479 |
Performance metrics for the DBMS listed above. Some are normalized by throughput, others are not. Legend for results is here.
ips	qps	rps	rmbps	wps	wmbps	rpq	rkbpq	wpi	wkbpi	csps	cpups	cspq	cpupq	dbgb1	dbgb2	rss	maxop	p50	p99	tag
1976	188553	3822	38.4	4026.4	50.5	0.020	0.209	2.038	26.163	674843	63.0	3.579	100	177.6	220.7	0.0	0.032	9338	8970	400m.pg1119_o3_native_lto.cx7_gcp_c2s60_4g
1976	198191	3800	38.6	3962.6	50.1	0.019	0.200	2.006	25.980	707664	62.7	3.571	95	171.1	219.9	0.0	0.026	9781	9401	400m.pg1214_o3_native_lto.cx7_gcp_c2s60_4g
1976	200022	4026	40.0	4149.8	51.4	0.020	0.205	2.100	26.616	711185	62.7	3.556	94	171.1	219.8	0.0	0.230	9946	9494	400m.pg1310_o3_native_lto.cx7_gcp_c2s60_4g
1976	199166	3752	38.3	4123.0	50.7	0.019	0.197	2.087	26.268	711014	62.6	3.570	94	171.1	232.3	0.0	0.029	9925	9541	400m.pg147_o3_native_lto.cx7_gcp_c2s60_4g
1976	197081	3925	39.2	4121.9	51.4	0.020	0.204	2.086	26.627	704162	62.6	3.573	95	171.1	232.4	0.0	0.027	9749	9338	400m.pg151_o3_native_lto.cx7_gcp_c2s60_4g
1976	199988	3761	38.6	4124.0	51.0	0.019	0.198	2.087	26.427	713561	62.6	3.568	94	171.1	232.2	0.0	0.027	10021	9573	400m.pg152_o3_native_lto.cx7_gcp_c2s60_4g
q500.1
q500.1: range queries with 500 insert/s per client. Graphs for performance per 1-second interval are here.
Average throughput:
Query response time histogram: each cell has the percentage of responses that take <= the time in the header and max is the max response time in seconds. For max values in the top 25% of the range have a red background and in the bottom 25% of the range have a green background. The red background is not used when the min value is within 80% of the max value.
| dbms | 256us | 1ms | 4ms | 16ms | 64ms | 256ms | 1s | 4s | 16s | gt | max |
|---|---|---|---|---|---|---|---|---|---|---|---|
| pg1119_o3_native_lto.cx7_gcp_c2s60_4g | 99.645 | 0.343 | 0.011 | 0.001 | nonzero | 0.028 | |||||
| pg1214_o3_native_lto.cx7_gcp_c2s60_4g | 99.689 | 0.299 | 0.011 | 0.001 | nonzero | nonzero | 0.226 | ||||
| pg1310_o3_native_lto.cx7_gcp_c2s60_4g | 99.694 | 0.294 | 0.011 | 0.001 | nonzero | 0.028 | |||||
| pg147_o3_native_lto.cx7_gcp_c2s60_4g | 99.703 | 0.285 | 0.011 | 0.001 | nonzero | 0.028 | |||||
| pg151_o3_native_lto.cx7_gcp_c2s60_4g | 99.685 | 0.304 | 0.011 | 0.001 | nonzero | 0.027 | |||||
| pg152_o3_native_lto.cx7_gcp_c2s60_4g | 99.708 | 0.280 | 0.011 | 0.001 | nonzero | 0.030 |
Insert response time histogram: each cell has the percentage of responses that take <= the time in the header and max is the max response time in seconds. For max values in the top 25% of the range have a red background and in the bottom 25% of the range have a green background. The red background is not used when the min value is within 80% of the max value.
| dbms | 256us | 1ms | 4ms | 16ms | 64ms | 256ms | 1s | 4s | 16s | gt | max |
|---|---|---|---|---|---|---|---|---|---|---|---|
| pg1119_o3_native_lto.cx7_gcp_c2s60_4g | 0.357 | 99.568 | 0.075 | 0.254 | |||||||
| pg1214_o3_native_lto.cx7_gcp_c2s60_4g | 0.536 | 99.410 | 0.054 | nonzero | 0.269 | ||||||
| pg1310_o3_native_lto.cx7_gcp_c2s60_4g | 0.563 | 99.417 | 0.020 | 0.152 | |||||||
| pg147_o3_native_lto.cx7_gcp_c2s60_4g | 0.838 | 99.131 | 0.029 | 0.002 | 0.272 | ||||||
| pg151_o3_native_lto.cx7_gcp_c2s60_4g | 0.674 | 99.282 | 0.044 | 0.188 | |||||||
| pg152_o3_native_lto.cx7_gcp_c2s60_4g | 0.878 | 99.089 | 0.026 | 0.007 | 0.329 |
Performance metrics for the DBMS listed above. Some are normalized by throughput, others are not. Legend for results is here.
ips	qps	rps	rmbps	wps	wmbps	rpq	rkbpq	wpi	wkbpi	csps	cpups	cspq	cpupq	dbgb1	dbgb2	rss	maxop	p50	p99	tag
9885	190603	18171	186.0	19877.3	210.6	0.095	1.000	2.011	21.821	661225	65.8	3.469	104	183.7	226.3	0.0	0.028	9450	8842	400m.pg1119_o3_native_lto.cx7_gcp_c2s60_4g
9890	199459	18235	186.0	19514.5	208.0	0.091	0.955	1.973	21.539	690985	65.3	3.464	98	176.0	220.6	0.0	0.226	9861	9206	400m.pg1214_o3_native_lto.cx7_gcp_c2s60_4g
9885	202718	18271	186.2	19566.9	209.7	0.090	0.940	1.980	21.721	697248	65.6	3.439	97	176.0	220.0	0.0	0.028	10053	9381	400m.pg1310_o3_native_lto.cx7_gcp_c2s60_4g
9885	200818	17715	184.1	19528.4	208.1	0.088	0.939	1.976	21.558	695673	65.4	3.464	98	176.0	229.6	0.0	0.028	9989	9334	400m.pg147_o3_native_lto.cx7_gcp_c2s60_4g
9885	199585	17868	184.6	19525.1	208.3	0.090	0.947	1.975	21.574	691791	65.4	3.466	98	176.0	229.6	0.0	0.027	9861	9206	400m.pg151_o3_native_lto.cx7_gcp_c2s60_4g
9885	202582	17609	183.8	19534.4	208.8	0.087	0.929	1.976	21.629	699796	65.4	3.454	97	176.0	229.8	0.0	0.030	10053	9338	400m.pg152_o3_native_lto.cx7_gcp_c2s60_4g
q1000.1
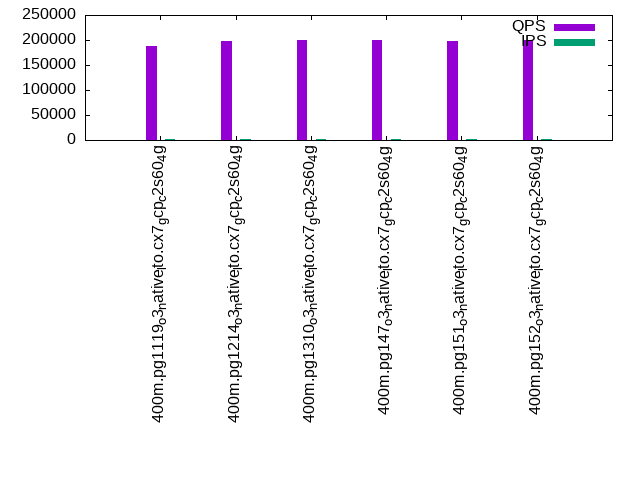
q1000.1: range queries with 1000 insert/s per client. Graphs for performance per 1-second interval are here.
Average throughput:
Query response time histogram: each cell has the percentage of responses that take <= the time in the header and max is the max response time in seconds. For max values in the top 25% of the range have a red background and in the bottom 25% of the range have a green background. The red background is not used when the min value is within 80% of the max value.
| dbms | 256us | 1ms | 4ms | 16ms | 64ms | 256ms | 1s | 4s | 16s | gt | max |
|---|---|---|---|---|---|---|---|---|---|---|---|
| pg1119_o3_native_lto.cx7_gcp_c2s60_4g | 99.426 | 0.551 | 0.022 | 0.002 | nonzero | 0.042 | |||||
| pg1214_o3_native_lto.cx7_gcp_c2s60_4g | 99.477 | 0.503 | 0.019 | 0.001 | nonzero | 0.064 | |||||
| pg1310_o3_native_lto.cx7_gcp_c2s60_4g | 99.480 | 0.500 | 0.019 | 0.001 | nonzero | 0.036 | |||||
| pg147_o3_native_lto.cx7_gcp_c2s60_4g | 99.512 | 0.469 | 0.018 | 0.001 | nonzero | nonzero | 0.071 | ||||
| pg151_o3_native_lto.cx7_gcp_c2s60_4g | 99.481 | 0.499 | 0.018 | 0.001 | nonzero | 0.053 | |||||
| pg152_o3_native_lto.cx7_gcp_c2s60_4g | 99.512 | 0.470 | 0.017 | 0.001 | nonzero | nonzero | 0.069 |
Insert response time histogram: each cell has the percentage of responses that take <= the time in the header and max is the max response time in seconds. For max values in the top 25% of the range have a red background and in the bottom 25% of the range have a green background. The red background is not used when the min value is within 80% of the max value.
| dbms | 256us | 1ms | 4ms | 16ms | 64ms | 256ms | 1s | 4s | 16s | gt | max |
|---|---|---|---|---|---|---|---|---|---|---|---|
| pg1119_o3_native_lto.cx7_gcp_c2s60_4g | 1.098 | 93.540 | 5.362 | nonzero | 0.285 | ||||||
| pg1214_o3_native_lto.cx7_gcp_c2s60_4g | 1.597 | 93.272 | 5.128 | 0.003 | 0.552 | ||||||
| pg1310_o3_native_lto.cx7_gcp_c2s60_4g | 1.965 | 92.903 | 5.131 | 0.001 | 0.506 | ||||||
| pg147_o3_native_lto.cx7_gcp_c2s60_4g | 1.926 | 92.982 | 5.093 | nonzero | 0.262 | ||||||
| pg151_o3_native_lto.cx7_gcp_c2s60_4g | 2.221 | 92.786 | 4.992 | 0.001 | 0.277 | ||||||
| pg152_o3_native_lto.cx7_gcp_c2s60_4g | 2.145 | 92.861 | 4.993 | 0.001 | 0.411 |
Performance metrics for the DBMS listed above. Some are normalized by throughput, others are not. Legend for results is here.
ips	qps	rps	rmbps	wps	wmbps	rpq	rkbpq	wpi	wkbpi	csps	cpups	cspq	cpupq	dbgb1	dbgb2	rss	maxop	p50	p99	tag
19683	219889	37761	383.2	37891.8	401.6	0.172	1.785	1.925	20.894	677985	70.0	3.083	96	197.2	256.7	0.0	0.042	11028	8075	400m.pg1119_o3_native_lto.cx7_gcp_c2s60_4g
19661	227352	38049	384.6	37303.1	400.8	0.167	1.732	1.897	20.873	705286	69.7	3.102	92	189.4	249.9	0.0	0.064	11092	8279	400m.pg1214_o3_native_lto.cx7_gcp_c2s60_4g
19672	229618	38012	384.4	37321.3	400.0	0.166	1.714	1.897	20.822	711809	69.6	3.100	91	189.4	249.9	0.0	0.036	11400	8346	400m.pg1310_o3_native_lto.cx7_gcp_c2s60_4g
19694	232711	38338	387.6	37374.9	392.0	0.165	1.705	1.898	20.380	718097	69.7	3.086	90	189.4	261.3	0.0	0.071	11427	8420	400m.pg147_o3_native_lto.cx7_gcp_c2s60_4g
19683	227015	37484	381.1	37350.3	391.6	0.165	1.719	1.898	20.371	707777	69.6	3.118	92	189.4	261.2	0.0	0.053	11305	8438	400m.pg151_o3_native_lto.cx7_gcp_c2s60_4g
19694	231098	37974	384.3	37296.6	391.6	0.164	1.703	1.894	20.364	718858	69.6	3.111	90	189.4	261.2	0.0	0.069	11385	8602	400m.pg152_o3_native_lto.cx7_gcp_c2s60_4g
l.i0
l.i0: load without secondary indexes
Performance metrics for all DBMS, not just the ones listed above. Some are normalized by throughput, others are not. Legend for results is here.
ips	qps	rps	rmbps	wps	wmbps	rpq	rkbpq	wpi	wkbpi	csps	cpups	cspq	cpupq	dbgb1	dbgb2	rss	maxop	p50	p99	tag
1129944	0	195	2.1	2368.0	482.6	0.000	0.002	0.002	0.437	336807	58.6	0.298	16	44.2	114.2	NA	0.760	62754	12486	400m.pg1119_o3_native_lto.cx7_gcp_c2s60_4g
1120448	0	320	2.5	2481.0	469.8	0.000	0.002	0.002	0.429	308124	58.1	0.275	16	43.0	112.4	NA	1.283	62158	12186	400m.pg1214_o3_native_lto.cx7_gcp_c2s60_4g
1101928	0	132	3.8	2161.3	466.1	0.000	0.004	0.002	0.433	330578	56.9	0.300	15	43.0	112.5	0.0	1.307	61632	10793	400m.pg1310_o3_native_lto.cx7_gcp_c2s60_4g
1108033	0	206	4.4	2265.0	469.1	0.000	0.004	0.002	0.433	313624	57.1	0.283	15	43.0	112.4	NA	0.756	62041	8990	400m.pg147_o3_native_lto.cx7_gcp_c2s60_4g
1104972	0	204	4.8	2258.8	464.8	0.000	0.004	0.002	0.431	321474	56.8	0.291	15	43.0	112.6	NA	1.273	61932	5194	400m.pg151_o3_native_lto.cx7_gcp_c2s60_4g
1120448	0	207	4.7	2271.6	476.3	0.000	0.004	0.002	0.435	323412	56.7	0.289	15	43.0	112.5	NA	1.153	62732	10189	400m.pg152_o3_native_lto.cx7_gcp_c2s60_4g
l.x
l.x: create secondary indexes
Performance metrics for all DBMS, not just the ones listed above. Some are normalized by throughput, others are not. Legend for results is here.
ips	qps	rps	rmbps	wps	wmbps	rpq	rkbpq	wpi	wkbpi	csps	cpups	cspq	cpupq	dbgb1	dbgb2	rss	maxop	p50	p99	tag
312090	0	2091	44.6	521.2	113.0	0.007	0.146	0.002	0.371	1861	3.4	0.006	3	79.5	152.9	0.0	0.003	NA	NA	400m.pg1119_o3_native_lto.cx7_gcp_c2s60_4g
310637	0	1457	44.0	596.7	115.3	0.005	0.145	0.002	0.380	1937	3.4	0.006	3	78.3	150.2	0.0	0.002	NA	NA	400m.pg1214_o3_native_lto.cx7_gcp_c2s60_4g
308243	0	1726	42.0	439.0	103.9	0.006	0.139	0.001	0.345	1903	3.4	0.006	3	78.3	147.7	0.0	0.002	NA	NA	400m.pg1310_o3_native_lto.cx7_gcp_c2s60_4g
302648	0	2093	41.7	478.4	110.0	0.007	0.141	0.002	0.372	1833	3.4	0.006	3	78.3	162.6	0.0	0.002	NA	NA	400m.pg147_o3_native_lto.cx7_gcp_c2s60_4g
300150	0	3117	43.3	506.1	114.9	0.010	0.148	0.002	0.392	2039	3.3	0.007	3	78.3	162.3	0.0	0.002	NA	NA	400m.pg151_o3_native_lto.cx7_gcp_c2s60_4g
301734	0	2211	43.4	517.5	117.7	0.007	0.147	0.002	0.399	2043	3.3	0.007	3	78.3	162.9	0.0	0.002	NA	NA	400m.pg152_o3_native_lto.cx7_gcp_c2s60_4g
l.i1
l.i1: continue load after secondary indexes created
Performance metrics for all DBMS, not just the ones listed above. Some are normalized by throughput, others are not. Legend for results is here.
ips	qps	rps	rmbps	wps	wmbps	rpq	rkbpq	wpi	wkbpi	csps	cpups	cspq	cpupq	dbgb1	dbgb2	rss	maxop	p50	p99	tag
33758	0	71047	658.0	61534.1	596.1	2.105	19.960	1.823	18.082	130209	12.8	3.857	114	176.4	241.8	0.0	0.688	1698	749	400m.pg1119_o3_native_lto.cx7_gcp_c2s60_4g
33650	0	72355	664.8	61181.5	592.8	2.150	20.232	1.818	18.040	130254	12.6	3.871	112	170.2	235.1	0.0	0.623	1698	749	400m.pg1214_o3_native_lto.cx7_gcp_c2s60_4g
33667	0	70250	656.6	61298.0	596.1	2.087	19.972	1.821	18.131	130376	12.6	3.872	112	170.2	241.6	0.0	0.650	1698	749	400m.pg1310_o3_native_lto.cx7_gcp_c2s60_4g
33428	0	71455	661.7	60900.2	583.5	2.138	20.270	1.822	17.874	129296	12.5	3.868	112	170.2	251.4	0.0	0.430	1698	749	400m.pg147_o3_native_lto.cx7_gcp_c2s60_4g
33470	0	71636	663.3	60894.0	584.4	2.140	20.295	1.819	17.879	129469	12.5	3.868	112	170.2	250.2	0.0	0.646	1698	749	400m.pg151_o3_native_lto.cx7_gcp_c2s60_4g
33484	0	71454	663.1	60922.3	584.9	2.134	20.277	1.819	17.888	129359	12.5	3.863	112	170.2	252.0	0.0	0.415	1698	749	400m.pg152_o3_native_lto.cx7_gcp_c2s60_4g
q100.1
q100.1: range queries with 100 insert/s per client
Performance metrics for all DBMS, not just the ones listed above. Some are normalized by throughput, others are not. Legend for results is here.
ips	qps	rps	rmbps	wps	wmbps	rpq	rkbpq	wpi	wkbpi	csps	cpups	cspq	cpupq	dbgb1	dbgb2	rss	maxop	p50	p99	tag
1976	188553	3822	38.4	4026.4	50.5	0.020	0.209	2.038	26.163	674843	63.0	3.579	100	177.6	220.7	0.0	0.032	9338	8970	400m.pg1119_o3_native_lto.cx7_gcp_c2s60_4g
1976	198191	3800	38.6	3962.6	50.1	0.019	0.200	2.006	25.980	707664	62.7	3.571	95	171.1	219.9	0.0	0.026	9781	9401	400m.pg1214_o3_native_lto.cx7_gcp_c2s60_4g
1976	200022	4026	40.0	4149.8	51.4	0.020	0.205	2.100	26.616	711185	62.7	3.556	94	171.1	219.8	0.0	0.230	9946	9494	400m.pg1310_o3_native_lto.cx7_gcp_c2s60_4g
1976	199166	3752	38.3	4123.0	50.7	0.019	0.197	2.087	26.268	711014	62.6	3.570	94	171.1	232.3	0.0	0.029	9925	9541	400m.pg147_o3_native_lto.cx7_gcp_c2s60_4g
1976	197081	3925	39.2	4121.9	51.4	0.020	0.204	2.086	26.627	704162	62.6	3.573	95	171.1	232.4	0.0	0.027	9749	9338	400m.pg151_o3_native_lto.cx7_gcp_c2s60_4g
1976	199988	3761	38.6	4124.0	51.0	0.019	0.198	2.087	26.427	713561	62.6	3.568	94	171.1	232.2	0.0	0.027	10021	9573	400m.pg152_o3_native_lto.cx7_gcp_c2s60_4g
q500.1
q500.1: range queries with 500 insert/s per client
Performance metrics for all DBMS, not just the ones listed above. Some are normalized by throughput, others are not. Legend for results is here.
ips	qps	rps	rmbps	wps	wmbps	rpq	rkbpq	wpi	wkbpi	csps	cpups	cspq	cpupq	dbgb1	dbgb2	rss	maxop	p50	p99	tag
9885	190603	18171	186.0	19877.3	210.6	0.095	1.000	2.011	21.821	661225	65.8	3.469	104	183.7	226.3	0.0	0.028	9450	8842	400m.pg1119_o3_native_lto.cx7_gcp_c2s60_4g
9890	199459	18235	186.0	19514.5	208.0	0.091	0.955	1.973	21.539	690985	65.3	3.464	98	176.0	220.6	0.0	0.226	9861	9206	400m.pg1214_o3_native_lto.cx7_gcp_c2s60_4g
9885	202718	18271	186.2	19566.9	209.7	0.090	0.940	1.980	21.721	697248	65.6	3.439	97	176.0	220.0	0.0	0.028	10053	9381	400m.pg1310_o3_native_lto.cx7_gcp_c2s60_4g
9885	200818	17715	184.1	19528.4	208.1	0.088	0.939	1.976	21.558	695673	65.4	3.464	98	176.0	229.6	0.0	0.028	9989	9334	400m.pg147_o3_native_lto.cx7_gcp_c2s60_4g
9885	199585	17868	184.6	19525.1	208.3	0.090	0.947	1.975	21.574	691791	65.4	3.466	98	176.0	229.6	0.0	0.027	9861	9206	400m.pg151_o3_native_lto.cx7_gcp_c2s60_4g
9885	202582	17609	183.8	19534.4	208.8	0.087	0.929	1.976	21.629	699796	65.4	3.454	97	176.0	229.8	0.0	0.030	10053	9338	400m.pg152_o3_native_lto.cx7_gcp_c2s60_4g
q1000.1
q1000.1: range queries with 1000 insert/s per client
Performance metrics for all DBMS, not just the ones listed above. Some are normalized by throughput, others are not. Legend for results is here.
ips	qps	rps	rmbps	wps	wmbps	rpq	rkbpq	wpi	wkbpi	csps	cpups	cspq	cpupq	dbgb1	dbgb2	rss	maxop	p50	p99	tag
19683	219889	37761	383.2	37891.8	401.6	0.172	1.785	1.925	20.894	677985	70.0	3.083	96	197.2	256.7	0.0	0.042	11028	8075	400m.pg1119_o3_native_lto.cx7_gcp_c2s60_4g
19661	227352	38049	384.6	37303.1	400.8	0.167	1.732	1.897	20.873	705286	69.7	3.102	92	189.4	249.9	0.0	0.064	11092	8279	400m.pg1214_o3_native_lto.cx7_gcp_c2s60_4g
19672	229618	38012	384.4	37321.3	400.0	0.166	1.714	1.897	20.822	711809	69.6	3.100	91	189.4	249.9	0.0	0.036	11400	8346	400m.pg1310_o3_native_lto.cx7_gcp_c2s60_4g
19694	232711	38338	387.6	37374.9	392.0	0.165	1.705	1.898	20.380	718097	69.7	3.086	90	189.4	261.3	0.0	0.071	11427	8420	400m.pg147_o3_native_lto.cx7_gcp_c2s60_4g
19683	227015	37484	381.1	37350.3	391.6	0.165	1.719	1.898	20.371	707777	69.6	3.118	92	189.4	261.2	0.0	0.053	11305	8438	400m.pg151_o3_native_lto.cx7_gcp_c2s60_4g
19694	231098	37974	384.3	37296.6	391.6	0.164	1.703	1.894	20.364	718858	69.6	3.111	90	189.4	261.2	0.0	0.069	11385	8602	400m.pg152_o3_native_lto.cx7_gcp_c2s60_4g
l.i0
- l.i0: load without secondary indexes
- Legend for results is here.
- Each entry lists the percentage of responses that fit in that bucket (slower than max time for previous bucket, faster than min time for next bucket).
Insert response time histogram
256us	1ms	4ms	16ms	64ms	256ms	1s	4s	16s	gt	max	tag
0.000	28.387	68.721	2.800	0.050	0.029	0.012	0.000	0.000	0.000	0.760	pg1119_o3_native_lto.cx7_gcp_c2s60_4g
0.000	26.679	70.318	2.939	0.022	0.025	0.016	0.001	0.000	0.000	1.283	pg1214_o3_native_lto.cx7_gcp_c2s60_4g
0.000	28.161	68.546	3.218	0.029	0.031	0.014	0.001	0.000	0.000	1.307	pg1310_o3_native_lto.cx7_gcp_c2s60_4g
0.000	26.313	70.766	2.854	0.024	0.024	0.018	0.000	0.000	0.000	0.756	pg147_o3_native_lto.cx7_gcp_c2s60_4g
0.000	28.125	68.867	2.944	0.023	0.022	0.017	0.001	0.000	0.000	1.273	pg151_o3_native_lto.cx7_gcp_c2s60_4g
0.000	30.850	66.192	2.886	0.025	0.031	0.016	0.001	0.000	0.000	1.153	pg152_o3_native_lto.cx7_gcp_c2s60_4g
l.x
- l.x: create secondary indexes
- Legend for results is here.
- Each entry lists the percentage of responses that fit in that bucket (slower than max time for previous bucket, faster than min time for next bucket).
TODO - determine whether there is data for create index response time
l.i1
- l.i1: continue load after secondary indexes created
- Legend for results is here.
- Each entry lists the percentage of responses that fit in that bucket (slower than max time for previous bucket, faster than min time for next bucket).
Insert response time histogram
256us	1ms	4ms	16ms	64ms	256ms	1s	4s	16s	gt	max	tag
0.000	0.000	0.194	6.555	87.950	5.300	nonzero	0.000	0.000	0.000	0.688	pg1119_o3_native_lto.cx7_gcp_c2s60_4g
0.000	0.000	0.209	6.571	87.937	5.282	0.001	0.000	0.000	0.000	0.623	pg1214_o3_native_lto.cx7_gcp_c2s60_4g
0.000	0.000	0.209	6.256	88.214	5.320	0.001	0.000	0.000	0.000	0.650	pg1310_o3_native_lto.cx7_gcp_c2s60_4g
0.000	0.000	0.056	5.848	88.743	5.351	0.002	0.000	0.000	0.000	0.430	pg147_o3_native_lto.cx7_gcp_c2s60_4g
0.000	0.000	0.058	5.720	88.869	5.352	0.002	0.000	0.000	0.000	0.646	pg151_o3_native_lto.cx7_gcp_c2s60_4g
0.000	0.000	0.059	5.799	88.801	5.339	0.003	0.000	0.000	0.000	0.415	pg152_o3_native_lto.cx7_gcp_c2s60_4g
q100.1
- q100.1: range queries with 100 insert/s per client
- Legend for results is here.
- Each entry lists the percentage of responses that fit in that bucket (slower than max time for previous bucket, faster than min time for next bucket).
Query response time histogram
256us	1ms	4ms	16ms	64ms	256ms	1s	4s	16s	gt	max	tag
99.912	0.085	0.002	0.001	nonzero	0.000	0.000	0.000	0.000	0.000	0.032	pg1119_o3_native_lto.cx7_gcp_c2s60_4g
99.926	0.071	0.002	0.001	nonzero	0.000	0.000	0.000	0.000	0.000	0.026	pg1214_o3_native_lto.cx7_gcp_c2s60_4g
99.927	0.070	0.002	0.001	nonzero	nonzero	0.000	0.000	0.000	0.000	0.230	pg1310_o3_native_lto.cx7_gcp_c2s60_4g
99.926	0.071	0.002	0.001	nonzero	0.000	0.000	0.000	0.000	0.000	0.029	pg147_o3_native_lto.cx7_gcp_c2s60_4g
99.922	0.075	0.002	0.001	nonzero	0.000	0.000	0.000	0.000	0.000	0.027	pg151_o3_native_lto.cx7_gcp_c2s60_4g
99.927	0.070	0.002	0.001	nonzero	0.000	0.000	0.000	0.000	0.000	0.027	pg152_o3_native_lto.cx7_gcp_c2s60_4g
Insert response time histogram
256us	1ms	4ms	16ms	64ms	256ms	1s	4s	16s	gt	max	tag
0.000	0.000	0.000	0.397	99.576	0.026	0.000	0.000	0.000	0.000	0.126	pg1119_o3_native_lto.cx7_gcp_c2s60_4g
0.000	0.000	0.000	0.603	99.392	0.004	0.001	0.000	0.000	0.000	0.322	pg1214_o3_native_lto.cx7_gcp_c2s60_4g
0.000	0.000	0.000	0.572	99.251	0.111	0.065	0.000	0.000	0.000	0.426	pg1310_o3_native_lto.cx7_gcp_c2s60_4g
0.000	0.000	0.000	0.696	99.207	0.097	0.000	0.000	0.000	0.000	0.252	pg147_o3_native_lto.cx7_gcp_c2s60_4g
0.000	0.000	0.000	0.504	99.431	0.065	0.000	0.000	0.000	0.000	0.184	pg151_o3_native_lto.cx7_gcp_c2s60_4g
0.000	0.000	0.000	0.690	99.239	0.036	0.035	0.000	0.000	0.000	0.479	pg152_o3_native_lto.cx7_gcp_c2s60_4g
q500.1
- q500.1: range queries with 500 insert/s per client
- Legend for results is here.
- Each entry lists the percentage of responses that fit in that bucket (slower than max time for previous bucket, faster than min time for next bucket).
Query response time histogram
256us	1ms	4ms	16ms	64ms	256ms	1s	4s	16s	gt	max	tag
99.645	0.343	0.011	0.001	nonzero	0.000	0.000	0.000	0.000	0.000	0.028	pg1119_o3_native_lto.cx7_gcp_c2s60_4g
99.689	0.299	0.011	0.001	nonzero	nonzero	0.000	0.000	0.000	0.000	0.226	pg1214_o3_native_lto.cx7_gcp_c2s60_4g
99.694	0.294	0.011	0.001	nonzero	0.000	0.000	0.000	0.000	0.000	0.028	pg1310_o3_native_lto.cx7_gcp_c2s60_4g
99.703	0.285	0.011	0.001	nonzero	0.000	0.000	0.000	0.000	0.000	0.028	pg147_o3_native_lto.cx7_gcp_c2s60_4g
99.685	0.304	0.011	0.001	nonzero	0.000	0.000	0.000	0.000	0.000	0.027	pg151_o3_native_lto.cx7_gcp_c2s60_4g
99.708	0.280	0.011	0.001	nonzero	0.000	0.000	0.000	0.000	0.000	0.030	pg152_o3_native_lto.cx7_gcp_c2s60_4g
Insert response time histogram
256us	1ms	4ms	16ms	64ms	256ms	1s	4s	16s	gt	max	tag
0.000	0.000	0.000	0.357	99.568	0.075	0.000	0.000	0.000	0.000	0.254	pg1119_o3_native_lto.cx7_gcp_c2s60_4g
0.000	0.000	0.000	0.536	99.410	0.054	nonzero	0.000	0.000	0.000	0.269	pg1214_o3_native_lto.cx7_gcp_c2s60_4g
0.000	0.000	0.000	0.563	99.417	0.020	0.000	0.000	0.000	0.000	0.152	pg1310_o3_native_lto.cx7_gcp_c2s60_4g
0.000	0.000	0.000	0.838	99.131	0.029	0.002	0.000	0.000	0.000	0.272	pg147_o3_native_lto.cx7_gcp_c2s60_4g
0.000	0.000	0.000	0.674	99.282	0.044	0.000	0.000	0.000	0.000	0.188	pg151_o3_native_lto.cx7_gcp_c2s60_4g
0.000	0.000	0.000	0.878	99.089	0.026	0.007	0.000	0.000	0.000	0.329	pg152_o3_native_lto.cx7_gcp_c2s60_4g
q1000.1
- q1000.1: range queries with 1000 insert/s per client
- Legend for results is here.
- Each entry lists the percentage of responses that fit in that bucket (slower than max time for previous bucket, faster than min time for next bucket).
Query response time histogram
256us	1ms	4ms	16ms	64ms	256ms	1s	4s	16s	gt	max	tag
99.426	0.551	0.022	0.002	nonzero	0.000	0.000	0.000	0.000	0.000	0.042	pg1119_o3_native_lto.cx7_gcp_c2s60_4g
99.477	0.503	0.019	0.001	nonzero	0.000	0.000	0.000	0.000	0.000	0.064	pg1214_o3_native_lto.cx7_gcp_c2s60_4g
99.480	0.500	0.019	0.001	nonzero	0.000	0.000	0.000	0.000	0.000	0.036	pg1310_o3_native_lto.cx7_gcp_c2s60_4g
99.512	0.469	0.018	0.001	nonzero	nonzero	0.000	0.000	0.000	0.000	0.071	pg147_o3_native_lto.cx7_gcp_c2s60_4g
99.481	0.499	0.018	0.001	nonzero	0.000	0.000	0.000	0.000	0.000	0.053	pg151_o3_native_lto.cx7_gcp_c2s60_4g
99.512	0.470	0.017	0.001	nonzero	nonzero	0.000	0.000	0.000	0.000	0.069	pg152_o3_native_lto.cx7_gcp_c2s60_4g
Insert response time histogram
256us	1ms	4ms	16ms	64ms	256ms	1s	4s	16s	gt	max	tag
0.000	0.000	0.000	1.098	93.540	5.362	nonzero	0.000	0.000	0.000	0.285	pg1119_o3_native_lto.cx7_gcp_c2s60_4g
0.000	0.000	0.000	1.597	93.272	5.128	0.003	0.000	0.000	0.000	0.552	pg1214_o3_native_lto.cx7_gcp_c2s60_4g
0.000	0.000	0.000	1.965	92.903	5.131	0.001	0.000	0.000	0.000	0.506	pg1310_o3_native_lto.cx7_gcp_c2s60_4g
0.000	0.000	0.000	1.926	92.982	5.093	nonzero	0.000	0.000	0.000	0.262	pg147_o3_native_lto.cx7_gcp_c2s60_4g
0.000	0.000	0.000	2.221	92.786	4.992	0.001	0.000	0.000	0.000	0.277	pg151_o3_native_lto.cx7_gcp_c2s60_4g
0.000	0.000	0.000	2.145	92.861	4.993	0.001	0.000	0.000	0.000	0.411	pg152_o3_native_lto.cx7_gcp_c2s60_4g