Introduction
This is a report for the insert benchmark with 400M docs and 20 client(s). It is generated by scripts (bash, awk, sed) and Tufte might not be impressed. An overview of the insert benchmark is here and a short update is here. Below, by DBMS, I mean DBMS+version.config. An example is my8020.c10b40 where my means MySQL, 8020 is version 8.0.20 and c10b40 is the name for the configuration file.
The test server is a c2-standard-60 from GCP with 30 cores, hyperthreading disabled, 240G RAM and 3T from XFS and SW RAID 0 striped over 8 local NVMe drives. The benchmark was run with 20 clients and there were 1 or 2 connections per client (1 for queries, 1 for inserts). The benchmark loads 400M rows without secondary indexes, creates secondary indexes, loads another 400M rows then does 3 read+write tests for one hour each that do queries as fast as possible with 100, 500 and then 1000 writes/second/client concurrent with the queries. Each read-write test runs for 1800 seconds. The test was configured to use a table per client. The database fits in the OS page cache but not the DBMS buffer pool. Clients and the DBMS share one server. The per-database configs are in the per-database subdirectories here.
The tested DBMS are:
- pg152_def.cx7_gcp_c2s60_4g - Postgres 15.2, the cx7_gcp_c2s60_4g config and a default build that used -O2
- pg152_o3_native_lto.cx7_gcp_c2s60_4g - Postgres 15.2, the cx7_gcp_c2s60_4g config and a build that uses -O3 -march=native -mtune=native -flto (link-time optimization)
Contents
- Summary
- l.i0: load without secondary indexes
- l.x: create secondary indexes
- l.i1: continue load after secondary indexes created
- q100.1: range queries with 100 insert/s per client
- q500.1: range queries with 500 insert/s per client
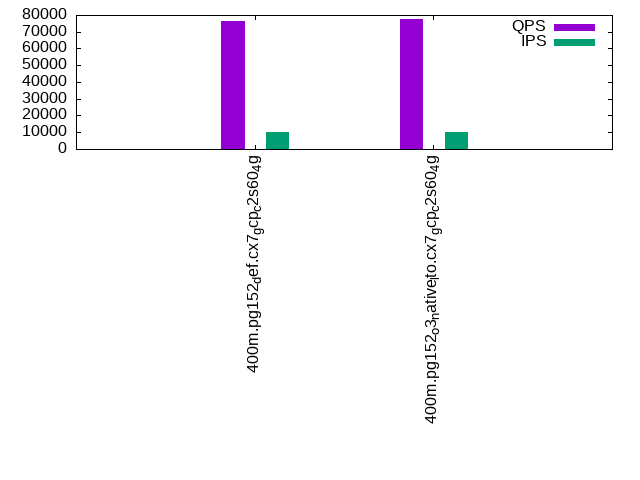
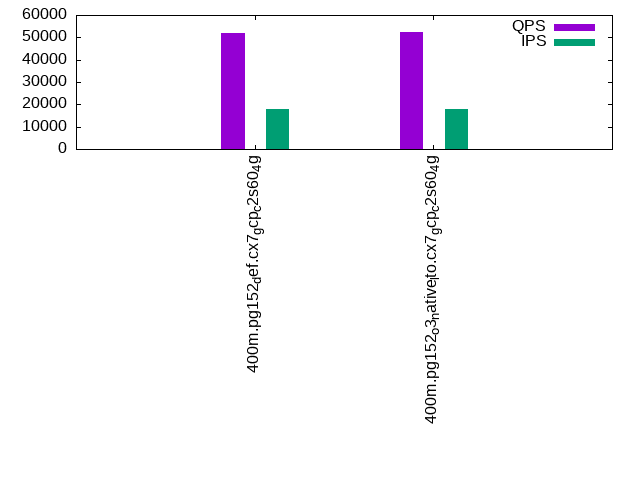
- q1000.1: range queries with 1000 insert/s per client
Summary
The numbers are inserts/s for l.i0 and l.i1, indexed docs (or rows) /s for l.x and queries/s for q*.2. The values are the average rate over the entire test for inserts (IPS) and queries (QPS). The range of values for IPS and QPS is split into 3 parts: bottom 25%, middle 50%, top 25%. Values in the bottom 25% have a red background, values in the top 25% have a green background and values in the middle have no color. A gray background is used for values that can be ignored because the DBMS did not sustain the target insert rate. Red backgrounds are not used when the minimum value is within 80% of the max value.
| dbms | l.i0 | l.x | l.i1 | q100.1 | q500.1 | q1000.1 |
|---|---|---|---|---|---|---|
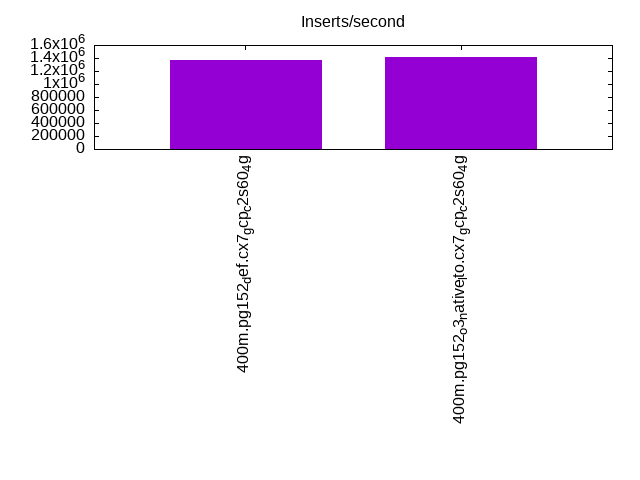
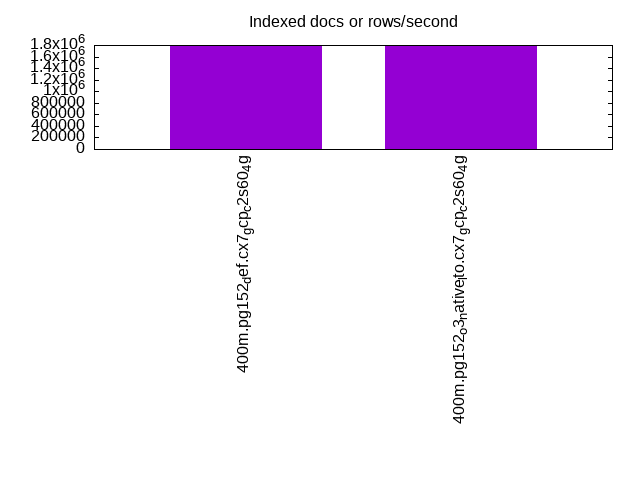
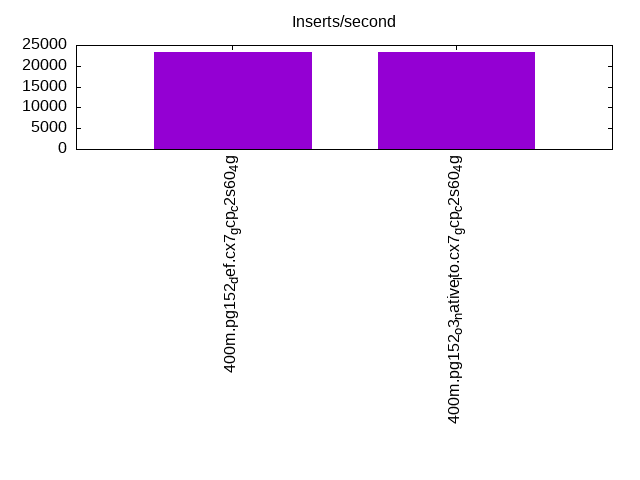
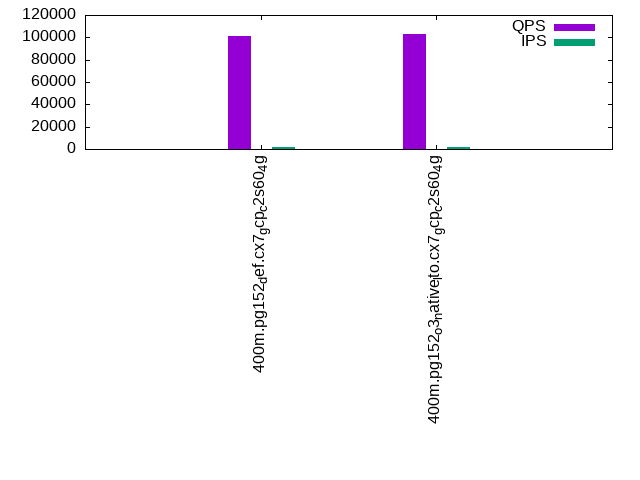
| 400m.pg152_def.cx7_gcp_c2s60_4g | 1369863 | 1778222 | 23213 | 100900 | 76236 | 51779 |
| 400m.pg152_o3_native_lto.cx7_gcp_c2s60_4g | 1418440 | 1786161 | 23245 | 103293 | 77518 | 52544 |
This lists the average rate of inserts/s for the tests that do inserts concurrent with queries. For such tests the query rate is listed in the table above. The read+write tests are setup so that the insert rate should match the target rate every second. Cells that are not at least 95% of the target have a red background to indicate a failure to satisfy the target.
| dbms | q100.1 | q500.1 | q1000.1 |
|---|---|---|---|
| pg152_def.cx7_gcp_c2s60_4g | 1977 | 9885 | 18109 |
| pg152_o3_native_lto.cx7_gcp_c2s60_4g | 1977 | 9885 | 18109 |
| target | 2000 | 10000 | 20000 |
l.i0
l.i0: load without secondary indexes. Graphs for performance per 1-second interval are here.
Average throughput:
Insert response time histogram: each cell has the percentage of responses that take <= the time in the header and max is the max response time in seconds. For the max column values in the top 25% of the range have a red background and in the bottom 25% of the range have a green background. The red background is not used when the min value is within 80% of the max value.
| dbms | 256us | 1ms | 4ms | 16ms | 64ms | 256ms | 1s | 4s | 16s | gt | max |
|---|---|---|---|---|---|---|---|---|---|---|---|
| pg152_def.cx7_gcp_c2s60_4g | 61.996 | 36.869 | 1.067 | 0.029 | 0.026 | 0.013 | 0.001 | 1.227 | |||
| pg152_o3_native_lto.cx7_gcp_c2s60_4g | 62.805 | 36.181 | 0.937 | 0.035 | 0.026 | 0.016 | 0.967 |
Performance metrics for the DBMS listed above. Some are normalized by throughput, others are not. Legend for results is here.
ips	qps	rps	rmbps	wps	wmbps	rpq	rkbpq	wpi	wkbpi	csps	cpups	cspq	cpupq	dbgb1	dbgb2	rss	maxop	p50	p99	tag
1369863	0	570	6.7	9792.5	581.1	0.000	0.005	0.007	0.434	207947	59.6	0.152	13	38.3	103.2	NA	1.227	78813	14784	400m.pg152_def.cx7_gcp_c2s60_4g
1418440	0	469	6.6	10077.5	603.0	0.000	0.005	0.007	0.435	225438	58.9	0.159	12	38.3	103.2	NA	0.967	81511	8695	400m.pg152_o3_native_lto.cx7_gcp_c2s60_4g
l.x
l.x: create secondary indexes.
Average throughput:
Performance metrics for the DBMS listed above. Some are normalized by throughput, others are not. Legend for results is here.
ips	qps	rps	rmbps	wps	wmbps	rpq	rkbpq	wpi	wkbpi	csps	cpups	cspq	cpupq	dbgb1	dbgb2	rss	maxop	p50	p99	tag
1778222	0	5641	248.2	5947.7	778.9	0.003	0.143	0.003	0.449	116732	19.6	0.066	3	73.5	195.7	NA	0.109	NA	NA	400m.pg152_def.cx7_gcp_c2s60_4g
1786161	0	8844	252.7	5853.6	761.1	0.005	0.145	0.003	0.436	118433	19.8	0.066	3	73.5	193.7	NA	0.597	NA	NA	400m.pg152_o3_native_lto.cx7_gcp_c2s60_4g
l.i1
l.i1: continue load after secondary indexes created. Graphs for performance per 1-second interval are here.
Average throughput:
Insert response time histogram: each cell has the percentage of responses that take <= the time in the header and max is the max response time in seconds. For the max column values in the top 25% of the range have a red background and in the bottom 25% of the range have a green background. The red background is not used when the min value is within 80% of the max value.
| dbms | 256us | 1ms | 4ms | 16ms | 64ms | 256ms | 1s | 4s | 16s | gt | max |
|---|---|---|---|---|---|---|---|---|---|---|---|
| pg152_def.cx7_gcp_c2s60_4g | 0.030 | 88.573 | 11.393 | 0.004 | 0.645 | ||||||
| pg152_o3_native_lto.cx7_gcp_c2s60_4g | 0.015 | 88.649 | 11.332 | 0.004 | 0.545 |
Performance metrics for the DBMS listed above. Some are normalized by throughput, others are not. Legend for results is here.
ips	qps	rps	rmbps	wps	wmbps	rpq	rkbpq	wpi	wkbpi	csps	cpups	cspq	cpupq	dbgb1	dbgb2	rss	maxop	p50	p99	tag
23213	0	70039	721.1	63015.2	600.8	3.017	31.812	2.715	26.505	132263	12.1	5.698	156	163.3	259.1	NA	0.645	1199	599	400m.pg152_def.cx7_gcp_c2s60_4g
23245	0	70377	724.9	63078.2	601.3	3.028	31.933	2.714	26.487	132716	11.8	5.709	152	163.3	257.9	NA	0.545	1199	599	400m.pg152_o3_native_lto.cx7_gcp_c2s60_4g
q100.1
q100.1: range queries with 100 insert/s per client. Graphs for performance per 1-second interval are here.
Average throughput:
Query response time histogram: each cell has the percentage of responses that take <= the time in the header and max is the max response time in seconds. For max values in the top 25% of the range have a red background and in the bottom 25% of the range have a green background. The red background is not used when the min value is within 80% of the max value.
| dbms | 256us | 1ms | 4ms | 16ms | 64ms | 256ms | 1s | 4s | 16s | gt | max |
|---|---|---|---|---|---|---|---|---|---|---|---|
| pg152_def.cx7_gcp_c2s60_4g | 66.752 | 33.001 | 0.243 | 0.004 | nonzero | nonzero | 0.254 | ||||
| pg152_o3_native_lto.cx7_gcp_c2s60_4g | 67.457 | 32.292 | 0.244 | 0.006 | nonzero | nonzero | 0.182 |
Insert response time histogram: each cell has the percentage of responses that take <= the time in the header and max is the max response time in seconds. For max values in the top 25% of the range have a red background and in the bottom 25% of the range have a green background. The red background is not used when the min value is within 80% of the max value.
| dbms | 256us | 1ms | 4ms | 16ms | 64ms | 256ms | 1s | 4s | 16s | gt | max |
|---|---|---|---|---|---|---|---|---|---|---|---|
| pg152_def.cx7_gcp_c2s60_4g | 0.007 | 99.879 | 0.112 | 0.001 | 0.281 | ||||||
| pg152_o3_native_lto.cx7_gcp_c2s60_4g | 0.021 | 99.864 | 0.110 | 0.006 | 0.304 |
Performance metrics for the DBMS listed above. Some are normalized by throughput, others are not. Legend for results is here.
ips	qps	rps	rmbps	wps	wmbps	rpq	rkbpq	wpi	wkbpi	csps	cpups	cspq	cpupq	dbgb1	dbgb2	rss	maxop	p50	p99	tag
1977	100900	88370	759.2	6332.8	71.2	0.876	7.705	3.203	36.861	471003	37.3	4.668	111	163.9	235.0	0.0	0.254	4986	4523	400m.pg152_def.cx7_gcp_c2s60_4g
1977	103293	91227	778.3	6342.2	72.2	0.883	7.715	3.208	37.422	482723	36.2	4.673	105	163.9	233.1	0.0	0.182	5306	4651	400m.pg152_o3_native_lto.cx7_gcp_c2s60_4g
q500.1
q500.1: range queries with 500 insert/s per client. Graphs for performance per 1-second interval are here.
Average throughput:
Query response time histogram: each cell has the percentage of responses that take <= the time in the header and max is the max response time in seconds. For max values in the top 25% of the range have a red background and in the bottom 25% of the range have a green background. The red background is not used when the min value is within 80% of the max value.
| dbms | 256us | 1ms | 4ms | 16ms | 64ms | 256ms | 1s | 4s | 16s | gt | max |
|---|---|---|---|---|---|---|---|---|---|---|---|
| pg152_def.cx7_gcp_c2s60_4g | 60.461 | 37.965 | 1.441 | 0.126 | 0.006 | nonzero | 0.232 | ||||
| pg152_o3_native_lto.cx7_gcp_c2s60_4g | 60.720 | 37.717 | 1.433 | 0.125 | 0.005 | nonzero | 0.186 |
Insert response time histogram: each cell has the percentage of responses that take <= the time in the header and max is the max response time in seconds. For max values in the top 25% of the range have a red background and in the bottom 25% of the range have a green background. The red background is not used when the min value is within 80% of the max value.
| dbms | 256us | 1ms | 4ms | 16ms | 64ms | 256ms | 1s | 4s | 16s | gt | max |
|---|---|---|---|---|---|---|---|---|---|---|---|
| pg152_def.cx7_gcp_c2s60_4g | 0.007 | 92.267 | 7.726 | 0.001 | 0.279 | ||||||
| pg152_o3_native_lto.cx7_gcp_c2s60_4g | 0.006 | 92.328 | 7.665 | 0.001 | 0.266 |
Performance metrics for the DBMS listed above. Some are normalized by throughput, others are not. Legend for results is here.
ips	qps	rps	rmbps	wps	wmbps	rpq	rkbpq	wpi	wkbpi	csps	cpups	cspq	cpupq	dbgb1	dbgb2	rss	maxop	p50	p99	tag
9885	76236	93775	893.1	29198.0	307.1	1.230	11.996	2.954	31.812	413179	36.7	5.420	144	167.4	236.7	0.0	0.232	4046	1885	400m.pg152_def.cx7_gcp_c2s60_4g
9885	77518	96294	900.6	29292.6	307.5	1.242	11.897	2.963	31.853	420705	35.7	5.427	138	167.4	236.7	0.0	0.186	4093	1982	400m.pg152_o3_native_lto.cx7_gcp_c2s60_4g
q1000.1
q1000.1: range queries with 1000 insert/s per client. Graphs for performance per 1-second interval are here.
Average throughput:
Query response time histogram: each cell has the percentage of responses that take <= the time in the header and max is the max response time in seconds. For max values in the top 25% of the range have a red background and in the bottom 25% of the range have a green background. The red background is not used when the min value is within 80% of the max value.
| dbms | 256us | 1ms | 4ms | 16ms | 64ms | 256ms | 1s | 4s | 16s | gt | max |
|---|---|---|---|---|---|---|---|---|---|---|---|
| pg152_def.cx7_gcp_c2s60_4g | 53.641 | 41.923 | 3.826 | 0.572 | 0.038 | nonzero | 0.065 | ||||
| pg152_o3_native_lto.cx7_gcp_c2s60_4g | 53.814 | 41.812 | 3.768 | 0.569 | 0.038 | nonzero | 0.085 |
Insert response time histogram: each cell has the percentage of responses that take <= the time in the header and max is the max response time in seconds. For max values in the top 25% of the range have a red background and in the bottom 25% of the range have a green background. The red background is not used when the min value is within 80% of the max value.
| dbms | 256us | 1ms | 4ms | 16ms | 64ms | 256ms | 1s | 4s | 16s | gt | max |
|---|---|---|---|---|---|---|---|---|---|---|---|
| pg152_def.cx7_gcp_c2s60_4g | 82.929 | 17.071 | 0.001 | 0.291 | |||||||
| pg152_o3_native_lto.cx7_gcp_c2s60_4g | 0.007 | 82.874 | 17.118 | 0.001 | 0.305 |
Performance metrics for the DBMS listed above. Some are normalized by throughput, others are not. Legend for results is here.
ips	qps	rps	rmbps	wps	wmbps	rpq	rkbpq	wpi	wkbpi	csps	cpups	cspq	cpupq	dbgb1	dbgb2	rss	maxop	p50	p99	tag
18109	51779	96926	948.9	51814.6	530.0	1.872	18.767	2.861	29.972	363039	36.4	7.011	211	179.6	272.2	0.0	0.065	2717	1423	400m.pg152_def.cx7_gcp_c2s60_4g
18109	52544	97400	952.5	51885.2	530.8	1.854	18.562	2.865	30.015	367308	35.6	6.990	203	179.6	272.3	0.0	0.085	2750	1439	400m.pg152_o3_native_lto.cx7_gcp_c2s60_4g
l.i0
l.i0: load without secondary indexes
Performance metrics for all DBMS, not just the ones listed above. Some are normalized by throughput, others are not. Legend for results is here.
ips	qps	rps	rmbps	wps	wmbps	rpq	rkbpq	wpi	wkbpi	csps	cpups	cspq	cpupq	dbgb1	dbgb2	rss	maxop	p50	p99	tag
1369863	0	570	6.7	9792.5	581.1	0.000	0.005	0.007	0.434	207947	59.6	0.152	13	38.3	103.2	NA	1.227	78813	14784	400m.pg152_def.cx7_gcp_c2s60_4g
1418440	0	469	6.6	10077.5	603.0	0.000	0.005	0.007	0.435	225438	58.9	0.159	12	38.3	103.2	NA	0.967	81511	8695	400m.pg152_o3_native_lto.cx7_gcp_c2s60_4g
l.x
l.x: create secondary indexes
Performance metrics for all DBMS, not just the ones listed above. Some are normalized by throughput, others are not. Legend for results is here.
ips	qps	rps	rmbps	wps	wmbps	rpq	rkbpq	wpi	wkbpi	csps	cpups	cspq	cpupq	dbgb1	dbgb2	rss	maxop	p50	p99	tag
1778222	0	5641	248.2	5947.7	778.9	0.003	0.143	0.003	0.449	116732	19.6	0.066	3	73.5	195.7	NA	0.109	NA	NA	400m.pg152_def.cx7_gcp_c2s60_4g
1786161	0	8844	252.7	5853.6	761.1	0.005	0.145	0.003	0.436	118433	19.8	0.066	3	73.5	193.7	NA	0.597	NA	NA	400m.pg152_o3_native_lto.cx7_gcp_c2s60_4g
l.i1
l.i1: continue load after secondary indexes created
Performance metrics for all DBMS, not just the ones listed above. Some are normalized by throughput, others are not. Legend for results is here.
ips	qps	rps	rmbps	wps	wmbps	rpq	rkbpq	wpi	wkbpi	csps	cpups	cspq	cpupq	dbgb1	dbgb2	rss	maxop	p50	p99	tag
23213	0	70039	721.1	63015.2	600.8	3.017	31.812	2.715	26.505	132263	12.1	5.698	156	163.3	259.1	NA	0.645	1199	599	400m.pg152_def.cx7_gcp_c2s60_4g
23245	0	70377	724.9	63078.2	601.3	3.028	31.933	2.714	26.487	132716	11.8	5.709	152	163.3	257.9	NA	0.545	1199	599	400m.pg152_o3_native_lto.cx7_gcp_c2s60_4g
q100.1
q100.1: range queries with 100 insert/s per client
Performance metrics for all DBMS, not just the ones listed above. Some are normalized by throughput, others are not. Legend for results is here.
ips	qps	rps	rmbps	wps	wmbps	rpq	rkbpq	wpi	wkbpi	csps	cpups	cspq	cpupq	dbgb1	dbgb2	rss	maxop	p50	p99	tag
1977	100900	88370	759.2	6332.8	71.2	0.876	7.705	3.203	36.861	471003	37.3	4.668	111	163.9	235.0	0.0	0.254	4986	4523	400m.pg152_def.cx7_gcp_c2s60_4g
1977	103293	91227	778.3	6342.2	72.2	0.883	7.715	3.208	37.422	482723	36.2	4.673	105	163.9	233.1	0.0	0.182	5306	4651	400m.pg152_o3_native_lto.cx7_gcp_c2s60_4g
q500.1
q500.1: range queries with 500 insert/s per client
Performance metrics for all DBMS, not just the ones listed above. Some are normalized by throughput, others are not. Legend for results is here.
ips	qps	rps	rmbps	wps	wmbps	rpq	rkbpq	wpi	wkbpi	csps	cpups	cspq	cpupq	dbgb1	dbgb2	rss	maxop	p50	p99	tag
9885	76236	93775	893.1	29198.0	307.1	1.230	11.996	2.954	31.812	413179	36.7	5.420	144	167.4	236.7	0.0	0.232	4046	1885	400m.pg152_def.cx7_gcp_c2s60_4g
9885	77518	96294	900.6	29292.6	307.5	1.242	11.897	2.963	31.853	420705	35.7	5.427	138	167.4	236.7	0.0	0.186	4093	1982	400m.pg152_o3_native_lto.cx7_gcp_c2s60_4g
q1000.1
q1000.1: range queries with 1000 insert/s per client
Performance metrics for all DBMS, not just the ones listed above. Some are normalized by throughput, others are not. Legend for results is here.
ips	qps	rps	rmbps	wps	wmbps	rpq	rkbpq	wpi	wkbpi	csps	cpups	cspq	cpupq	dbgb1	dbgb2	rss	maxop	p50	p99	tag
18109	51779	96926	948.9	51814.6	530.0	1.872	18.767	2.861	29.972	363039	36.4	7.011	211	179.6	272.2	0.0	0.065	2717	1423	400m.pg152_def.cx7_gcp_c2s60_4g
18109	52544	97400	952.5	51885.2	530.8	1.854	18.562	2.865	30.015	367308	35.6	6.990	203	179.6	272.3	0.0	0.085	2750	1439	400m.pg152_o3_native_lto.cx7_gcp_c2s60_4g
l.i0
- l.i0: load without secondary indexes
- Legend for results is here.
- Each entry lists the percentage of responses that fit in that bucket (slower than max time for previous bucket, faster than min time for next bucket).
Insert response time histogram
256us	1ms	4ms	16ms	64ms	256ms	1s	4s	16s	gt	max	tag
0.000	61.996	36.869	1.067	0.029	0.026	0.013	0.001	0.000	0.000	1.227	pg152_def.cx7_gcp_c2s60_4g
0.000	62.805	36.181	0.937	0.035	0.026	0.016	0.000	0.000	0.000	0.967	pg152_o3_native_lto.cx7_gcp_c2s60_4g
l.x
- l.x: create secondary indexes
- Legend for results is here.
- Each entry lists the percentage of responses that fit in that bucket (slower than max time for previous bucket, faster than min time for next bucket).
TODO - determine whether there is data for create index response time
l.i1
- l.i1: continue load after secondary indexes created
- Legend for results is here.
- Each entry lists the percentage of responses that fit in that bucket (slower than max time for previous bucket, faster than min time for next bucket).
Insert response time histogram
256us	1ms	4ms	16ms	64ms	256ms	1s	4s	16s	gt	max	tag
0.000	0.000	0.000	0.030	88.573	11.393	0.004	0.000	0.000	0.000	0.645	pg152_def.cx7_gcp_c2s60_4g
0.000	0.000	0.000	0.015	88.649	11.332	0.004	0.000	0.000	0.000	0.545	pg152_o3_native_lto.cx7_gcp_c2s60_4g
q100.1
- q100.1: range queries with 100 insert/s per client
- Legend for results is here.
- Each entry lists the percentage of responses that fit in that bucket (slower than max time for previous bucket, faster than min time for next bucket).
Query response time histogram
256us	1ms	4ms	16ms	64ms	256ms	1s	4s	16s	gt	max	tag
66.752	33.001	0.243	0.004	nonzero	nonzero	0.000	0.000	0.000	0.000	0.254	pg152_def.cx7_gcp_c2s60_4g
67.457	32.292	0.244	0.006	nonzero	nonzero	0.000	0.000	0.000	0.000	0.182	pg152_o3_native_lto.cx7_gcp_c2s60_4g
Insert response time histogram
256us	1ms	4ms	16ms	64ms	256ms	1s	4s	16s	gt	max	tag
0.000	0.000	0.000	0.007	99.879	0.112	0.001	0.000	0.000	0.000	0.281	pg152_def.cx7_gcp_c2s60_4g
0.000	0.000	0.000	0.021	99.864	0.110	0.006	0.000	0.000	0.000	0.304	pg152_o3_native_lto.cx7_gcp_c2s60_4g
q500.1
- q500.1: range queries with 500 insert/s per client
- Legend for results is here.
- Each entry lists the percentage of responses that fit in that bucket (slower than max time for previous bucket, faster than min time for next bucket).
Query response time histogram
256us	1ms	4ms	16ms	64ms	256ms	1s	4s	16s	gt	max	tag
60.461	37.965	1.441	0.126	0.006	nonzero	0.000	0.000	0.000	0.000	0.232	pg152_def.cx7_gcp_c2s60_4g
60.720	37.717	1.433	0.125	0.005	nonzero	0.000	0.000	0.000	0.000	0.186	pg152_o3_native_lto.cx7_gcp_c2s60_4g
Insert response time histogram
256us	1ms	4ms	16ms	64ms	256ms	1s	4s	16s	gt	max	tag
0.000	0.000	0.000	0.007	92.267	7.726	0.001	0.000	0.000	0.000	0.279	pg152_def.cx7_gcp_c2s60_4g
0.000	0.000	0.000	0.006	92.328	7.665	0.001	0.000	0.000	0.000	0.266	pg152_o3_native_lto.cx7_gcp_c2s60_4g
q1000.1
- q1000.1: range queries with 1000 insert/s per client
- Legend for results is here.
- Each entry lists the percentage of responses that fit in that bucket (slower than max time for previous bucket, faster than min time for next bucket).
Query response time histogram
256us	1ms	4ms	16ms	64ms	256ms	1s	4s	16s	gt	max	tag
53.641	41.923	3.826	0.572	0.038	nonzero	0.000	0.000	0.000	0.000	0.065	pg152_def.cx7_gcp_c2s60_4g
53.814	41.812	3.768	0.569	0.038	nonzero	0.000	0.000	0.000	0.000	0.085	pg152_o3_native_lto.cx7_gcp_c2s60_4g
Insert response time histogram
256us	1ms	4ms	16ms	64ms	256ms	1s	4s	16s	gt	max	tag
0.000	0.000	0.000	0.000	82.929	17.071	0.001	0.000	0.000	0.000	0.291	pg152_def.cx7_gcp_c2s60_4g
0.000	0.000	0.000	0.007	82.874	17.118	0.001	0.000	0.000	0.000	0.305	pg152_o3_native_lto.cx7_gcp_c2s60_4g