Introduction
This is a report for the insert benchmark with 400M docs and 20 client(s). It is generated by scripts (bash, awk, sed) and Tufte might not be impressed. An overview of the insert benchmark is here and a short update is here. Below, by DBMS, I mean DBMS+version.config. An example is my8020.c10b40 where my means MySQL, 8020 is version 8.0.20 and c10b40 is the name for the configuration file.
The test server is a c2-standard-60 from GCP with 30 cores, hyperthreading disabled, 240G RAM and 3T from XFS and SW RAID 0 striped over 8 local NVMe drives. The benchmark was run with 20 clients and there were 1 or 2 connections per client (1 for queries, 1 for inserts). The benchmark loads 400M rows without secondary indexes, creates secondary indexes, loads another 400M rows then does 3 read+write tests for one hour each that do queries as fast as possible with 100, 500 and then 1000 writes/second/client concurrent with the queries. Each read-write test runs for 1800 seconds. The test was configured to use one table. The database is cached by the storage engine and the only IO is for writes. Clients and the DBMS share one server. The per-database configs are in the per-database subdirectories here.
The tested DBMS are:
- pg151_def.cx7_gcp_c2s60 - Postgres 15.1, the cx7_gcp_c2s60 config and a default build that used -O2
- pg151_o2_nofp.cx7_gcp_c2s60 - Postgres 15.1, the cx7_gcp_c2s60 config and a build that used -O2 -fno-omit-frame-pointer
- pg151_o3.cx7_gcp_c2s60 - Postgres 15.1, the cx7_gcp_c2s60 config and a build that used -O3
- pg151_o3_native.cx7_gcp_c2s60 - Postgres 15.1, the cx7_gcp_c2s60 config and a build that used -O3 -march=native -mtune=native
- pg151_o3_native_lto.cx7_gcp_c2s60 - Postgres 15.1, the cx7_gcp_c2s60 config and a build that used -O3 -march=native -mtune=native -flto (link-time optimization)
Contents
- Summary
- l.i0: load without secondary indexes
- l.x: create secondary indexes
- l.i1: continue load after secondary indexes created
- q100.1: range queries with 100 insert/s per client
- q500.1: range queries with 500 insert/s per client
- q1000.1: range queries with 1000 insert/s per client
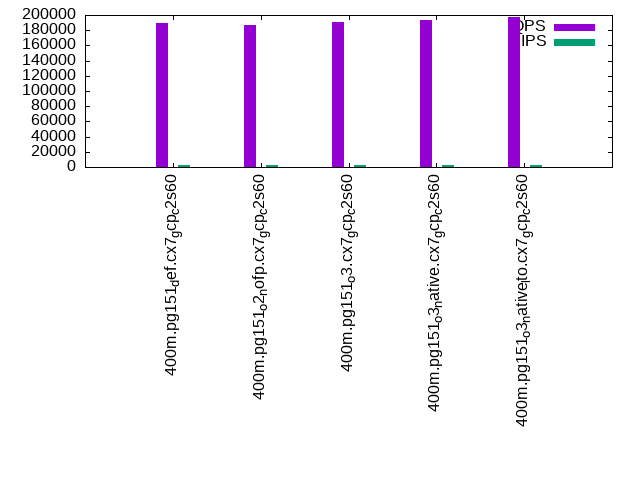
Summary
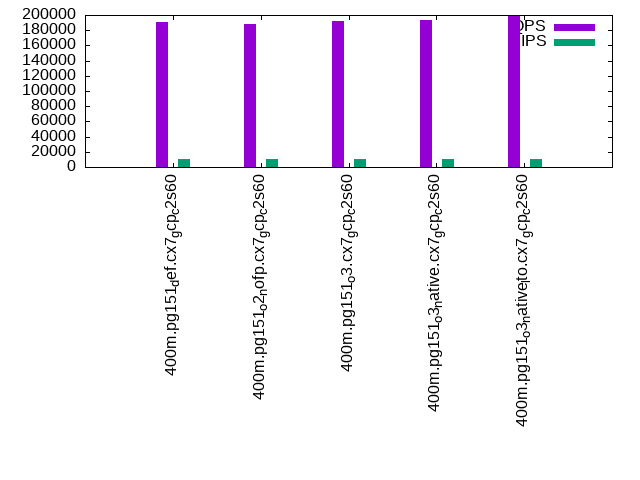
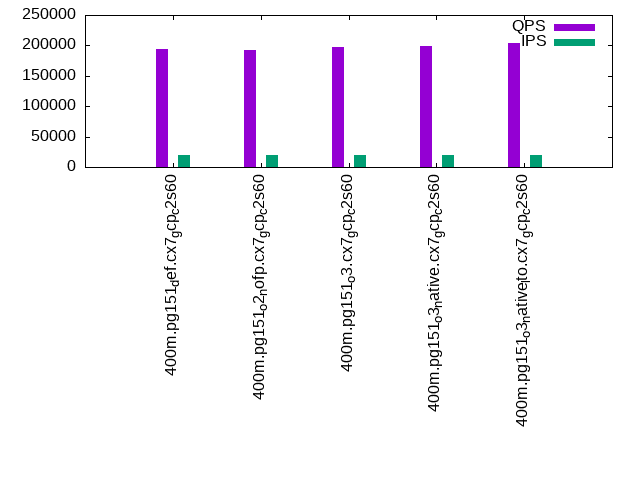
The numbers are inserts/s for l.i0 and l.i1, indexed docs (or rows) /s for l.x and queries/s for q*.2. The values are the average rate over the entire test for inserts (IPS) and queries (QPS). The range of values for IPS and QPS is split into 3 parts: bottom 25%, middle 50%, top 25%. Values in the bottom 25% have a red background, values in the top 25% have a green background and values in the middle have no color. A gray background is used for values that can be ignored because the DBMS did not sustain the target insert rate. Red backgrounds are not used when the minimum value is within 80% of the max value.
| dbms | l.i0 | l.x | l.i1 | q100.1 | q500.1 | q1000.1 |
|---|---|---|---|---|---|---|
| 400m.pg151_def.cx7_gcp_c2s60 | 1081081 | 319059 | 393314 | 189264 | 191126 | 194731 |
| 400m.pg151_o2_nofp.cx7_gcp_c2s60 | 1033592 | 311604 | 374532 | 186206 | 188322 | 192800 |
| 400m.pg151_o3.cx7_gcp_c2s60 | 1095890 | 325549 | 390625 | 190229 | 192018 | 196728 |
| 400m.pg151_o3_native.cx7_gcp_c2s60 | 1075269 | 333695 | 384986 | 192928 | 193866 | 198737 |
| 400m.pg151_o3_native_lto.cx7_gcp_c2s60 | 1114206 | 328220 | 396040 | 197884 | 198355 | 203902 |
This lists the average rate of inserts/s for the tests that do inserts concurrent with queries. For such tests the query rate is listed in the table above. The read+write tests are setup so that the insert rate should match the target rate every second. Cells that are not at least 95% of the target have a red background to indicate a failure to satisfy the target.
| dbms | q100.1 | q500.1 | q1000.1 |
|---|---|---|---|
| pg151_def.cx7_gcp_c2s60 | 1976 | 9885 | 19769 |
| pg151_o2_nofp.cx7_gcp_c2s60 | 1976 | 9885 | 19769 |
| pg151_o3.cx7_gcp_c2s60 | 1976 | 9885 | 19769 |
| pg151_o3_native.cx7_gcp_c2s60 | 1977 | 9885 | 19769 |
| pg151_o3_native_lto.cx7_gcp_c2s60 | 1976 | 9885 | 19769 |
| target | 2000 | 10000 | 20000 |
l.i0
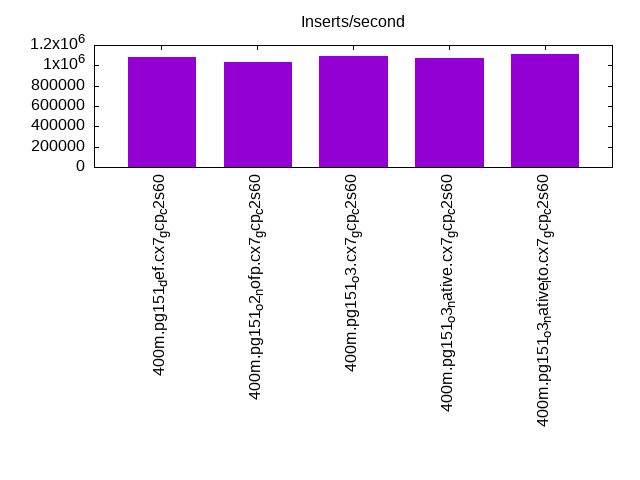
l.i0: load without secondary indexes. Graphs for performance per 1-second interval are here.
Average throughput:
Insert response time histogram: each cell has the percentage of responses that take <= the time in the header and max is the max response time in seconds. For the max column values in the top 25% of the range have a red background and in the bottom 25% of the range have a green background. The red background is not used when the min value is within 80% of the max value.
| dbms | 256us | 1ms | 4ms | 16ms | 64ms | 256ms | 1s | 4s | 16s | gt | max |
|---|---|---|---|---|---|---|---|---|---|---|---|
| pg151_def.cx7_gcp_c2s60 | 18.967 | 77.759 | 3.213 | 0.020 | 0.026 | 0.016 | 0.608 | ||||
| pg151_o2_nofp.cx7_gcp_c2s60 | 14.277 | 81.859 | 3.804 | 0.021 | 0.022 | 0.016 | 0.980 | ||||
| pg151_o3.cx7_gcp_c2s60 | 20.514 | 76.301 | 3.130 | 0.017 | 0.026 | 0.012 | 0.876 | ||||
| pg151_o3_native.cx7_gcp_c2s60 | 20.860 | 75.612 | 3.474 | 0.014 | 0.026 | 0.014 | 0.001 | 1.306 | |||
| pg151_o3_native_lto.cx7_gcp_c2s60 | 27.644 | 69.081 | 3.222 | 0.012 | 0.028 | 0.013 | 0.984 |
Performance metrics for the DBMS listed above. Some are normalized by throughput, others are not. Legend for results is here.
ips	qps	rps	rmbps	wps	wmbps	rpq	rkbpq	wpi	wkbpi	csps	cpups	cspq	cpupq	dbgb1	dbgb2	rss	maxop	p50	p99	tag
1081081	0	0	0.0	1722.9	421.2	0.000	0.000	0.002	0.399	311160	57.7	0.288	16	43.0	116.0	NA	0.608	60425	13984	400m.pg151_def.cx7_gcp_c2s60
1033592	0	0	0.0	1685.4	413.4	0.000	0.000	0.002	0.410	327875	57.2	0.317	17	43.0	117.4	NA	0.980	57560	12087	400m.pg151_o2_nofp.cx7_gcp_c2s60
1095890	0	0	0.0	1720.8	419.5	0.000	0.000	0.002	0.392	301972	57.8	0.276	16	43.0	115.2	NA	0.876	60656	10588	400m.pg151_o3.cx7_gcp_c2s60
1075269	0	0	0.0	1654.6	415.2	0.000	0.000	0.002	0.395	324102	57.2	0.301	16	43.0	116.3	NA	1.306	59657	9789	400m.pg151_o3_native.cx7_gcp_c2s60
1114206	0	0	0.0	1707.0	419.3	0.000	0.000	0.002	0.385	328361	56.9	0.295	15	43.0	113.7	NA	0.984	61933	11287	400m.pg151_o3_native_lto.cx7_gcp_c2s60
l.x
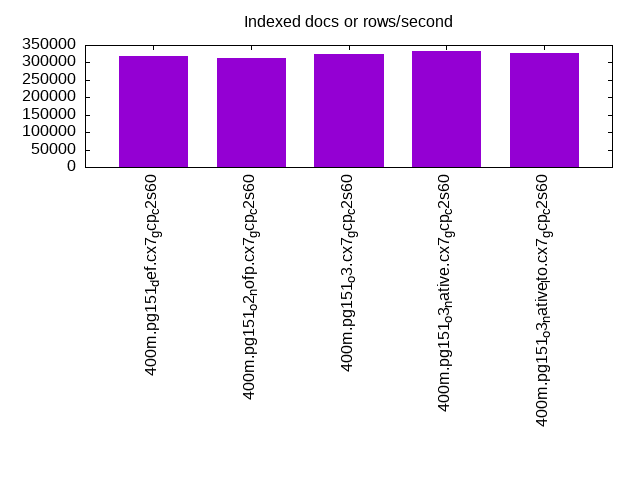
l.x: create secondary indexes.
Average throughput:
Performance metrics for the DBMS listed above. Some are normalized by throughput, others are not. Legend for results is here.
ips	qps	rps	rmbps	wps	wmbps	rpq	rkbpq	wpi	wkbpi	csps	cpups	cspq	cpupq	dbgb1	dbgb2	rss	maxop	p50	p99	tag
319059	0	2274	14.2	412.2	94.4	0.007	0.045	0.001	0.303	1224	3.0	0.004	3	78.3	152.0	0.0	0.031	NA	NA	400m.pg151_def.cx7_gcp_c2s60
311604	0	1584	15.8	401.9	97.5	0.005	0.052	0.001	0.320	988	3.0	0.003	3	78.3	152.6	0.0	0.002	NA	NA	400m.pg151_o2_nofp.cx7_gcp_c2s60
325549	0	2137	15.1	448.9	106.7	0.007	0.048	0.001	0.335	876	3.1	0.003	3	78.3	152.2	0.0	0.016	NA	NA	400m.pg151_o3.cx7_gcp_c2s60
333695	0	2739	16.1	436.9	102.3	0.008	0.049	0.001	0.314	1028	3.0	0.003	3	78.3	152.5	0.0	0.028	NA	NA	400m.pg151_o3_native.cx7_gcp_c2s60
328220	0	2422	15.3	450.2	105.2	0.007	0.048	0.001	0.328	1397	3.1	0.004	3	78.3	152.2	0.0	0.011	NA	NA	400m.pg151_o3_native_lto.cx7_gcp_c2s60
l.i1
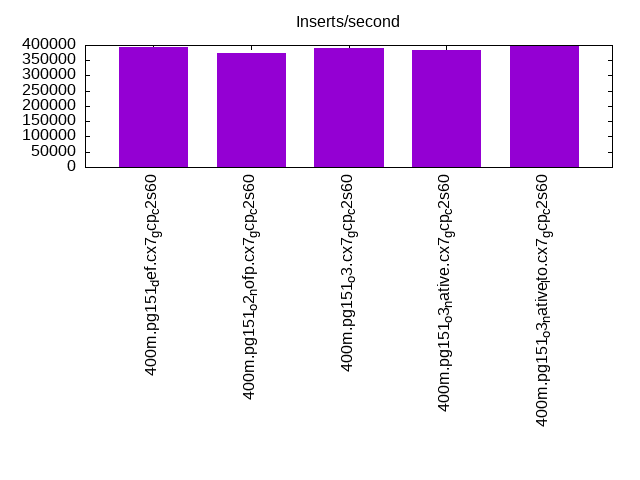
l.i1: continue load after secondary indexes created. Graphs for performance per 1-second interval are here.
Average throughput:
Insert response time histogram: each cell has the percentage of responses that take <= the time in the header and max is the max response time in seconds. For the max column values in the top 25% of the range have a red background and in the bottom 25% of the range have a green background. The red background is not used when the min value is within 80% of the max value.
| dbms | 256us | 1ms | 4ms | 16ms | 64ms | 256ms | 1s | 4s | 16s | gt | max |
|---|---|---|---|---|---|---|---|---|---|---|---|
| pg151_def.cx7_gcp_c2s60 | 94.494 | 4.576 | 0.892 | 0.022 | 0.016 | nonzero | 1.011 | ||||
| pg151_o2_nofp.cx7_gcp_c2s60 | 93.705 | 5.291 | 0.966 | 0.022 | 0.014 | 0.001 | 1.122 | ||||
| pg151_o3.cx7_gcp_c2s60 | 94.500 | 4.499 | 0.960 | 0.025 | 0.016 | 0.701 | |||||
| pg151_o3_native.cx7_gcp_c2s60 | 94.306 | 4.683 | 0.972 | 0.024 | 0.015 | 0.967 | |||||
| pg151_o3_native_lto.cx7_gcp_c2s60 | 94.504 | 4.490 | 0.968 | 0.020 | 0.018 | nonzero | 1.046 |
Performance metrics for the DBMS listed above. Some are normalized by throughput, others are not. Legend for results is here.
ips	qps	rps	rmbps	wps	wmbps	rpq	rkbpq	wpi	wkbpi	csps	cpups	cspq	cpupq	dbgb1	dbgb2	rss	maxop	p50	p99	tag
393314	0	2955	27.5	2526.2	439.6	0.008	0.072	0.006	1.144	281109	54.0	0.715	41	170.2	337.0	NA	1.011	23724	1948	400m.pg151_def.cx7_gcp_c2s60
374532	0	2933	26.4	2514.3	456.4	0.008	0.072	0.007	1.248	298008	53.6	0.796	43	170.2	332.9	0.0	1.122	22737	1849	400m.pg151_o2_nofp.cx7_gcp_c2s60
390625	0	2988	27.5	2427.5	434.8	0.008	0.072	0.006	1.140	266124	53.6	0.681	41	170.2	334.7	NA	0.701	23924	1698	400m.pg151_o3.cx7_gcp_c2s60
384986	0	2886	26.8	2383.1	424.9	0.007	0.071	0.006	1.130	291424	52.9	0.757	41	170.2	332.4	NA	0.967	23524	1599	400m.pg151_o3_native.cx7_gcp_c2s60
396040	0	2999	27.7	2388.5	419.8	0.008	0.072	0.006	1.085	290452	52.3	0.733	40	170.2	329.1	NA	1.046	24383	1448	400m.pg151_o3_native_lto.cx7_gcp_c2s60
q100.1
q100.1: range queries with 100 insert/s per client. Graphs for performance per 1-second interval are here.
Average throughput:
Query response time histogram: each cell has the percentage of responses that take <= the time in the header and max is the max response time in seconds. For max values in the top 25% of the range have a red background and in the bottom 25% of the range have a green background. The red background is not used when the min value is within 80% of the max value.
| dbms | 256us | 1ms | 4ms | 16ms | 64ms | 256ms | 1s | 4s | 16s | gt | max |
|---|---|---|---|---|---|---|---|---|---|---|---|
| pg151_def.cx7_gcp_c2s60 | 99.971 | 0.022 | 0.006 | 0.001 | nonzero | 0.025 | |||||
| pg151_o2_nofp.cx7_gcp_c2s60 | 99.968 | 0.025 | 0.006 | 0.001 | nonzero | 0.024 | |||||
| pg151_o3.cx7_gcp_c2s60 | 99.970 | 0.023 | 0.006 | 0.001 | nonzero | 0.025 | |||||
| pg151_o3_native.cx7_gcp_c2s60 | 99.972 | 0.021 | 0.006 | 0.001 | nonzero | 0.025 | |||||
| pg151_o3_native_lto.cx7_gcp_c2s60 | 99.976 | 0.018 | 0.006 | 0.001 | nonzero | 0.025 |
Insert response time histogram: each cell has the percentage of responses that take <= the time in the header and max is the max response time in seconds. For max values in the top 25% of the range have a red background and in the bottom 25% of the range have a green background. The red background is not used when the min value is within 80% of the max value.
| dbms | 256us | 1ms | 4ms | 16ms | 64ms | 256ms | 1s | 4s | 16s | gt | max |
|---|---|---|---|---|---|---|---|---|---|---|---|
| pg151_def.cx7_gcp_c2s60 | 98.853 | 0.953 | 0.194 | 0.038 | |||||||
| pg151_o2_nofp.cx7_gcp_c2s60 | 98.181 | 1.490 | 0.329 | 0.035 | |||||||
| pg151_o3.cx7_gcp_c2s60 | 98.661 | 1.067 | 0.257 | 0.015 | 0.242 | ||||||
| pg151_o3_native.cx7_gcp_c2s60 | 98.371 | 1.253 | 0.376 | 0.042 | |||||||
| pg151_o3_native_lto.cx7_gcp_c2s60 | 98.606 | 1.081 | 0.311 | 0.003 | 0.090 |
Performance metrics for the DBMS listed above. Some are normalized by throughput, others are not. Legend for results is here.
ips	qps	rps	rmbps	wps	wmbps	rpq	rkbpq	wpi	wkbpi	csps	cpups	cspq	cpupq	dbgb1	dbgb2	rss	maxop	p50	p99	tag
1976	189264	0	0.0	2480.9	71.4	0.000	0.000	1.256	36.998	675879	62.7	3.571	99	171.1	309.3	0.0	0.025	9461	9126	400m.pg151_def.cx7_gcp_c2s60
1976	186206	0	0.0	2634.3	65.3	0.000	0.000	1.333	33.861	666862	62.5	3.581	101	171.1	302.1	0.0	0.024	9286	8966	400m.pg151_o2_nofp.cx7_gcp_c2s60
1976	190229	0	0.0	2495.0	67.5	0.000	0.000	1.263	34.997	679027	62.8	3.570	99	171.1	305.1	0.0	0.025	9430	9094	400m.pg151_o3.cx7_gcp_c2s60
1977	192928	0	0.0	2505.5	71.3	0.000	0.000	1.267	36.957	687097	62.9	3.561	98	171.1	304.2	0.0	0.025	9685	9334	400m.pg151_o3_native.cx7_gcp_c2s60
1976	197884	0	0.0	2523.9	67.8	0.000	0.000	1.277	35.164	705334	62.9	3.564	95	171.1	303.9	0.0	0.025	9817	9477	400m.pg151_o3_native_lto.cx7_gcp_c2s60
q500.1
q500.1: range queries with 500 insert/s per client. Graphs for performance per 1-second interval are here.
Average throughput:
Query response time histogram: each cell has the percentage of responses that take <= the time in the header and max is the max response time in seconds. For max values in the top 25% of the range have a red background and in the bottom 25% of the range have a green background. The red background is not used when the min value is within 80% of the max value.
| dbms | 256us | 1ms | 4ms | 16ms | 64ms | 256ms | 1s | 4s | 16s | gt | max |
|---|---|---|---|---|---|---|---|---|---|---|---|
| pg151_def.cx7_gcp_c2s60 | 99.912 | 0.058 | 0.027 | 0.003 | nonzero | 0.034 | |||||
| pg151_o2_nofp.cx7_gcp_c2s60 | 99.906 | 0.063 | 0.028 | 0.003 | nonzero | 0.026 | |||||
| pg151_o3.cx7_gcp_c2s60 | 99.911 | 0.058 | 0.027 | 0.003 | nonzero | 0.044 | |||||
| pg151_o3_native.cx7_gcp_c2s60 | 99.914 | 0.056 | 0.027 | 0.003 | nonzero | nonzero | 0.081 | ||||
| pg151_o3_native_lto.cx7_gcp_c2s60 | 99.919 | 0.052 | 0.026 | 0.003 | nonzero | 0.035 |
Insert response time histogram: each cell has the percentage of responses that take <= the time in the header and max is the max response time in seconds. For max values in the top 25% of the range have a red background and in the bottom 25% of the range have a green background. The red background is not used when the min value is within 80% of the max value.
| dbms | 256us | 1ms | 4ms | 16ms | 64ms | 256ms | 1s | 4s | 16s | gt | max |
|---|---|---|---|---|---|---|---|---|---|---|---|
| pg151_def.cx7_gcp_c2s60 | 52.069 | 27.623 | 20.009 | 0.299 | 0.181 | ||||||
| pg151_o2_nofp.cx7_gcp_c2s60 | 51.068 | 28.083 | 20.539 | 0.309 | 0.170 | ||||||
| pg151_o3.cx7_gcp_c2s60 | 52.465 | 27.530 | 19.722 | 0.283 | 0.248 | ||||||
| pg151_o3_native.cx7_gcp_c2s60 | 52.888 | 27.311 | 19.505 | 0.296 | 0.235 | ||||||
| pg151_o3_native_lto.cx7_gcp_c2s60 | 52.851 | 27.141 | 19.714 | 0.293 | 0.164 |
Performance metrics for the DBMS listed above. Some are normalized by throughput, others are not. Legend for results is here.
ips	qps	rps	rmbps	wps	wmbps	rpq	rkbpq	wpi	wkbpi	csps	cpups	cspq	cpupq	dbgb1	dbgb2	rss	maxop	p50	p99	tag
9885	191126	0	0.0	4634.4	145.7	0.000	0.000	0.469	15.095	669433	64.0	3.503	100	176.0	262.7	0.0	0.034	9476	9014	400m.pg151_def.cx7_gcp_c2s60
9885	188322	0	0.0	4739.5	148.1	0.000	0.000	0.479	15.345	659745	64.0	3.503	102	176.0	261.6	0.0	0.026	9412	8966	400m.pg151_o2_nofp.cx7_gcp_c2s60
9885	192018	0	0.0	4589.5	144.5	0.000	0.000	0.464	14.974	672852	64.0	3.504	100	176.0	261.0	0.0	0.044	9525	9078	400m.pg151_o3.cx7_gcp_c2s60
9885	193866	0	0.0	4568.0	144.0	0.000	0.000	0.462	14.921	678960	63.6	3.502	98	176.0	260.7	0.0	0.081	9653	9222	400m.pg151_o3_native.cx7_gcp_c2s60
9885	198355	0	0.0	4565.5	143.8	0.000	0.000	0.462	14.900	694603	63.5	3.502	96	176.0	260.7	0.0	0.035	9813	9353	400m.pg151_o3_native_lto.cx7_gcp_c2s60
q1000.1
q1000.1: range queries with 1000 insert/s per client. Graphs for performance per 1-second interval are here.
Average throughput:
Query response time histogram: each cell has the percentage of responses that take <= the time in the header and max is the max response time in seconds. For max values in the top 25% of the range have a red background and in the bottom 25% of the range have a green background. The red background is not used when the min value is within 80% of the max value.
| dbms | 256us | 1ms | 4ms | 16ms | 64ms | 256ms | 1s | 4s | 16s | gt | max |
|---|---|---|---|---|---|---|---|---|---|---|---|
| pg151_def.cx7_gcp_c2s60 | 99.858 | 0.099 | 0.038 | 0.004 | nonzero | 0.040 | |||||
| pg151_o2_nofp.cx7_gcp_c2s60 | 99.855 | 0.103 | 0.038 | 0.004 | nonzero | 0.036 | |||||
| pg151_o3.cx7_gcp_c2s60 | 99.859 | 0.098 | 0.038 | 0.004 | nonzero | 0.049 | |||||
| pg151_o3_native.cx7_gcp_c2s60 | 99.861 | 0.097 | 0.038 | 0.004 | nonzero | 0.042 | |||||
| pg151_o3_native_lto.cx7_gcp_c2s60 | 99.869 | 0.090 | 0.037 | 0.004 | nonzero | 0.036 |
Insert response time histogram: each cell has the percentage of responses that take <= the time in the header and max is the max response time in seconds. For max values in the top 25% of the range have a red background and in the bottom 25% of the range have a green background. The red background is not used when the min value is within 80% of the max value.
| dbms | 256us | 1ms | 4ms | 16ms | 64ms | 256ms | 1s | 4s | 16s | gt | max |
|---|---|---|---|---|---|---|---|---|---|---|---|
| pg151_def.cx7_gcp_c2s60 | 59.979 | 27.070 | 12.699 | 0.252 | 0.176 | ||||||
| pg151_o2_nofp.cx7_gcp_c2s60 | 60.607 | 26.838 | 12.301 | 0.254 | 0.219 | ||||||
| pg151_o3.cx7_gcp_c2s60 | 60.330 | 26.630 | 12.775 | 0.265 | 0.197 | ||||||
| pg151_o3_native.cx7_gcp_c2s60 | 60.032 | 26.898 | 12.818 | 0.252 | 0.212 | ||||||
| pg151_o3_native_lto.cx7_gcp_c2s60 | 61.050 | 26.220 | 12.487 | 0.243 | 0.243 |
Performance metrics for the DBMS listed above. Some are normalized by throughput, others are not. Legend for results is here.
ips	qps	rps	rmbps	wps	wmbps	rpq	rkbpq	wpi	wkbpi	csps	cpups	cspq	cpupq	dbgb1	dbgb2	rss	maxop	p50	p99	tag
19769	194731	0	0.0	4740.2	205.4	0.000	0.000	0.240	10.641	657833	65.3	3.378	101	189.4	270.0	0.0	0.040	9749	9083	400m.pg151_def.cx7_gcp_c2s60
19769	192800	0	0.0	4772.2	204.4	0.000	0.000	0.241	10.588	649519	65.2	3.369	101	189.4	268.9	0.0	0.036	9637	9002	400m.pg151_o2_nofp.cx7_gcp_c2s60
19769	196728	0	0.0	4747.0	204.8	0.000	0.000	0.240	10.609	664452	65.2	3.378	99	189.4	269.2	0.0	0.049	9708	9130	400m.pg151_o3.cx7_gcp_c2s60
19769	198737	0	0.0	4746.1	204.1	0.000	0.000	0.240	10.571	671472	65.2	3.379	98	189.4	269.0	0.0	0.042	9909	9273	400m.pg151_o3_native.cx7_gcp_c2s60
19769	203902	0	0.0	4750.1	205.0	0.000	0.000	0.240	10.616	688505	65.1	3.377	96	189.4	269.0	0.0	0.036	10153	9462	400m.pg151_o3_native_lto.cx7_gcp_c2s60
l.i0
l.i0: load without secondary indexes
Performance metrics for all DBMS, not just the ones listed above. Some are normalized by throughput, others are not. Legend for results is here.
ips	qps	rps	rmbps	wps	wmbps	rpq	rkbpq	wpi	wkbpi	csps	cpups	cspq	cpupq	dbgb1	dbgb2	rss	maxop	p50	p99	tag
1081081	0	0	0.0	1722.9	421.2	0.000	0.000	0.002	0.399	311160	57.7	0.288	16	43.0	116.0	NA	0.608	60425	13984	400m.pg151_def.cx7_gcp_c2s60
1033592	0	0	0.0	1685.4	413.4	0.000	0.000	0.002	0.410	327875	57.2	0.317	17	43.0	117.4	NA	0.980	57560	12087	400m.pg151_o2_nofp.cx7_gcp_c2s60
1095890	0	0	0.0	1720.8	419.5	0.000	0.000	0.002	0.392	301972	57.8	0.276	16	43.0	115.2	NA	0.876	60656	10588	400m.pg151_o3.cx7_gcp_c2s60
1075269	0	0	0.0	1654.6	415.2	0.000	0.000	0.002	0.395	324102	57.2	0.301	16	43.0	116.3	NA	1.306	59657	9789	400m.pg151_o3_native.cx7_gcp_c2s60
1114206	0	0	0.0	1707.0	419.3	0.000	0.000	0.002	0.385	328361	56.9	0.295	15	43.0	113.7	NA	0.984	61933	11287	400m.pg151_o3_native_lto.cx7_gcp_c2s60
l.x
l.x: create secondary indexes
Performance metrics for all DBMS, not just the ones listed above. Some are normalized by throughput, others are not. Legend for results is here.
ips	qps	rps	rmbps	wps	wmbps	rpq	rkbpq	wpi	wkbpi	csps	cpups	cspq	cpupq	dbgb1	dbgb2	rss	maxop	p50	p99	tag
319059	0	2274	14.2	412.2	94.4	0.007	0.045	0.001	0.303	1224	3.0	0.004	3	78.3	152.0	0.0	0.031	NA	NA	400m.pg151_def.cx7_gcp_c2s60
311604	0	1584	15.8	401.9	97.5	0.005	0.052	0.001	0.320	988	3.0	0.003	3	78.3	152.6	0.0	0.002	NA	NA	400m.pg151_o2_nofp.cx7_gcp_c2s60
325549	0	2137	15.1	448.9	106.7	0.007	0.048	0.001	0.335	876	3.1	0.003	3	78.3	152.2	0.0	0.016	NA	NA	400m.pg151_o3.cx7_gcp_c2s60
333695	0	2739	16.1	436.9	102.3	0.008	0.049	0.001	0.314	1028	3.0	0.003	3	78.3	152.5	0.0	0.028	NA	NA	400m.pg151_o3_native.cx7_gcp_c2s60
328220	0	2422	15.3	450.2	105.2	0.007	0.048	0.001	0.328	1397	3.1	0.004	3	78.3	152.2	0.0	0.011	NA	NA	400m.pg151_o3_native_lto.cx7_gcp_c2s60
l.i1
l.i1: continue load after secondary indexes created
Performance metrics for all DBMS, not just the ones listed above. Some are normalized by throughput, others are not. Legend for results is here.
ips	qps	rps	rmbps	wps	wmbps	rpq	rkbpq	wpi	wkbpi	csps	cpups	cspq	cpupq	dbgb1	dbgb2	rss	maxop	p50	p99	tag
393314	0	2955	27.5	2526.2	439.6	0.008	0.072	0.006	1.144	281109	54.0	0.715	41	170.2	337.0	NA	1.011	23724	1948	400m.pg151_def.cx7_gcp_c2s60
374532	0	2933	26.4	2514.3	456.4	0.008	0.072	0.007	1.248	298008	53.6	0.796	43	170.2	332.9	0.0	1.122	22737	1849	400m.pg151_o2_nofp.cx7_gcp_c2s60
390625	0	2988	27.5	2427.5	434.8	0.008	0.072	0.006	1.140	266124	53.6	0.681	41	170.2	334.7	NA	0.701	23924	1698	400m.pg151_o3.cx7_gcp_c2s60
384986	0	2886	26.8	2383.1	424.9	0.007	0.071	0.006	1.130	291424	52.9	0.757	41	170.2	332.4	NA	0.967	23524	1599	400m.pg151_o3_native.cx7_gcp_c2s60
396040	0	2999	27.7	2388.5	419.8	0.008	0.072	0.006	1.085	290452	52.3	0.733	40	170.2	329.1	NA	1.046	24383	1448	400m.pg151_o3_native_lto.cx7_gcp_c2s60
q100.1
q100.1: range queries with 100 insert/s per client
Performance metrics for all DBMS, not just the ones listed above. Some are normalized by throughput, others are not. Legend for results is here.
ips	qps	rps	rmbps	wps	wmbps	rpq	rkbpq	wpi	wkbpi	csps	cpups	cspq	cpupq	dbgb1	dbgb2	rss	maxop	p50	p99	tag
1976	189264	0	0.0	2480.9	71.4	0.000	0.000	1.256	36.998	675879	62.7	3.571	99	171.1	309.3	0.0	0.025	9461	9126	400m.pg151_def.cx7_gcp_c2s60
1976	186206	0	0.0	2634.3	65.3	0.000	0.000	1.333	33.861	666862	62.5	3.581	101	171.1	302.1	0.0	0.024	9286	8966	400m.pg151_o2_nofp.cx7_gcp_c2s60
1976	190229	0	0.0	2495.0	67.5	0.000	0.000	1.263	34.997	679027	62.8	3.570	99	171.1	305.1	0.0	0.025	9430	9094	400m.pg151_o3.cx7_gcp_c2s60
1977	192928	0	0.0	2505.5	71.3	0.000	0.000	1.267	36.957	687097	62.9	3.561	98	171.1	304.2	0.0	0.025	9685	9334	400m.pg151_o3_native.cx7_gcp_c2s60
1976	197884	0	0.0	2523.9	67.8	0.000	0.000	1.277	35.164	705334	62.9	3.564	95	171.1	303.9	0.0	0.025	9817	9477	400m.pg151_o3_native_lto.cx7_gcp_c2s60
q500.1
q500.1: range queries with 500 insert/s per client
Performance metrics for all DBMS, not just the ones listed above. Some are normalized by throughput, others are not. Legend for results is here.
ips	qps	rps	rmbps	wps	wmbps	rpq	rkbpq	wpi	wkbpi	csps	cpups	cspq	cpupq	dbgb1	dbgb2	rss	maxop	p50	p99	tag
9885	191126	0	0.0	4634.4	145.7	0.000	0.000	0.469	15.095	669433	64.0	3.503	100	176.0	262.7	0.0	0.034	9476	9014	400m.pg151_def.cx7_gcp_c2s60
9885	188322	0	0.0	4739.5	148.1	0.000	0.000	0.479	15.345	659745	64.0	3.503	102	176.0	261.6	0.0	0.026	9412	8966	400m.pg151_o2_nofp.cx7_gcp_c2s60
9885	192018	0	0.0	4589.5	144.5	0.000	0.000	0.464	14.974	672852	64.0	3.504	100	176.0	261.0	0.0	0.044	9525	9078	400m.pg151_o3.cx7_gcp_c2s60
9885	193866	0	0.0	4568.0	144.0	0.000	0.000	0.462	14.921	678960	63.6	3.502	98	176.0	260.7	0.0	0.081	9653	9222	400m.pg151_o3_native.cx7_gcp_c2s60
9885	198355	0	0.0	4565.5	143.8	0.000	0.000	0.462	14.900	694603	63.5	3.502	96	176.0	260.7	0.0	0.035	9813	9353	400m.pg151_o3_native_lto.cx7_gcp_c2s60
q1000.1
q1000.1: range queries with 1000 insert/s per client
Performance metrics for all DBMS, not just the ones listed above. Some are normalized by throughput, others are not. Legend for results is here.
ips	qps	rps	rmbps	wps	wmbps	rpq	rkbpq	wpi	wkbpi	csps	cpups	cspq	cpupq	dbgb1	dbgb2	rss	maxop	p50	p99	tag
19769	194731	0	0.0	4740.2	205.4	0.000	0.000	0.240	10.641	657833	65.3	3.378	101	189.4	270.0	0.0	0.040	9749	9083	400m.pg151_def.cx7_gcp_c2s60
19769	192800	0	0.0	4772.2	204.4	0.000	0.000	0.241	10.588	649519	65.2	3.369	101	189.4	268.9	0.0	0.036	9637	9002	400m.pg151_o2_nofp.cx7_gcp_c2s60
19769	196728	0	0.0	4747.0	204.8	0.000	0.000	0.240	10.609	664452	65.2	3.378	99	189.4	269.2	0.0	0.049	9708	9130	400m.pg151_o3.cx7_gcp_c2s60
19769	198737	0	0.0	4746.1	204.1	0.000	0.000	0.240	10.571	671472	65.2	3.379	98	189.4	269.0	0.0	0.042	9909	9273	400m.pg151_o3_native.cx7_gcp_c2s60
19769	203902	0	0.0	4750.1	205.0	0.000	0.000	0.240	10.616	688505	65.1	3.377	96	189.4	269.0	0.0	0.036	10153	9462	400m.pg151_o3_native_lto.cx7_gcp_c2s60
l.i0
- l.i0: load without secondary indexes
- Legend for results is here.
- Each entry lists the percentage of responses that fit in that bucket (slower than max time for previous bucket, faster than min time for next bucket).
Insert response time histogram
256us	1ms	4ms	16ms	64ms	256ms	1s	4s	16s	gt	max	tag
0.000	18.967	77.759	3.213	0.020	0.026	0.016	0.000	0.000	0.000	0.608	pg151_def.cx7_gcp_c2s60
0.000	14.277	81.859	3.804	0.021	0.022	0.016	0.000	0.000	0.000	0.980	pg151_o2_nofp.cx7_gcp_c2s60
0.000	20.514	76.301	3.130	0.017	0.026	0.012	0.000	0.000	0.000	0.876	pg151_o3.cx7_gcp_c2s60
0.000	20.860	75.612	3.474	0.014	0.026	0.014	0.001	0.000	0.000	1.306	pg151_o3_native.cx7_gcp_c2s60
0.000	27.644	69.081	3.222	0.012	0.028	0.013	0.000	0.000	0.000	0.984	pg151_o3_native_lto.cx7_gcp_c2s60
l.x
- l.x: create secondary indexes
- Legend for results is here.
- Each entry lists the percentage of responses that fit in that bucket (slower than max time for previous bucket, faster than min time for next bucket).
TODO - determine whether there is data for create index response time
l.i1
- l.i1: continue load after secondary indexes created
- Legend for results is here.
- Each entry lists the percentage of responses that fit in that bucket (slower than max time for previous bucket, faster than min time for next bucket).
Insert response time histogram
256us	1ms	4ms	16ms	64ms	256ms	1s	4s	16s	gt	max	tag
0.000	0.000	94.494	4.576	0.892	0.022	0.016	nonzero	0.000	0.000	1.011	pg151_def.cx7_gcp_c2s60
0.000	0.000	93.705	5.291	0.966	0.022	0.014	0.001	0.000	0.000	1.122	pg151_o2_nofp.cx7_gcp_c2s60
0.000	0.000	94.500	4.499	0.960	0.025	0.016	0.000	0.000	0.000	0.701	pg151_o3.cx7_gcp_c2s60
0.000	0.000	94.306	4.683	0.972	0.024	0.015	0.000	0.000	0.000	0.967	pg151_o3_native.cx7_gcp_c2s60
0.000	0.000	94.504	4.490	0.968	0.020	0.018	nonzero	0.000	0.000	1.046	pg151_o3_native_lto.cx7_gcp_c2s60
q100.1
- q100.1: range queries with 100 insert/s per client
- Legend for results is here.
- Each entry lists the percentage of responses that fit in that bucket (slower than max time for previous bucket, faster than min time for next bucket).
Query response time histogram
256us	1ms	4ms	16ms	64ms	256ms	1s	4s	16s	gt	max	tag
99.971	0.022	0.006	0.001	nonzero	0.000	0.000	0.000	0.000	0.000	0.025	pg151_def.cx7_gcp_c2s60
99.968	0.025	0.006	0.001	nonzero	0.000	0.000	0.000	0.000	0.000	0.024	pg151_o2_nofp.cx7_gcp_c2s60
99.970	0.023	0.006	0.001	nonzero	0.000	0.000	0.000	0.000	0.000	0.025	pg151_o3.cx7_gcp_c2s60
99.972	0.021	0.006	0.001	nonzero	0.000	0.000	0.000	0.000	0.000	0.025	pg151_o3_native.cx7_gcp_c2s60
99.976	0.018	0.006	0.001	nonzero	0.000	0.000	0.000	0.000	0.000	0.025	pg151_o3_native_lto.cx7_gcp_c2s60
Insert response time histogram
256us	1ms	4ms	16ms	64ms	256ms	1s	4s	16s	gt	max	tag
0.000	0.000	98.853	0.953	0.194	0.000	0.000	0.000	0.000	0.000	0.038	pg151_def.cx7_gcp_c2s60
0.000	0.000	98.181	1.490	0.329	0.000	0.000	0.000	0.000	0.000	0.035	pg151_o2_nofp.cx7_gcp_c2s60
0.000	0.000	98.661	1.067	0.257	0.015	0.000	0.000	0.000	0.000	0.242	pg151_o3.cx7_gcp_c2s60
0.000	0.000	98.371	1.253	0.376	0.000	0.000	0.000	0.000	0.000	0.042	pg151_o3_native.cx7_gcp_c2s60
0.000	0.000	98.606	1.081	0.311	0.003	0.000	0.000	0.000	0.000	0.090	pg151_o3_native_lto.cx7_gcp_c2s60
q500.1
- q500.1: range queries with 500 insert/s per client
- Legend for results is here.
- Each entry lists the percentage of responses that fit in that bucket (slower than max time for previous bucket, faster than min time for next bucket).
Query response time histogram
256us	1ms	4ms	16ms	64ms	256ms	1s	4s	16s	gt	max	tag
99.912	0.058	0.027	0.003	nonzero	0.000	0.000	0.000	0.000	0.000	0.034	pg151_def.cx7_gcp_c2s60
99.906	0.063	0.028	0.003	nonzero	0.000	0.000	0.000	0.000	0.000	0.026	pg151_o2_nofp.cx7_gcp_c2s60
99.911	0.058	0.027	0.003	nonzero	0.000	0.000	0.000	0.000	0.000	0.044	pg151_o3.cx7_gcp_c2s60
99.914	0.056	0.027	0.003	nonzero	nonzero	0.000	0.000	0.000	0.000	0.081	pg151_o3_native.cx7_gcp_c2s60
99.919	0.052	0.026	0.003	nonzero	0.000	0.000	0.000	0.000	0.000	0.035	pg151_o3_native_lto.cx7_gcp_c2s60
Insert response time histogram
256us	1ms	4ms	16ms	64ms	256ms	1s	4s	16s	gt	max	tag
0.000	0.000	52.069	27.623	20.009	0.299	0.000	0.000	0.000	0.000	0.181	pg151_def.cx7_gcp_c2s60
0.000	0.000	51.068	28.083	20.539	0.309	0.000	0.000	0.000	0.000	0.170	pg151_o2_nofp.cx7_gcp_c2s60
0.000	0.000	52.465	27.530	19.722	0.283	0.000	0.000	0.000	0.000	0.248	pg151_o3.cx7_gcp_c2s60
0.000	0.000	52.888	27.311	19.505	0.296	0.000	0.000	0.000	0.000	0.235	pg151_o3_native.cx7_gcp_c2s60
0.000	0.000	52.851	27.141	19.714	0.293	0.000	0.000	0.000	0.000	0.164	pg151_o3_native_lto.cx7_gcp_c2s60
q1000.1
- q1000.1: range queries with 1000 insert/s per client
- Legend for results is here.
- Each entry lists the percentage of responses that fit in that bucket (slower than max time for previous bucket, faster than min time for next bucket).
Query response time histogram
256us	1ms	4ms	16ms	64ms	256ms	1s	4s	16s	gt	max	tag
99.858	0.099	0.038	0.004	nonzero	0.000	0.000	0.000	0.000	0.000	0.040	pg151_def.cx7_gcp_c2s60
99.855	0.103	0.038	0.004	nonzero	0.000	0.000	0.000	0.000	0.000	0.036	pg151_o2_nofp.cx7_gcp_c2s60
99.859	0.098	0.038	0.004	nonzero	0.000	0.000	0.000	0.000	0.000	0.049	pg151_o3.cx7_gcp_c2s60
99.861	0.097	0.038	0.004	nonzero	0.000	0.000	0.000	0.000	0.000	0.042	pg151_o3_native.cx7_gcp_c2s60
99.869	0.090	0.037	0.004	nonzero	0.000	0.000	0.000	0.000	0.000	0.036	pg151_o3_native_lto.cx7_gcp_c2s60
Insert response time histogram
256us	1ms	4ms	16ms	64ms	256ms	1s	4s	16s	gt	max	tag
0.000	0.000	59.979	27.070	12.699	0.252	0.000	0.000	0.000	0.000	0.176	pg151_def.cx7_gcp_c2s60
0.000	0.000	60.607	26.838	12.301	0.254	0.000	0.000	0.000	0.000	0.219	pg151_o2_nofp.cx7_gcp_c2s60
0.000	0.000	60.330	26.630	12.775	0.265	0.000	0.000	0.000	0.000	0.197	pg151_o3.cx7_gcp_c2s60
0.000	0.000	60.032	26.898	12.818	0.252	0.000	0.000	0.000	0.000	0.212	pg151_o3_native.cx7_gcp_c2s60
0.000	0.000	61.050	26.220	12.487	0.243	0.000	0.000	0.000	0.000	0.243	pg151_o3_native_lto.cx7_gcp_c2s60