Introduction
This is a report for the insert benchmark with 400M docs and 20 client(s). It is generated by scripts (bash, awk, sed) and Tufte might not be impressed. An overview of the insert benchmark is here and a short update is here. Below, by DBMS, I mean DBMS+version.config. An example is my8020.c10b40 where my means MySQL, 8020 is version 8.0.20 and c10b40 is the name for the configuration file.
The test server is a c2-standard-60 from GCP with 30 cores, hyperthreading disabled, 240G RAM and 3T from XFS and SW RAID 0 striped over 8 local NVMe drives. The benchmark was run with 20 clients and there were 1 or 2 connections per client (1 for queries, 1 for inserts). The benchmark loads 400M rows without secondary indexes, creates secondary indexes, loads another 400M rows then does 3 read+write tests for one hour each that do queries as fast as possible with 100, 500 and then 1000 writes/second/client concurrent with the queries. Each read-write test runs for 1800 seconds. The test was configured to use a table per client. The database is cached by the storage engine and the only IO is for writes. Clients and the DBMS share one server. The per-database configs are in the per-database subdirectories here.
The tested DBMS are:
- pg151_def.cx7_gcp_c2s60 - Postgres 15.1, the cx7_gcp_c2s60 config and a default build that used -O2
- pg151_o2_nofp.cx7_gcp_c2s60 - Postgres 15.1, the cx7_gcp_c2s60 config and a build that used -O2 -fno-omit-frame-pointer
- pg151_o3.cx7_gcp_c2s60 - Postgres 15.1, the cx7_gcp_c2s60 config and a build that used -O3
- pg151_o3_native.cx7_gcp_c2s60 - Postgres 15.1, the cx7_gcp_c2s60 config and a build that used -O3 -march=native -mtune=native
- pg151_o3_native_lto.cx7_gcp_c2s60 - Postgres 15.1, the cx7_gcp_c2s60 config and a build that used -O3 -march=native -mtune=native -flto (link-time optimization)
Contents
- Summary
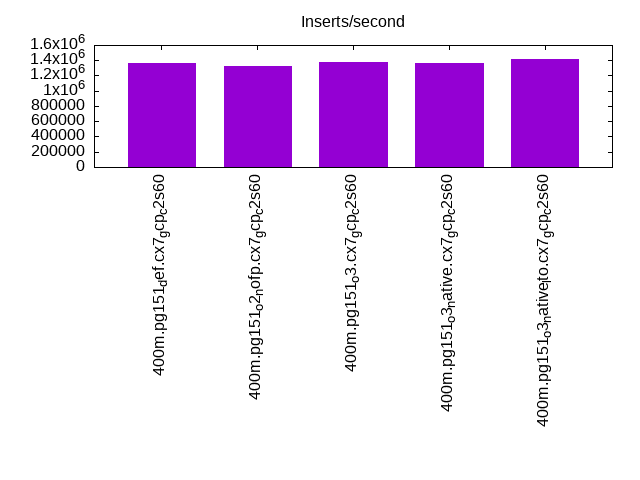
- l.i0: load without secondary indexes
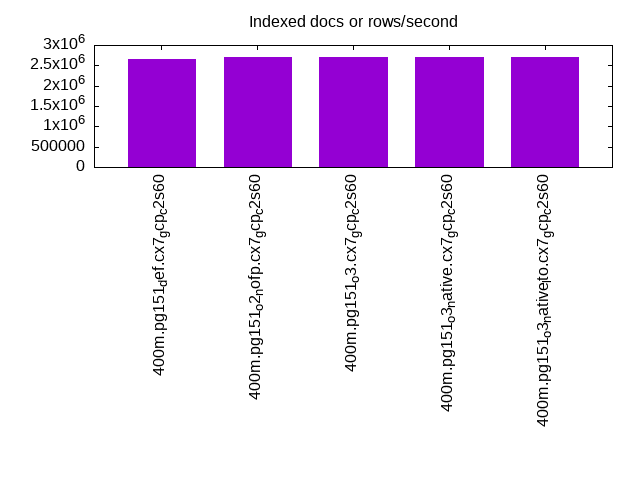
- l.x: create secondary indexes
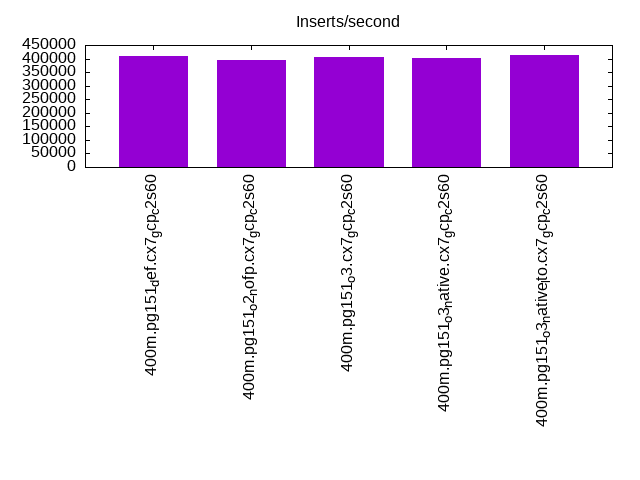
- l.i1: continue load after secondary indexes created
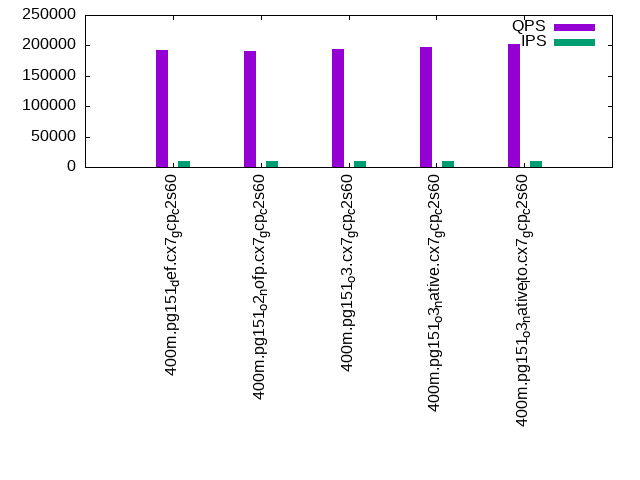
- q100.1: range queries with 100 insert/s per client
- q500.1: range queries with 500 insert/s per client
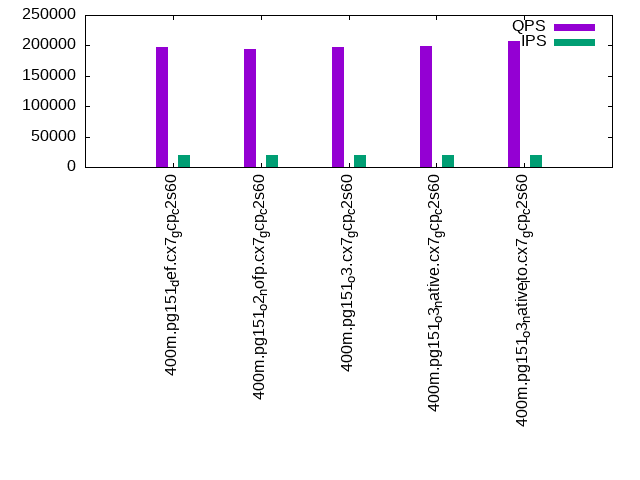
- q1000.1: range queries with 1000 insert/s per client
Summary
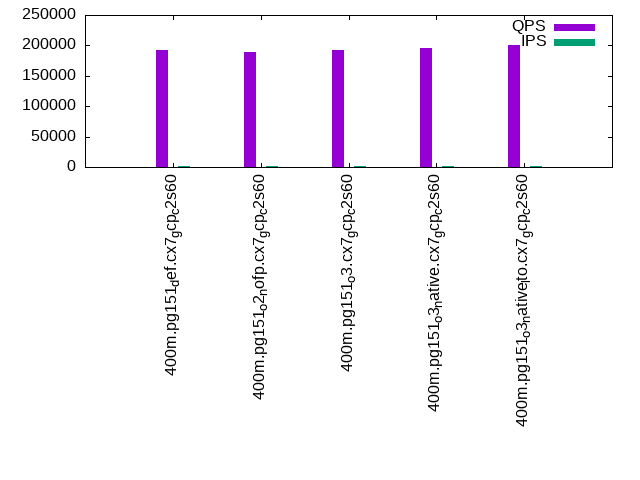
The numbers are inserts/s for l.i0 and l.i1, indexed docs (or rows) /s for l.x and queries/s for q*.2. The values are the average rate over the entire test for inserts (IPS) and queries (QPS). The range of values for IPS and QPS is split into 3 parts: bottom 25%, middle 50%, top 25%. Values in the bottom 25% have a red background, values in the top 25% have a green background and values in the middle have no color. A gray background is used for values that can be ignored because the DBMS did not sustain the target insert rate. Red backgrounds are not used when the minimum value is within 80% of the max value.
| dbms | l.i0 | l.x | l.i1 | q100.1 | q500.1 | q1000.1 |
|---|---|---|---|---|---|---|
| 400m.pg151_def.cx7_gcp_c2s60 | 1365188 | 2667333 | 408163 | 192214 | 193237 | 197311 |
| 400m.pg151_o2_nofp.cx7_gcp_c2s60 | 1328904 | 2703378 | 394867 | 189800 | 190710 | 193978 |
| 400m.pg151_o3.cx7_gcp_c2s60 | 1379310 | 2703378 | 407332 | 192429 | 194243 | 197286 |
| 400m.pg151_o3_native.cx7_gcp_c2s60 | 1369863 | 2703378 | 401606 | 195377 | 196851 | 199574 |
| 400m.pg151_o3_native_lto.cx7_gcp_c2s60 | 1413428 | 2703378 | 411523 | 200643 | 202892 | 206586 |
This lists the average rate of inserts/s for the tests that do inserts concurrent with queries. For such tests the query rate is listed in the table above. The read+write tests are setup so that the insert rate should match the target rate every second. Cells that are not at least 95% of the target have a red background to indicate a failure to satisfy the target.
| dbms | q100.1 | q500.1 | q1000.1 |
|---|---|---|---|
| pg151_def.cx7_gcp_c2s60 | 1976 | 9885 | 19769 |
| pg151_o2_nofp.cx7_gcp_c2s60 | 1976 | 9885 | 19769 |
| pg151_o3.cx7_gcp_c2s60 | 1976 | 9885 | 19769 |
| pg151_o3_native.cx7_gcp_c2s60 | 1977 | 9885 | 19769 |
| pg151_o3_native_lto.cx7_gcp_c2s60 | 1976 | 9885 | 19769 |
| target | 2000 | 10000 | 20000 |
l.i0
l.i0: load without secondary indexes. Graphs for performance per 1-second interval are here.
Average throughput:
Insert response time histogram: each cell has the percentage of responses that take <= the time in the header and max is the max response time in seconds. For the max column values in the top 25% of the range have a red background and in the bottom 25% of the range have a green background. The red background is not used when the min value is within 80% of the max value.
| dbms | 256us | 1ms | 4ms | 16ms | 64ms | 256ms | 1s | 4s | 16s | gt | max |
|---|---|---|---|---|---|---|---|---|---|---|---|
| pg151_def.cx7_gcp_c2s60 | 59.579 | 39.479 | 0.895 | 0.013 | 0.019 | 0.014 | 0.001 | 1.092 | |||
| pg151_o2_nofp.cx7_gcp_c2s60 | 56.851 | 42.188 | 0.913 | 0.011 | 0.021 | 0.016 | 0.660 | ||||
| pg151_o3.cx7_gcp_c2s60 | 60.023 | 39.065 | 0.869 | 0.011 | 0.018 | 0.013 | 0.001 | 1.039 | |||
| pg151_o3_native.cx7_gcp_c2s60 | 57.873 | 41.252 | 0.824 | 0.018 | 0.020 | 0.014 | 0.718 | ||||
| pg151_o3_native_lto.cx7_gcp_c2s60 | 59.717 | 39.458 | 0.775 | 0.014 | 0.023 | 0.014 | 0.637 |
Performance metrics for the DBMS listed above. Some are normalized by throughput, others are not. Legend for results is here.
ips	qps	rps	rmbps	wps	wmbps	rpq	rkbpq	wpi	wkbpi	csps	cpups	cspq	cpupq	dbgb1	dbgb2	rss	maxop	p50	p99	tag
1365188	0	0	0.0	1839.9	456.9	0.000	0.000	0.001	0.343	228873	60.3	0.168	13	38.3	103.4	0.0	1.092	78114	9489	400m.pg151_def.cx7_gcp_c2s60
1328904	0	0	0.0	1820.8	447.7	0.000	0.000	0.001	0.345	238238	59.8	0.179	13	38.3	104.3	NA	0.660	75718	14784	400m.pg151_o2_nofp.cx7_gcp_c2s60
1379310	0	0	0.0	1841.7	457.3	0.000	0.000	0.001	0.339	224469	59.6	0.163	13	38.3	103.4	0.0	1.039	78414	8091	400m.pg151_o3.cx7_gcp_c2s60
1369863	0	0	0.0	1847.5	454.4	0.000	0.000	0.001	0.340	245687	59.8	0.179	13	38.3	103.4	0.0	0.718	77113	15474	400m.pg151_o3_native.cx7_gcp_c2s60
1413428	0	0	0.0	1897.1	467.4	0.000	0.000	0.001	0.339	243763	59.8	0.172	13	38.3	103.4	0.0	0.637	80746	12685	400m.pg151_o3_native_lto.cx7_gcp_c2s60
l.x
l.x: create secondary indexes.
Average throughput:
Performance metrics for the DBMS listed above. Some are normalized by throughput, others are not. Legend for results is here.
ips	qps	rps	rmbps	wps	wmbps	rpq	rkbpq	wpi	wkbpi	csps	cpups	cspq	cpupq	dbgb1	dbgb2	rss	maxop	p50	p99	tag
2667333	0	9080	104.4	3236.6	822.8	0.003	0.040	0.001	0.316	105738	26.1	0.040	3	73.5	172.0	0.0	0.609	NA	NA	400m.pg151_def.cx7_gcp_c2s60
2703378	0	8618	102.9	3278.0	820.8	0.003	0.039	0.001	0.311	106859	26.7	0.040	3	73.5	173.1	0.0	0.184	NA	NA	400m.pg151_o2_nofp.cx7_gcp_c2s60
2703378	0	11424	109.1	3278.1	828.7	0.004	0.041	0.001	0.314	106898	26.6	0.040	3	73.5	171.7	0.0	0.830	NA	NA	400m.pg151_o3.cx7_gcp_c2s60
2703378	0	12535	111.4	3296.1	837.2	0.005	0.042	0.001	0.317	108990	26.2	0.040	3	73.5	172.6	0.0	0.068	NA	NA	400m.pg151_o3_native.cx7_gcp_c2s60
2703378	0	6568	99.7	3275.0	828.7	0.002	0.038	0.001	0.314	109170	26.1	0.040	3	73.5	171.7	0.0	0.103	NA	NA	400m.pg151_o3_native_lto.cx7_gcp_c2s60
l.i1
l.i1: continue load after secondary indexes created. Graphs for performance per 1-second interval are here.
Average throughput:
Insert response time histogram: each cell has the percentage of responses that take <= the time in the header and max is the max response time in seconds. For the max column values in the top 25% of the range have a red background and in the bottom 25% of the range have a green background. The red background is not used when the min value is within 80% of the max value.
| dbms | 256us | 1ms | 4ms | 16ms | 64ms | 256ms | 1s | 4s | 16s | gt | max |
|---|---|---|---|---|---|---|---|---|---|---|---|
| pg151_def.cx7_gcp_c2s60 | nonzero | 96.041 | 2.581 | 1.337 | 0.027 | 0.013 | nonzero | 1.295 | |||
| pg151_o2_nofp.cx7_gcp_c2s60 | 95.754 | 2.862 | 1.343 | 0.028 | 0.013 | 0.883 | |||||
| pg151_o3.cx7_gcp_c2s60 | nonzero | 95.841 | 2.756 | 1.363 | 0.025 | 0.014 | nonzero | 1.259 | |||
| pg151_o3_native.cx7_gcp_c2s60 | 0.002 | 95.850 | 2.755 | 1.351 | 0.027 | 0.014 | nonzero | 1.278 | |||
| pg151_o3_native_lto.cx7_gcp_c2s60 | 0.003 | 95.882 | 2.722 | 1.350 | 0.028 | 0.014 | 0.802 |
Performance metrics for the DBMS listed above. Some are normalized by throughput, others are not. Legend for results is here.
ips	qps	rps	rmbps	wps	wmbps	rpq	rkbpq	wpi	wkbpi	csps	cpups	cspq	cpupq	dbgb1	dbgb2	rss	maxop	p50	p99	tag
408163	0	4889	45.0	3362.7	523.8	0.012	0.113	0.008	1.314	286609	52.1	0.702	38	163.3	355.7	0.0	1.295	25865	1898	400m.pg151_def.cx7_gcp_c2s60
394867	0	5184	40.7	3565.7	517.2	0.013	0.106	0.009	1.341	300194	52.4	0.760	40	163.3	353.5	NA	0.883	24973	1699	400m.pg151_o2_nofp.cx7_gcp_c2s60
407332	0	5317	41.4	3330.6	530.7	0.013	0.104	0.008	1.334	290830	51.9	0.714	38	163.3	358.3	NA	1.259	25922	1848	400m.pg151_o3.cx7_gcp_c2s60
401606	0	5256	41.5	3438.7	520.8	0.013	0.106	0.009	1.328	319646	51.7	0.796	39	163.3	354.2	NA	1.278	25672	1798	400m.pg151_o3_native.cx7_gcp_c2s60
411523	0	5480	42.4	3249.1	533.4	0.013	0.106	0.008	1.327	301967	51.2	0.734	37	163.3	357.5	NA	0.802	26022	1748	400m.pg151_o3_native_lto.cx7_gcp_c2s60
q100.1
q100.1: range queries with 100 insert/s per client. Graphs for performance per 1-second interval are here.
Average throughput:
Query response time histogram: each cell has the percentage of responses that take <= the time in the header and max is the max response time in seconds. For max values in the top 25% of the range have a red background and in the bottom 25% of the range have a green background. The red background is not used when the min value is within 80% of the max value.
| dbms | 256us | 1ms | 4ms | 16ms | 64ms | 256ms | 1s | 4s | 16s | gt | max |
|---|---|---|---|---|---|---|---|---|---|---|---|
| pg151_def.cx7_gcp_c2s60 | 99.972 | 0.020 | 0.006 | 0.001 | nonzero | 0.024 | |||||
| pg151_o2_nofp.cx7_gcp_c2s60 | 99.970 | 0.022 | 0.006 | 0.001 | nonzero | 0.027 | |||||
| pg151_o3.cx7_gcp_c2s60 | 99.971 | 0.021 | 0.006 | 0.001 | nonzero | 0.029 | |||||
| pg151_o3_native.cx7_gcp_c2s60 | 99.973 | 0.020 | 0.006 | 0.001 | nonzero | nonzero | 0.149 | ||||
| pg151_o3_native_lto.cx7_gcp_c2s60 | 99.976 | 0.016 | 0.006 | 0.001 | nonzero | 0.026 |
Insert response time histogram: each cell has the percentage of responses that take <= the time in the header and max is the max response time in seconds. For max values in the top 25% of the range have a red background and in the bottom 25% of the range have a green background. The red background is not used when the min value is within 80% of the max value.
| dbms | 256us | 1ms | 4ms | 16ms | 64ms | 256ms | 1s | 4s | 16s | gt | max |
|---|---|---|---|---|---|---|---|---|---|---|---|
| pg151_def.cx7_gcp_c2s60 | 95.669 | 3.557 | 0.757 | 0.017 | 0.113 | ||||||
| pg151_o2_nofp.cx7_gcp_c2s60 | 88.374 | 9.618 | 2.006 | 0.003 | 0.067 | ||||||
| pg151_o3.cx7_gcp_c2s60 | 95.960 | 3.549 | 0.489 | 0.003 | 0.080 | ||||||
| pg151_o3_native.cx7_gcp_c2s60 | 94.717 | 4.271 | 0.989 | 0.024 | 0.194 | ||||||
| pg151_o3_native_lto.cx7_gcp_c2s60 | 94.090 | 4.844 | 1.065 | 0.049 |
Performance metrics for the DBMS listed above. Some are normalized by throughput, others are not. Legend for results is here.
ips	qps	rps	rmbps	wps	wmbps	rpq	rkbpq	wpi	wkbpi	csps	cpups	cspq	cpupq	dbgb1	dbgb2	rss	maxop	p50	p99	tag
1976	192214	0	0.0	3590.8	83.3	0.000	0.000	1.817	43.178	684782	63.0	3.563	98	163.9	323.6	0.0	0.024	9669	9318	400m.pg151_def.cx7_gcp_c2s60
1976	189800	0	0.0	3464.2	86.7	0.000	0.000	1.753	44.949	677196	62.8	3.568	99	163.9	311.6	0.0	0.027	9477	9094	400m.pg151_o2_nofp.cx7_gcp_c2s60
1976	192429	0	0.0	3564.3	85.5	0.000	0.000	1.804	44.291	686637	62.9	3.568	98	163.9	326.6	0.0	0.029	9637	9270	400m.pg151_o3.cx7_gcp_c2s60
1977	195377	0	0.0	3528.4	86.2	0.000	0.000	1.785	44.665	695098	62.9	3.558	97	163.9	312.1	0.0	0.149	9765	9434	400m.pg151_o3_native.cx7_gcp_c2s60
1976	200643	0	0.0	3578.3	85.3	0.000	0.000	1.811	44.205	714355	62.8	3.560	94	163.9	326.0	0.0	0.026	9973	9605	400m.pg151_o3_native_lto.cx7_gcp_c2s60
q500.1
q500.1: range queries with 500 insert/s per client. Graphs for performance per 1-second interval are here.
Average throughput:
Query response time histogram: each cell has the percentage of responses that take <= the time in the header and max is the max response time in seconds. For max values in the top 25% of the range have a red background and in the bottom 25% of the range have a green background. The red background is not used when the min value is within 80% of the max value.
| dbms | 256us | 1ms | 4ms | 16ms | 64ms | 256ms | 1s | 4s | 16s | gt | max |
|---|---|---|---|---|---|---|---|---|---|---|---|
| pg151_def.cx7_gcp_c2s60 | 99.909 | 0.058 | 0.029 | 0.004 | nonzero | 0.048 | |||||
| pg151_o2_nofp.cx7_gcp_c2s60 | 99.905 | 0.061 | 0.029 | 0.004 | nonzero | nonzero | 0.066 | ||||
| pg151_o3.cx7_gcp_c2s60 | 99.909 | 0.058 | 0.029 | 0.004 | nonzero | 0.051 | |||||
| pg151_o3_native.cx7_gcp_c2s60 | 99.912 | 0.056 | 0.028 | 0.004 | nonzero | 0.041 | |||||
| pg151_o3_native_lto.cx7_gcp_c2s60 | 99.917 | 0.052 | 0.028 | 0.004 | nonzero | 0.056 |
Insert response time histogram: each cell has the percentage of responses that take <= the time in the header and max is the max response time in seconds. For max values in the top 25% of the range have a red background and in the bottom 25% of the range have a green background. The red background is not used when the min value is within 80% of the max value.
| dbms | 256us | 1ms | 4ms | 16ms | 64ms | 256ms | 1s | 4s | 16s | gt | max |
|---|---|---|---|---|---|---|---|---|---|---|---|
| pg151_def.cx7_gcp_c2s60 | 45.225 | 24.976 | 28.588 | 1.211 | 0.167 | ||||||
| pg151_o2_nofp.cx7_gcp_c2s60 | 44.958 | 25.335 | 28.495 | 1.205 | 0.007 | 0.434 | |||||
| pg151_o3.cx7_gcp_c2s60 | 45.263 | 24.724 | 28.799 | 1.214 | 0.216 | ||||||
| pg151_o3_native.cx7_gcp_c2s60 | 45.568 | 24.803 | 28.420 | 1.209 | 0.177 | ||||||
| pg151_o3_native_lto.cx7_gcp_c2s60 | 45.407 | 24.647 | 28.690 | 1.255 | 0.002 | 0.357 |
Performance metrics for the DBMS listed above. Some are normalized by throughput, others are not. Legend for results is here.
ips	qps	rps	rmbps	wps	wmbps	rpq	rkbpq	wpi	wkbpi	csps	cpups	cspq	cpupq	dbgb1	dbgb2	rss	maxop	p50	p99	tag
9885	193237	0	0.0	6214.9	193.6	0.000	0.000	0.629	20.053	675752	63.8	3.497	99	167.5	270.1	0.0	0.048	9669	9158	400m.pg151_def.cx7_gcp_c2s60
9885	190710	0	0.0	6216.2	195.0	0.000	0.000	0.629	20.199	668274	64.1	3.504	101	167.5	269.4	0.0	0.066	9494	8998	400m.pg151_o2_nofp.cx7_gcp_c2s60
9885	194243	0	0.0	6230.7	194.4	0.000	0.000	0.630	20.144	680653	63.7	3.504	98	167.4	271.2	0.0	0.051	9670	9206	400m.pg151_o3.cx7_gcp_c2s60
9885	196851	0	0.0	6138.2	193.0	0.000	0.000	0.621	19.997	689130	63.6	3.501	97	167.5	270.2	0.0	0.041	9733	9254	400m.pg151_o3_native.cx7_gcp_c2s60
9885	202892	0	0.0	6350.4	195.9	0.000	0.000	0.642	20.294	708623	63.8	3.493	94	167.4	272.3	0.0	0.056	10069	9530	400m.pg151_o3_native_lto.cx7_gcp_c2s60
q1000.1
q1000.1: range queries with 1000 insert/s per client. Graphs for performance per 1-second interval are here.
Average throughput:
Query response time histogram: each cell has the percentage of responses that take <= the time in the header and max is the max response time in seconds. For max values in the top 25% of the range have a red background and in the bottom 25% of the range have a green background. The red background is not used when the min value is within 80% of the max value.
| dbms | 256us | 1ms | 4ms | 16ms | 64ms | 256ms | 1s | 4s | 16s | gt | max |
|---|---|---|---|---|---|---|---|---|---|---|---|
| pg151_def.cx7_gcp_c2s60 | 99.853 | 0.097 | 0.042 | 0.008 | nonzero | nonzero | 0.097 | ||||
| pg151_o2_nofp.cx7_gcp_c2s60 | 99.844 | 0.105 | 0.043 | 0.008 | 0.001 | nonzero | 0.157 | ||||
| pg151_o3.cx7_gcp_c2s60 | 99.850 | 0.100 | 0.042 | 0.008 | 0.001 | nonzero | 0.115 | ||||
| pg151_o3_native.cx7_gcp_c2s60 | 99.851 | 0.099 | 0.042 | 0.008 | nonzero | nonzero | 0.151 | ||||
| pg151_o3_native_lto.cx7_gcp_c2s60 | 99.863 | 0.089 | 0.041 | 0.007 | nonzero | 0.060 |
Insert response time histogram: each cell has the percentage of responses that take <= the time in the header and max is the max response time in seconds. For max values in the top 25% of the range have a red background and in the bottom 25% of the range have a green background. The red background is not used when the min value is within 80% of the max value.
| dbms | 256us | 1ms | 4ms | 16ms | 64ms | 256ms | 1s | 4s | 16s | gt | max |
|---|---|---|---|---|---|---|---|---|---|---|---|
| pg151_def.cx7_gcp_c2s60 | 58.479 | 21.546 | 19.083 | 0.893 | 0.232 | ||||||
| pg151_o2_nofp.cx7_gcp_c2s60 | 57.181 | 22.479 | 19.405 | 0.936 | 0.239 | ||||||
| pg151_o3.cx7_gcp_c2s60 | 58.508 | 21.679 | 18.910 | 0.902 | 0.227 | ||||||
| pg151_o3_native.cx7_gcp_c2s60 | 57.656 | 21.983 | 19.383 | 0.978 | 0.242 | ||||||
| pg151_o3_native_lto.cx7_gcp_c2s60 | 59.319 | 21.184 | 18.631 | 0.866 | 0.209 |
Performance metrics for the DBMS listed above. Some are normalized by throughput, others are not. Legend for results is here.
ips	qps	rps	rmbps	wps	wmbps	rpq	rkbpq	wpi	wkbpi	csps	cpups	cspq	cpupq	dbgb1	dbgb2	rss	maxop	p50	p99	tag
19769	197311	0	0.0	6355.0	268.4	0.000	0.000	0.321	13.905	669559	65.2	3.393	99	179.6	279.3	0.0	0.097	9813	8886	400m.pg151_def.cx7_gcp_c2s60
19769	193978	0	0.0	6337.5	273.0	0.000	0.000	0.321	14.140	659211	65.3	3.398	101	179.6	278.6	0.0	0.157	9781	8870	400m.pg151_o2_nofp.cx7_gcp_c2s60
19769	197286	0	0.0	6345.5	268.7	0.000	0.000	0.321	13.916	670882	65.2	3.401	99	179.6	280.0	0.0	0.115	9813	8806	400m.pg151_o3.cx7_gcp_c2s60
19769	199574	0	0.0	6343.1	271.7	0.000	0.000	0.321	14.072	679278	65.0	3.404	98	179.6	279.4	0.0	0.151	9967	8982	400m.pg151_o3_native.cx7_gcp_c2s60
19769	206586	0	0.0	6302.9	266.1	0.000	0.000	0.319	13.783	701415	64.9	3.395	94	179.6	280.7	0.0	0.060	10293	9382	400m.pg151_o3_native_lto.cx7_gcp_c2s60
l.i0
l.i0: load without secondary indexes
Performance metrics for all DBMS, not just the ones listed above. Some are normalized by throughput, others are not. Legend for results is here.
ips	qps	rps	rmbps	wps	wmbps	rpq	rkbpq	wpi	wkbpi	csps	cpups	cspq	cpupq	dbgb1	dbgb2	rss	maxop	p50	p99	tag
1365188	0	0	0.0	1839.9	456.9	0.000	0.000	0.001	0.343	228873	60.3	0.168	13	38.3	103.4	0.0	1.092	78114	9489	400m.pg151_def.cx7_gcp_c2s60
1328904	0	0	0.0	1820.8	447.7	0.000	0.000	0.001	0.345	238238	59.8	0.179	13	38.3	104.3	NA	0.660	75718	14784	400m.pg151_o2_nofp.cx7_gcp_c2s60
1379310	0	0	0.0	1841.7	457.3	0.000	0.000	0.001	0.339	224469	59.6	0.163	13	38.3	103.4	0.0	1.039	78414	8091	400m.pg151_o3.cx7_gcp_c2s60
1369863	0	0	0.0	1847.5	454.4	0.000	0.000	0.001	0.340	245687	59.8	0.179	13	38.3	103.4	0.0	0.718	77113	15474	400m.pg151_o3_native.cx7_gcp_c2s60
1413428	0	0	0.0	1897.1	467.4	0.000	0.000	0.001	0.339	243763	59.8	0.172	13	38.3	103.4	0.0	0.637	80746	12685	400m.pg151_o3_native_lto.cx7_gcp_c2s60
l.x
l.x: create secondary indexes
Performance metrics for all DBMS, not just the ones listed above. Some are normalized by throughput, others are not. Legend for results is here.
ips	qps	rps	rmbps	wps	wmbps	rpq	rkbpq	wpi	wkbpi	csps	cpups	cspq	cpupq	dbgb1	dbgb2	rss	maxop	p50	p99	tag
2667333	0	9080	104.4	3236.6	822.8	0.003	0.040	0.001	0.316	105738	26.1	0.040	3	73.5	172.0	0.0	0.609	NA	NA	400m.pg151_def.cx7_gcp_c2s60
2703378	0	8618	102.9	3278.0	820.8	0.003	0.039	0.001	0.311	106859	26.7	0.040	3	73.5	173.1	0.0	0.184	NA	NA	400m.pg151_o2_nofp.cx7_gcp_c2s60
2703378	0	11424	109.1	3278.1	828.7	0.004	0.041	0.001	0.314	106898	26.6	0.040	3	73.5	171.7	0.0	0.830	NA	NA	400m.pg151_o3.cx7_gcp_c2s60
2703378	0	12535	111.4	3296.1	837.2	0.005	0.042	0.001	0.317	108990	26.2	0.040	3	73.5	172.6	0.0	0.068	NA	NA	400m.pg151_o3_native.cx7_gcp_c2s60
2703378	0	6568	99.7	3275.0	828.7	0.002	0.038	0.001	0.314	109170	26.1	0.040	3	73.5	171.7	0.0	0.103	NA	NA	400m.pg151_o3_native_lto.cx7_gcp_c2s60
l.i1
l.i1: continue load after secondary indexes created
Performance metrics for all DBMS, not just the ones listed above. Some are normalized by throughput, others are not. Legend for results is here.
ips	qps	rps	rmbps	wps	wmbps	rpq	rkbpq	wpi	wkbpi	csps	cpups	cspq	cpupq	dbgb1	dbgb2	rss	maxop	p50	p99	tag
408163	0	4889	45.0	3362.7	523.8	0.012	0.113	0.008	1.314	286609	52.1	0.702	38	163.3	355.7	0.0	1.295	25865	1898	400m.pg151_def.cx7_gcp_c2s60
394867	0	5184	40.7	3565.7	517.2	0.013	0.106	0.009	1.341	300194	52.4	0.760	40	163.3	353.5	NA	0.883	24973	1699	400m.pg151_o2_nofp.cx7_gcp_c2s60
407332	0	5317	41.4	3330.6	530.7	0.013	0.104	0.008	1.334	290830	51.9	0.714	38	163.3	358.3	NA	1.259	25922	1848	400m.pg151_o3.cx7_gcp_c2s60
401606	0	5256	41.5	3438.7	520.8	0.013	0.106	0.009	1.328	319646	51.7	0.796	39	163.3	354.2	NA	1.278	25672	1798	400m.pg151_o3_native.cx7_gcp_c2s60
411523	0	5480	42.4	3249.1	533.4	0.013	0.106	0.008	1.327	301967	51.2	0.734	37	163.3	357.5	NA	0.802	26022	1748	400m.pg151_o3_native_lto.cx7_gcp_c2s60
q100.1
q100.1: range queries with 100 insert/s per client
Performance metrics for all DBMS, not just the ones listed above. Some are normalized by throughput, others are not. Legend for results is here.
ips	qps	rps	rmbps	wps	wmbps	rpq	rkbpq	wpi	wkbpi	csps	cpups	cspq	cpupq	dbgb1	dbgb2	rss	maxop	p50	p99	tag
1976	192214	0	0.0	3590.8	83.3	0.000	0.000	1.817	43.178	684782	63.0	3.563	98	163.9	323.6	0.0	0.024	9669	9318	400m.pg151_def.cx7_gcp_c2s60
1976	189800	0	0.0	3464.2	86.7	0.000	0.000	1.753	44.949	677196	62.8	3.568	99	163.9	311.6	0.0	0.027	9477	9094	400m.pg151_o2_nofp.cx7_gcp_c2s60
1976	192429	0	0.0	3564.3	85.5	0.000	0.000	1.804	44.291	686637	62.9	3.568	98	163.9	326.6	0.0	0.029	9637	9270	400m.pg151_o3.cx7_gcp_c2s60
1977	195377	0	0.0	3528.4	86.2	0.000	0.000	1.785	44.665	695098	62.9	3.558	97	163.9	312.1	0.0	0.149	9765	9434	400m.pg151_o3_native.cx7_gcp_c2s60
1976	200643	0	0.0	3578.3	85.3	0.000	0.000	1.811	44.205	714355	62.8	3.560	94	163.9	326.0	0.0	0.026	9973	9605	400m.pg151_o3_native_lto.cx7_gcp_c2s60
q500.1
q500.1: range queries with 500 insert/s per client
Performance metrics for all DBMS, not just the ones listed above. Some are normalized by throughput, others are not. Legend for results is here.
ips	qps	rps	rmbps	wps	wmbps	rpq	rkbpq	wpi	wkbpi	csps	cpups	cspq	cpupq	dbgb1	dbgb2	rss	maxop	p50	p99	tag
9885	193237	0	0.0	6214.9	193.6	0.000	0.000	0.629	20.053	675752	63.8	3.497	99	167.5	270.1	0.0	0.048	9669	9158	400m.pg151_def.cx7_gcp_c2s60
9885	190710	0	0.0	6216.2	195.0	0.000	0.000	0.629	20.199	668274	64.1	3.504	101	167.5	269.4	0.0	0.066	9494	8998	400m.pg151_o2_nofp.cx7_gcp_c2s60
9885	194243	0	0.0	6230.7	194.4	0.000	0.000	0.630	20.144	680653	63.7	3.504	98	167.4	271.2	0.0	0.051	9670	9206	400m.pg151_o3.cx7_gcp_c2s60
9885	196851	0	0.0	6138.2	193.0	0.000	0.000	0.621	19.997	689130	63.6	3.501	97	167.5	270.2	0.0	0.041	9733	9254	400m.pg151_o3_native.cx7_gcp_c2s60
9885	202892	0	0.0	6350.4	195.9	0.000	0.000	0.642	20.294	708623	63.8	3.493	94	167.4	272.3	0.0	0.056	10069	9530	400m.pg151_o3_native_lto.cx7_gcp_c2s60
q1000.1
q1000.1: range queries with 1000 insert/s per client
Performance metrics for all DBMS, not just the ones listed above. Some are normalized by throughput, others are not. Legend for results is here.
ips	qps	rps	rmbps	wps	wmbps	rpq	rkbpq	wpi	wkbpi	csps	cpups	cspq	cpupq	dbgb1	dbgb2	rss	maxop	p50	p99	tag
19769	197311	0	0.0	6355.0	268.4	0.000	0.000	0.321	13.905	669559	65.2	3.393	99	179.6	279.3	0.0	0.097	9813	8886	400m.pg151_def.cx7_gcp_c2s60
19769	193978	0	0.0	6337.5	273.0	0.000	0.000	0.321	14.140	659211	65.3	3.398	101	179.6	278.6	0.0	0.157	9781	8870	400m.pg151_o2_nofp.cx7_gcp_c2s60
19769	197286	0	0.0	6345.5	268.7	0.000	0.000	0.321	13.916	670882	65.2	3.401	99	179.6	280.0	0.0	0.115	9813	8806	400m.pg151_o3.cx7_gcp_c2s60
19769	199574	0	0.0	6343.1	271.7	0.000	0.000	0.321	14.072	679278	65.0	3.404	98	179.6	279.4	0.0	0.151	9967	8982	400m.pg151_o3_native.cx7_gcp_c2s60
19769	206586	0	0.0	6302.9	266.1	0.000	0.000	0.319	13.783	701415	64.9	3.395	94	179.6	280.7	0.0	0.060	10293	9382	400m.pg151_o3_native_lto.cx7_gcp_c2s60
l.i0
- l.i0: load without secondary indexes
- Legend for results is here.
- Each entry lists the percentage of responses that fit in that bucket (slower than max time for previous bucket, faster than min time for next bucket).
Insert response time histogram
256us	1ms	4ms	16ms	64ms	256ms	1s	4s	16s	gt	max	tag
0.000	59.579	39.479	0.895	0.013	0.019	0.014	0.001	0.000	0.000	1.092	pg151_def.cx7_gcp_c2s60
0.000	56.851	42.188	0.913	0.011	0.021	0.016	0.000	0.000	0.000	0.660	pg151_o2_nofp.cx7_gcp_c2s60
0.000	60.023	39.065	0.869	0.011	0.018	0.013	0.001	0.000	0.000	1.039	pg151_o3.cx7_gcp_c2s60
0.000	57.873	41.252	0.824	0.018	0.020	0.014	0.000	0.000	0.000	0.718	pg151_o3_native.cx7_gcp_c2s60
0.000	59.717	39.458	0.775	0.014	0.023	0.014	0.000	0.000	0.000	0.637	pg151_o3_native_lto.cx7_gcp_c2s60
l.x
- l.x: create secondary indexes
- Legend for results is here.
- Each entry lists the percentage of responses that fit in that bucket (slower than max time for previous bucket, faster than min time for next bucket).
TODO - determine whether there is data for create index response time
l.i1
- l.i1: continue load after secondary indexes created
- Legend for results is here.
- Each entry lists the percentage of responses that fit in that bucket (slower than max time for previous bucket, faster than min time for next bucket).
Insert response time histogram
256us	1ms	4ms	16ms	64ms	256ms	1s	4s	16s	gt	max	tag
0.000	nonzero	96.041	2.581	1.337	0.027	0.013	nonzero	0.000	0.000	1.295	pg151_def.cx7_gcp_c2s60
0.000	0.000	95.754	2.862	1.343	0.028	0.013	0.000	0.000	0.000	0.883	pg151_o2_nofp.cx7_gcp_c2s60
0.000	nonzero	95.841	2.756	1.363	0.025	0.014	nonzero	0.000	0.000	1.259	pg151_o3.cx7_gcp_c2s60
0.000	0.002	95.850	2.755	1.351	0.027	0.014	nonzero	0.000	0.000	1.278	pg151_o3_native.cx7_gcp_c2s60
0.000	0.003	95.882	2.722	1.350	0.028	0.014	0.000	0.000	0.000	0.802	pg151_o3_native_lto.cx7_gcp_c2s60
q100.1
- q100.1: range queries with 100 insert/s per client
- Legend for results is here.
- Each entry lists the percentage of responses that fit in that bucket (slower than max time for previous bucket, faster than min time for next bucket).
Query response time histogram
256us	1ms	4ms	16ms	64ms	256ms	1s	4s	16s	gt	max	tag
99.972	0.020	0.006	0.001	nonzero	0.000	0.000	0.000	0.000	0.000	0.024	pg151_def.cx7_gcp_c2s60
99.970	0.022	0.006	0.001	nonzero	0.000	0.000	0.000	0.000	0.000	0.027	pg151_o2_nofp.cx7_gcp_c2s60
99.971	0.021	0.006	0.001	nonzero	0.000	0.000	0.000	0.000	0.000	0.029	pg151_o3.cx7_gcp_c2s60
99.973	0.020	0.006	0.001	nonzero	nonzero	0.000	0.000	0.000	0.000	0.149	pg151_o3_native.cx7_gcp_c2s60
99.976	0.016	0.006	0.001	nonzero	0.000	0.000	0.000	0.000	0.000	0.026	pg151_o3_native_lto.cx7_gcp_c2s60
Insert response time histogram
256us	1ms	4ms	16ms	64ms	256ms	1s	4s	16s	gt	max	tag
0.000	0.000	95.669	3.557	0.757	0.017	0.000	0.000	0.000	0.000	0.113	pg151_def.cx7_gcp_c2s60
0.000	0.000	88.374	9.618	2.006	0.003	0.000	0.000	0.000	0.000	0.067	pg151_o2_nofp.cx7_gcp_c2s60
0.000	0.000	95.960	3.549	0.489	0.003	0.000	0.000	0.000	0.000	0.080	pg151_o3.cx7_gcp_c2s60
0.000	0.000	94.717	4.271	0.989	0.024	0.000	0.000	0.000	0.000	0.194	pg151_o3_native.cx7_gcp_c2s60
0.000	0.000	94.090	4.844	1.065	0.000	0.000	0.000	0.000	0.000	0.049	pg151_o3_native_lto.cx7_gcp_c2s60
q500.1
- q500.1: range queries with 500 insert/s per client
- Legend for results is here.
- Each entry lists the percentage of responses that fit in that bucket (slower than max time for previous bucket, faster than min time for next bucket).
Query response time histogram
256us	1ms	4ms	16ms	64ms	256ms	1s	4s	16s	gt	max	tag
99.909	0.058	0.029	0.004	nonzero	0.000	0.000	0.000	0.000	0.000	0.048	pg151_def.cx7_gcp_c2s60
99.905	0.061	0.029	0.004	nonzero	nonzero	0.000	0.000	0.000	0.000	0.066	pg151_o2_nofp.cx7_gcp_c2s60
99.909	0.058	0.029	0.004	nonzero	0.000	0.000	0.000	0.000	0.000	0.051	pg151_o3.cx7_gcp_c2s60
99.912	0.056	0.028	0.004	nonzero	0.000	0.000	0.000	0.000	0.000	0.041	pg151_o3_native.cx7_gcp_c2s60
99.917	0.052	0.028	0.004	nonzero	0.000	0.000	0.000	0.000	0.000	0.056	pg151_o3_native_lto.cx7_gcp_c2s60
Insert response time histogram
256us	1ms	4ms	16ms	64ms	256ms	1s	4s	16s	gt	max	tag
0.000	0.000	45.225	24.976	28.588	1.211	0.000	0.000	0.000	0.000	0.167	pg151_def.cx7_gcp_c2s60
0.000	0.000	44.958	25.335	28.495	1.205	0.007	0.000	0.000	0.000	0.434	pg151_o2_nofp.cx7_gcp_c2s60
0.000	0.000	45.263	24.724	28.799	1.214	0.000	0.000	0.000	0.000	0.216	pg151_o3.cx7_gcp_c2s60
0.000	0.000	45.568	24.803	28.420	1.209	0.000	0.000	0.000	0.000	0.177	pg151_o3_native.cx7_gcp_c2s60
0.000	0.000	45.407	24.647	28.690	1.255	0.002	0.000	0.000	0.000	0.357	pg151_o3_native_lto.cx7_gcp_c2s60
q1000.1
- q1000.1: range queries with 1000 insert/s per client
- Legend for results is here.
- Each entry lists the percentage of responses that fit in that bucket (slower than max time for previous bucket, faster than min time for next bucket).
Query response time histogram
256us	1ms	4ms	16ms	64ms	256ms	1s	4s	16s	gt	max	tag
99.853	0.097	0.042	0.008	nonzero	nonzero	0.000	0.000	0.000	0.000	0.097	pg151_def.cx7_gcp_c2s60
99.844	0.105	0.043	0.008	0.001	nonzero	0.000	0.000	0.000	0.000	0.157	pg151_o2_nofp.cx7_gcp_c2s60
99.850	0.100	0.042	0.008	0.001	nonzero	0.000	0.000	0.000	0.000	0.115	pg151_o3.cx7_gcp_c2s60
99.851	0.099	0.042	0.008	nonzero	nonzero	0.000	0.000	0.000	0.000	0.151	pg151_o3_native.cx7_gcp_c2s60
99.863	0.089	0.041	0.007	nonzero	0.000	0.000	0.000	0.000	0.000	0.060	pg151_o3_native_lto.cx7_gcp_c2s60
Insert response time histogram
256us	1ms	4ms	16ms	64ms	256ms	1s	4s	16s	gt	max	tag
0.000	0.000	58.479	21.546	19.083	0.893	0.000	0.000	0.000	0.000	0.232	pg151_def.cx7_gcp_c2s60
0.000	0.000	57.181	22.479	19.405	0.936	0.000	0.000	0.000	0.000	0.239	pg151_o2_nofp.cx7_gcp_c2s60
0.000	0.000	58.508	21.679	18.910	0.902	0.000	0.000	0.000	0.000	0.227	pg151_o3.cx7_gcp_c2s60
0.000	0.000	57.656	21.983	19.383	0.978	0.000	0.000	0.000	0.000	0.242	pg151_o3_native.cx7_gcp_c2s60
0.000	0.000	59.319	21.184	18.631	0.866	0.000	0.000	0.000	0.000	0.209	pg151_o3_native_lto.cx7_gcp_c2s60