Introduction
This is a report for the insert benchmark with 400M docs and 20 client(s). It is generated by scripts (bash, awk, sed) and Tufte might not be impressed. An overview of the insert benchmark is here and a short update is here. Below, by DBMS, I mean DBMS+version.config. An example is my8020.c10b40 where my means MySQL, 8020 is version 8.0.20 and c10b40 is the name for the configuration file.
The test server is a c2-standard-60 from GCP with 30 cores, hyperthreading disabled, 240G RAM and 3T from XFS and SW RAID 0 striped over 8 local NVMe drives. The benchmark was run with 20 clients and there were 1 or 2 connections per client (1 for queries, 1 for inserts). The benchmark loads 400M rows without secondary indexes, creates secondary indexes, loads another 400M rows then does 3 read+write tests for one hour each that do queries as fast as possible with 100, 500 and then 1000 writes/second/client concurrent with the queries. Each read-write test runs for 1800 seconds. The test was configured to use one table. The database is cached by the storage engine and the only IO is for writes. Clients and the DBMS share one server. The per-database configs are in the per-database subdirectories here.
The tested DBMS are:
- pg147_def.cx7_gcp_c2s60 - Postgres 14.7, the cx7_gcp_c2s60 config and a default build that used -O2
- pg147_o3_native_lto.cx7_gcp_c2s60 - Postgres 14.7, the cx7_gcp_c2s60 config and a build that uses -O3 -march=native -mtune=native -flto (link-time optimization)
Contents
- Summary
- l.i0: load without secondary indexes
- l.x: create secondary indexes
- l.i1: continue load after secondary indexes created
- q100.1: range queries with 100 insert/s per client
- q500.1: range queries with 500 insert/s per client
- q1000.1: range queries with 1000 insert/s per client
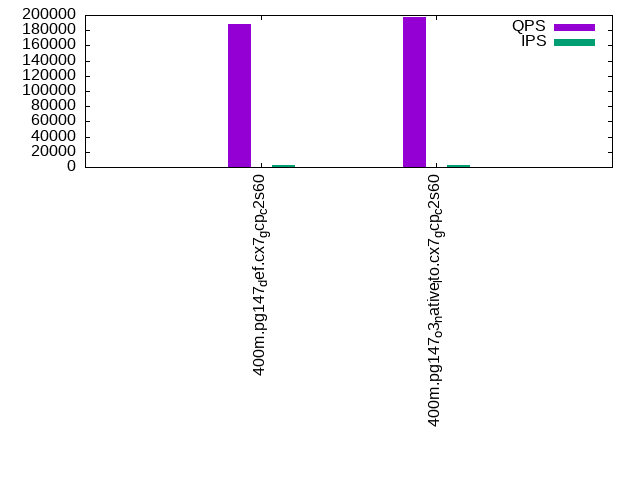
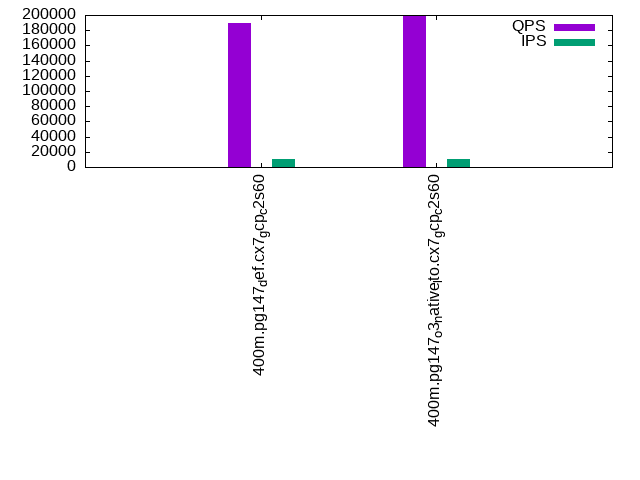
Summary
The numbers are inserts/s for l.i0 and l.i1, indexed docs (or rows) /s for l.x and queries/s for q*.2. The values are the average rate over the entire test for inserts (IPS) and queries (QPS). The range of values for IPS and QPS is split into 3 parts: bottom 25%, middle 50%, top 25%. Values in the bottom 25% have a red background, values in the top 25% have a green background and values in the middle have no color. A gray background is used for values that can be ignored because the DBMS did not sustain the target insert rate. Red backgrounds are not used when the minimum value is within 80% of the max value.
| dbms | l.i0 | l.x | l.i1 | q100.1 | q500.1 | q1000.1 |
|---|---|---|---|---|---|---|
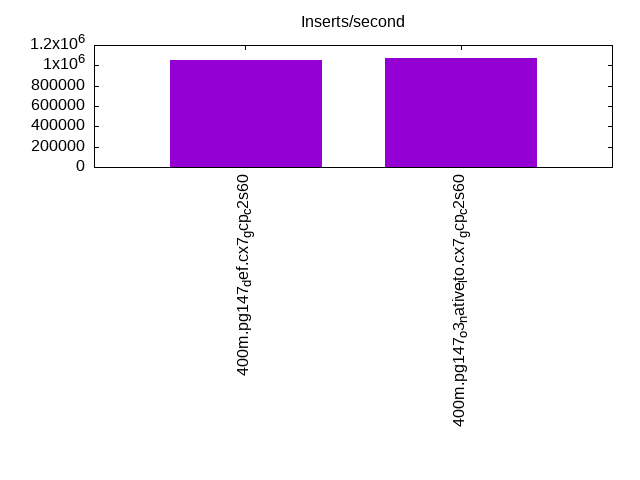
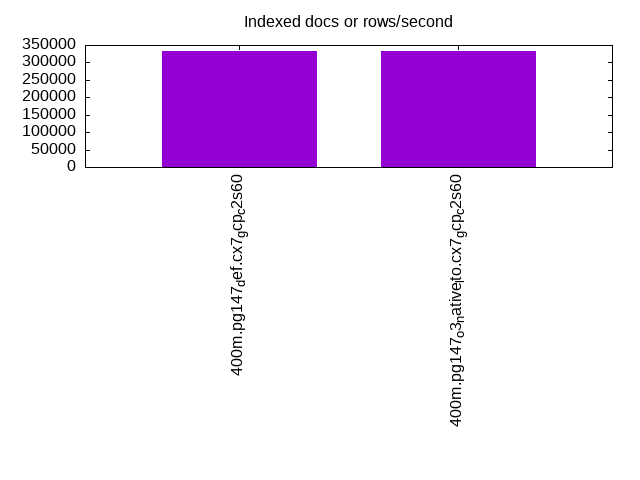
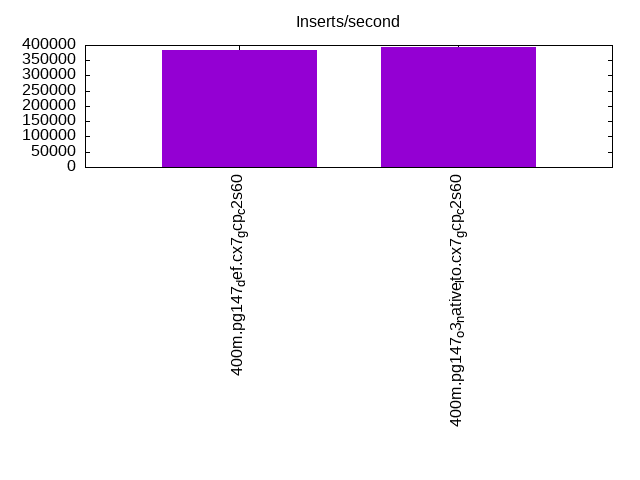
| 400m.pg147_def.cx7_gcp_c2s60 | 1052632 | 332033 | 384986 | 188429 | 189869 | 195090 |
| 400m.pg147_o3_native_lto.cx7_gcp_c2s60 | 1072386 | 331483 | 392157 | 196892 | 198364 | 203390 |
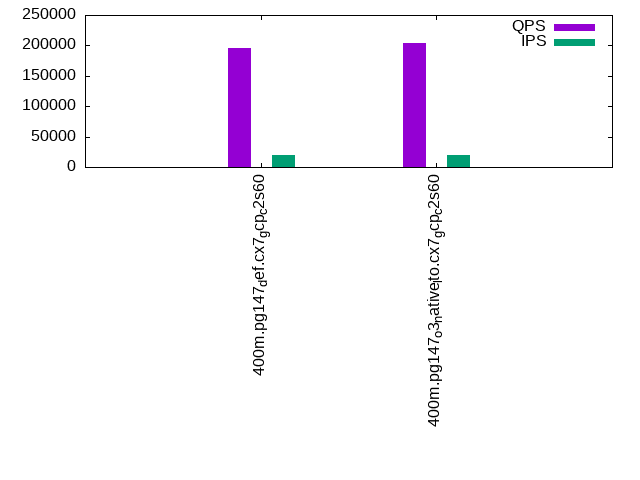
This lists the average rate of inserts/s for the tests that do inserts concurrent with queries. For such tests the query rate is listed in the table above. The read+write tests are setup so that the insert rate should match the target rate every second. Cells that are not at least 95% of the target have a red background to indicate a failure to satisfy the target.
| dbms | q100.1 | q500.1 | q1000.1 |
|---|---|---|---|
| pg147_def.cx7_gcp_c2s60 | 1976 | 9890 | 19769 |
| pg147_o3_native_lto.cx7_gcp_c2s60 | 1976 | 9885 | 19769 |
| target | 2000 | 10000 | 20000 |
l.i0
l.i0: load without secondary indexes. Graphs for performance per 1-second interval are here.
Average throughput:
Insert response time histogram: each cell has the percentage of responses that take <= the time in the header and max is the max response time in seconds. For the max column values in the top 25% of the range have a red background and in the bottom 25% of the range have a green background. The red background is not used when the min value is within 80% of the max value.
| dbms | 256us | 1ms | 4ms | 16ms | 64ms | 256ms | 1s | 4s | 16s | gt | max |
|---|---|---|---|---|---|---|---|---|---|---|---|
| pg147_def.cx7_gcp_c2s60 | 14.988 | 81.429 | 3.519 | 0.024 | 0.025 | 0.014 | 0.001 | 1.218 | |||
| pg147_o3_native_lto.cx7_gcp_c2s60 | 22.426 | 74.038 | 3.478 | 0.019 | 0.025 | 0.013 | 0.001 | 1.364 |
Performance metrics for the DBMS listed above. Some are normalized by throughput, others are not. Legend for results is here.
ips	qps	rps	rmbps	wps	wmbps	rpq	rkbpq	wpi	wkbpi	csps	cpups	cspq	cpupq	dbgb1	dbgb2	rss	maxop	p50	p99	tag
1052632	0	0	0.0	1616.5	406.4	0.000	0.000	0.002	0.395	301339	57.5	0.286	16	43.0	117.9	NA	1.218	59034	7394	400m.pg147_def.cx7_gcp_c2s60
1072386	0	0	0.0	1621.8	407.2	0.000	0.000	0.002	0.389	331475	56.6	0.309	16	43.0	116.5	NA	1.364	59833	12990	400m.pg147_o3_native_lto.cx7_gcp_c2s60
l.x
l.x: create secondary indexes.
Average throughput:
Performance metrics for the DBMS listed above. Some are normalized by throughput, others are not. Legend for results is here.
ips	qps	rps	rmbps	wps	wmbps	rpq	rkbpq	wpi	wkbpi	csps	cpups	cspq	cpupq	dbgb1	dbgb2	rss	maxop	p50	p99	tag
332033	0	1788	18.2	394.1	93.5	0.005	0.056	0.001	0.288	925	3.2	0.003	3	78.3	153.2	0.0	0.002	NA	NA	400m.pg147_def.cx7_gcp_c2s60
331483	0	1607	17.2	399.6	95.1	0.005	0.053	0.001	0.294	1304	3.2	0.004	3	78.3	152.5	0.0	0.002	NA	NA	400m.pg147_o3_native_lto.cx7_gcp_c2s60
l.i1
l.i1: continue load after secondary indexes created. Graphs for performance per 1-second interval are here.
Average throughput:
Insert response time histogram: each cell has the percentage of responses that take <= the time in the header and max is the max response time in seconds. For the max column values in the top 25% of the range have a red background and in the bottom 25% of the range have a green background. The red background is not used when the min value is within 80% of the max value.
| dbms | 256us | 1ms | 4ms | 16ms | 64ms | 256ms | 1s | 4s | 16s | gt | max |
|---|---|---|---|---|---|---|---|---|---|---|---|
| pg147_def.cx7_gcp_c2s60 | 94.337 | 4.663 | 0.961 | 0.023 | 0.016 | 0.879 | |||||
| pg147_o3_native_lto.cx7_gcp_c2s60 | 94.401 | 4.571 | 0.993 | 0.022 | 0.012 | 0.001 | 1.155 |
Performance metrics for the DBMS listed above. Some are normalized by throughput, others are not. Legend for results is here.
ips	qps	rps	rmbps	wps	wmbps	rpq	rkbpq	wpi	wkbpi	csps	cpups	cspq	cpupq	dbgb1	dbgb2	rss	maxop	p50	p99	tag
384986	0	3034	26.9	2324.5	414.0	0.008	0.072	0.006	1.101	277761	53.5	0.721	42	170.2	328.4	0.0	0.879	23384	1798	400m.pg147_def.cx7_gcp_c2s60
392157	0	2982	27.3	2367.0	421.9	0.008	0.071	0.006	1.102	298429	52.7	0.761	40	170.2	330.7	0.0	1.155	24074	1648	400m.pg147_o3_native_lto.cx7_gcp_c2s60
q100.1
q100.1: range queries with 100 insert/s per client. Graphs for performance per 1-second interval are here.
Average throughput:
Query response time histogram: each cell has the percentage of responses that take <= the time in the header and max is the max response time in seconds. For max values in the top 25% of the range have a red background and in the bottom 25% of the range have a green background. The red background is not used when the min value is within 80% of the max value.
| dbms | 256us | 1ms | 4ms | 16ms | 64ms | 256ms | 1s | 4s | 16s | gt | max |
|---|---|---|---|---|---|---|---|---|---|---|---|
| pg147_def.cx7_gcp_c2s60 | 99.970 | 0.023 | 0.006 | 0.001 | nonzero | 0.026 | |||||
| pg147_o3_native_lto.cx7_gcp_c2s60 | 99.975 | 0.018 | 0.006 | 0.001 | nonzero | 0.028 |
Insert response time histogram: each cell has the percentage of responses that take <= the time in the header and max is the max response time in seconds. For max values in the top 25% of the range have a red background and in the bottom 25% of the range have a green background. The red background is not used when the min value is within 80% of the max value.
| dbms | 256us | 1ms | 4ms | 16ms | 64ms | 256ms | 1s | 4s | 16s | gt | max |
|---|---|---|---|---|---|---|---|---|---|---|---|
| pg147_def.cx7_gcp_c2s60 | 98.875 | 0.883 | 0.242 | 0.052 | |||||||
| pg147_o3_native_lto.cx7_gcp_c2s60 | 99.018 | 0.808 | 0.174 | 0.036 |
Performance metrics for the DBMS listed above. Some are normalized by throughput, others are not. Legend for results is here.
ips	qps	rps	rmbps	wps	wmbps	rpq	rkbpq	wpi	wkbpi	csps	cpups	cspq	cpupq	dbgb1	dbgb2	rss	maxop	p50	p99	tag
1976	188429	0	0.0	2493.3	67.8	0.000	0.000	1.262	35.156	673570	62.7	3.575	100	171.1	304.7	0.0	0.026	9350	9046	400m.pg147_def.cx7_gcp_c2s60
1976	196892	0	0.0	2532.4	68.8	0.000	0.000	1.282	35.633	702693	62.7	3.569	96	171.1	315.6	0.0	0.028	9817	9477	400m.pg147_o3_native_lto.cx7_gcp_c2s60
q500.1
q500.1: range queries with 500 insert/s per client. Graphs for performance per 1-second interval are here.
Average throughput:
Query response time histogram: each cell has the percentage of responses that take <= the time in the header and max is the max response time in seconds. For max values in the top 25% of the range have a red background and in the bottom 25% of the range have a green background. The red background is not used when the min value is within 80% of the max value.
| dbms | 256us | 1ms | 4ms | 16ms | 64ms | 256ms | 1s | 4s | 16s | gt | max |
|---|---|---|---|---|---|---|---|---|---|---|---|
| pg147_def.cx7_gcp_c2s60 | 99.908 | 0.061 | 0.027 | 0.003 | nonzero | 0.034 | |||||
| pg147_o3_native_lto.cx7_gcp_c2s60 | 99.917 | 0.053 | 0.026 | 0.003 | nonzero | 0.033 |
Insert response time histogram: each cell has the percentage of responses that take <= the time in the header and max is the max response time in seconds. For max values in the top 25% of the range have a red background and in the bottom 25% of the range have a green background. The red background is not used when the min value is within 80% of the max value.
| dbms | 256us | 1ms | 4ms | 16ms | 64ms | 256ms | 1s | 4s | 16s | gt | max |
|---|---|---|---|---|---|---|---|---|---|---|---|
| pg147_def.cx7_gcp_c2s60 | 52.104 | 27.768 | 19.844 | 0.284 | 0.176 | ||||||
| pg147_o3_native_lto.cx7_gcp_c2s60 | 52.797 | 27.533 | 19.385 | 0.284 | 0.174 |
Performance metrics for the DBMS listed above. Some are normalized by throughput, others are not. Legend for results is here.
ips	qps	rps	rmbps	wps	wmbps	rpq	rkbpq	wpi	wkbpi	csps	cpups	cspq	cpupq	dbgb1	dbgb2	rss	maxop	p50	p99	tag
9890	189869	0	0.0	4623.3	145.2	0.000	0.000	0.467	15.030	665466	64.0	3.505	101	176.0	260.8	0.0	0.034	9350	8982	400m.pg147_def.cx7_gcp_c2s60
9885	198364	0	0.0	4593.5	143.8	0.000	0.000	0.465	14.902	694761	63.5	3.502	96	176.0	262.0	0.0	0.033	9909	9465	400m.pg147_o3_native_lto.cx7_gcp_c2s60
q1000.1
q1000.1: range queries with 1000 insert/s per client. Graphs for performance per 1-second interval are here.
Average throughput:
Query response time histogram: each cell has the percentage of responses that take <= the time in the header and max is the max response time in seconds. For max values in the top 25% of the range have a red background and in the bottom 25% of the range have a green background. The red background is not used when the min value is within 80% of the max value.
| dbms | 256us | 1ms | 4ms | 16ms | 64ms | 256ms | 1s | 4s | 16s | gt | max |
|---|---|---|---|---|---|---|---|---|---|---|---|
| pg147_def.cx7_gcp_c2s60 | 99.856 | 0.101 | 0.038 | 0.004 | nonzero | 0.043 | |||||
| pg147_o3_native_lto.cx7_gcp_c2s60 | 99.867 | 0.093 | 0.037 | 0.004 | nonzero | 0.030 |
Insert response time histogram: each cell has the percentage of responses that take <= the time in the header and max is the max response time in seconds. For max values in the top 25% of the range have a red background and in the bottom 25% of the range have a green background. The red background is not used when the min value is within 80% of the max value.
| dbms | 256us | 1ms | 4ms | 16ms | 64ms | 256ms | 1s | 4s | 16s | gt | max |
|---|---|---|---|---|---|---|---|---|---|---|---|
| pg147_def.cx7_gcp_c2s60 | 60.035 | 27.081 | 12.603 | 0.282 | 0.246 | ||||||
| pg147_o3_native_lto.cx7_gcp_c2s60 | 61.090 | 26.286 | 12.363 | 0.261 | 0.179 |
Performance metrics for the DBMS listed above. Some are normalized by throughput, others are not. Legend for results is here.
ips	qps	rps	rmbps	wps	wmbps	rpq	rkbpq	wpi	wkbpi	csps	cpups	cspq	cpupq	dbgb1	dbgb2	rss	maxop	p50	p99	tag
19769	195090	0	0.0	4743.5	205.1	0.000	0.000	0.240	10.623	658764	65.2	3.377	100	189.4	269.0	0.0	0.043	9685	9030	400m.pg147_def.cx7_gcp_c2s60
19769	203390	0	0.0	4751.6	203.2	0.000	0.000	0.240	10.528	686455	65.0	3.375	96	189.4	269.8	0.0	0.030	10101	9430	400m.pg147_o3_native_lto.cx7_gcp_c2s60
l.i0
l.i0: load without secondary indexes
Performance metrics for all DBMS, not just the ones listed above. Some are normalized by throughput, others are not. Legend for results is here.
ips	qps	rps	rmbps	wps	wmbps	rpq	rkbpq	wpi	wkbpi	csps	cpups	cspq	cpupq	dbgb1	dbgb2	rss	maxop	p50	p99	tag
1052632	0	0	0.0	1616.5	406.4	0.000	0.000	0.002	0.395	301339	57.5	0.286	16	43.0	117.9	NA	1.218	59034	7394	400m.pg147_def.cx7_gcp_c2s60
1072386	0	0	0.0	1621.8	407.2	0.000	0.000	0.002	0.389	331475	56.6	0.309	16	43.0	116.5	NA	1.364	59833	12990	400m.pg147_o3_native_lto.cx7_gcp_c2s60
l.x
l.x: create secondary indexes
Performance metrics for all DBMS, not just the ones listed above. Some are normalized by throughput, others are not. Legend for results is here.
ips	qps	rps	rmbps	wps	wmbps	rpq	rkbpq	wpi	wkbpi	csps	cpups	cspq	cpupq	dbgb1	dbgb2	rss	maxop	p50	p99	tag
332033	0	1788	18.2	394.1	93.5	0.005	0.056	0.001	0.288	925	3.2	0.003	3	78.3	153.2	0.0	0.002	NA	NA	400m.pg147_def.cx7_gcp_c2s60
331483	0	1607	17.2	399.6	95.1	0.005	0.053	0.001	0.294	1304	3.2	0.004	3	78.3	152.5	0.0	0.002	NA	NA	400m.pg147_o3_native_lto.cx7_gcp_c2s60
l.i1
l.i1: continue load after secondary indexes created
Performance metrics for all DBMS, not just the ones listed above. Some are normalized by throughput, others are not. Legend for results is here.
ips	qps	rps	rmbps	wps	wmbps	rpq	rkbpq	wpi	wkbpi	csps	cpups	cspq	cpupq	dbgb1	dbgb2	rss	maxop	p50	p99	tag
384986	0	3034	26.9	2324.5	414.0	0.008	0.072	0.006	1.101	277761	53.5	0.721	42	170.2	328.4	0.0	0.879	23384	1798	400m.pg147_def.cx7_gcp_c2s60
392157	0	2982	27.3	2367.0	421.9	0.008	0.071	0.006	1.102	298429	52.7	0.761	40	170.2	330.7	0.0	1.155	24074	1648	400m.pg147_o3_native_lto.cx7_gcp_c2s60
q100.1
q100.1: range queries with 100 insert/s per client
Performance metrics for all DBMS, not just the ones listed above. Some are normalized by throughput, others are not. Legend for results is here.
ips	qps	rps	rmbps	wps	wmbps	rpq	rkbpq	wpi	wkbpi	csps	cpups	cspq	cpupq	dbgb1	dbgb2	rss	maxop	p50	p99	tag
1976	188429	0	0.0	2493.3	67.8	0.000	0.000	1.262	35.156	673570	62.7	3.575	100	171.1	304.7	0.0	0.026	9350	9046	400m.pg147_def.cx7_gcp_c2s60
1976	196892	0	0.0	2532.4	68.8	0.000	0.000	1.282	35.633	702693	62.7	3.569	96	171.1	315.6	0.0	0.028	9817	9477	400m.pg147_o3_native_lto.cx7_gcp_c2s60
q500.1
q500.1: range queries with 500 insert/s per client
Performance metrics for all DBMS, not just the ones listed above. Some are normalized by throughput, others are not. Legend for results is here.
ips	qps	rps	rmbps	wps	wmbps	rpq	rkbpq	wpi	wkbpi	csps	cpups	cspq	cpupq	dbgb1	dbgb2	rss	maxop	p50	p99	tag
9890	189869	0	0.0	4623.3	145.2	0.000	0.000	0.467	15.030	665466	64.0	3.505	101	176.0	260.8	0.0	0.034	9350	8982	400m.pg147_def.cx7_gcp_c2s60
9885	198364	0	0.0	4593.5	143.8	0.000	0.000	0.465	14.902	694761	63.5	3.502	96	176.0	262.0	0.0	0.033	9909	9465	400m.pg147_o3_native_lto.cx7_gcp_c2s60
q1000.1
q1000.1: range queries with 1000 insert/s per client
Performance metrics for all DBMS, not just the ones listed above. Some are normalized by throughput, others are not. Legend for results is here.
ips	qps	rps	rmbps	wps	wmbps	rpq	rkbpq	wpi	wkbpi	csps	cpups	cspq	cpupq	dbgb1	dbgb2	rss	maxop	p50	p99	tag
19769	195090	0	0.0	4743.5	205.1	0.000	0.000	0.240	10.623	658764	65.2	3.377	100	189.4	269.0	0.0	0.043	9685	9030	400m.pg147_def.cx7_gcp_c2s60
19769	203390	0	0.0	4751.6	203.2	0.000	0.000	0.240	10.528	686455	65.0	3.375	96	189.4	269.8	0.0	0.030	10101	9430	400m.pg147_o3_native_lto.cx7_gcp_c2s60
l.i0
- l.i0: load without secondary indexes
- Legend for results is here.
- Each entry lists the percentage of responses that fit in that bucket (slower than max time for previous bucket, faster than min time for next bucket).
Insert response time histogram
256us	1ms	4ms	16ms	64ms	256ms	1s	4s	16s	gt	max	tag
0.000	14.988	81.429	3.519	0.024	0.025	0.014	0.001	0.000	0.000	1.218	pg147_def.cx7_gcp_c2s60
0.000	22.426	74.038	3.478	0.019	0.025	0.013	0.001	0.000	0.000	1.364	pg147_o3_native_lto.cx7_gcp_c2s60
l.x
- l.x: create secondary indexes
- Legend for results is here.
- Each entry lists the percentage of responses that fit in that bucket (slower than max time for previous bucket, faster than min time for next bucket).
TODO - determine whether there is data for create index response time
l.i1
- l.i1: continue load after secondary indexes created
- Legend for results is here.
- Each entry lists the percentage of responses that fit in that bucket (slower than max time for previous bucket, faster than min time for next bucket).
Insert response time histogram
256us	1ms	4ms	16ms	64ms	256ms	1s	4s	16s	gt	max	tag
0.000	0.000	94.337	4.663	0.961	0.023	0.016	0.000	0.000	0.000	0.879	pg147_def.cx7_gcp_c2s60
0.000	0.000	94.401	4.571	0.993	0.022	0.012	0.001	0.000	0.000	1.155	pg147_o3_native_lto.cx7_gcp_c2s60
q100.1
- q100.1: range queries with 100 insert/s per client
- Legend for results is here.
- Each entry lists the percentage of responses that fit in that bucket (slower than max time for previous bucket, faster than min time for next bucket).
Query response time histogram
256us	1ms	4ms	16ms	64ms	256ms	1s	4s	16s	gt	max	tag
99.970	0.023	0.006	0.001	nonzero	0.000	0.000	0.000	0.000	0.000	0.026	pg147_def.cx7_gcp_c2s60
99.975	0.018	0.006	0.001	nonzero	0.000	0.000	0.000	0.000	0.000	0.028	pg147_o3_native_lto.cx7_gcp_c2s60
Insert response time histogram
256us	1ms	4ms	16ms	64ms	256ms	1s	4s	16s	gt	max	tag
0.000	0.000	98.875	0.883	0.242	0.000	0.000	0.000	0.000	0.000	0.052	pg147_def.cx7_gcp_c2s60
0.000	0.000	99.018	0.808	0.174	0.000	0.000	0.000	0.000	0.000	0.036	pg147_o3_native_lto.cx7_gcp_c2s60
q500.1
- q500.1: range queries with 500 insert/s per client
- Legend for results is here.
- Each entry lists the percentage of responses that fit in that bucket (slower than max time for previous bucket, faster than min time for next bucket).
Query response time histogram
256us	1ms	4ms	16ms	64ms	256ms	1s	4s	16s	gt	max	tag
99.908	0.061	0.027	0.003	nonzero	0.000	0.000	0.000	0.000	0.000	0.034	pg147_def.cx7_gcp_c2s60
99.917	0.053	0.026	0.003	nonzero	0.000	0.000	0.000	0.000	0.000	0.033	pg147_o3_native_lto.cx7_gcp_c2s60
Insert response time histogram
256us	1ms	4ms	16ms	64ms	256ms	1s	4s	16s	gt	max	tag
0.000	0.000	52.104	27.768	19.844	0.284	0.000	0.000	0.000	0.000	0.176	pg147_def.cx7_gcp_c2s60
0.000	0.000	52.797	27.533	19.385	0.284	0.000	0.000	0.000	0.000	0.174	pg147_o3_native_lto.cx7_gcp_c2s60
q1000.1
- q1000.1: range queries with 1000 insert/s per client
- Legend for results is here.
- Each entry lists the percentage of responses that fit in that bucket (slower than max time for previous bucket, faster than min time for next bucket).
Query response time histogram
256us	1ms	4ms	16ms	64ms	256ms	1s	4s	16s	gt	max	tag
99.856	0.101	0.038	0.004	nonzero	0.000	0.000	0.000	0.000	0.000	0.043	pg147_def.cx7_gcp_c2s60
99.867	0.093	0.037	0.004	nonzero	0.000	0.000	0.000	0.000	0.000	0.030	pg147_o3_native_lto.cx7_gcp_c2s60
Insert response time histogram
256us	1ms	4ms	16ms	64ms	256ms	1s	4s	16s	gt	max	tag
0.000	0.000	60.035	27.081	12.603	0.282	0.000	0.000	0.000	0.000	0.246	pg147_def.cx7_gcp_c2s60
0.000	0.000	61.090	26.286	12.363	0.261	0.000	0.000	0.000	0.000	0.179	pg147_o3_native_lto.cx7_gcp_c2s60