Introduction
This is a report for the insert benchmark with 400M docs and 20 client(s). It is generated by scripts (bash, awk, sed) and Tufte might not be impressed. An overview of the insert benchmark is here and a short update is here. Below, by DBMS, I mean DBMS+version.config. An example is my8020.c10b40 where my means MySQL, 8020 is version 8.0.20 and c10b40 is the name for the configuration file.
The test server is a c2-standard-60 from GCP with 30 cores, hyperthreading disabled, 240G RAM and 3T from XFS and SW RAID 0 striped over 8 local NVMe drives. The benchmark was run with 20 clients and there were 1 or 2 connections per client (1 for queries, 1 for inserts). The benchmark loads 400M rows without secondary indexes, creates secondary indexes, loads another 400M rows then does 3 read+write tests for one hour each that do queries as fast as possible with 100, 500 and then 1000 writes/second/client concurrent with the queries. Each read-write test runs for 1800 seconds. The test was configured to use a table per client. The database is cached by the storage engine and the only IO is for writes. Clients and the DBMS share one server. The per-database configs are in the per-database subdirectories here.
The tested DBMS are:
- pg1310_def.cx7_gcp_c2s60 - Postgres 13.10, the cx7_gcp_c2s60 config and a default build that used -O2
- pg1310_o3_native_lto.cx7_gcp_c2s60 - Postgres 13.10, the cx7_gcp_c2s60 config and a build that uses -O3 -march=native -mtune=native -flto (link-time optimization)
Contents
- Summary
- l.i0: load without secondary indexes
- l.x: create secondary indexes
- l.i1: continue load after secondary indexes created
- q100.1: range queries with 100 insert/s per client
- q500.1: range queries with 500 insert/s per client
- q1000.1: range queries with 1000 insert/s per client
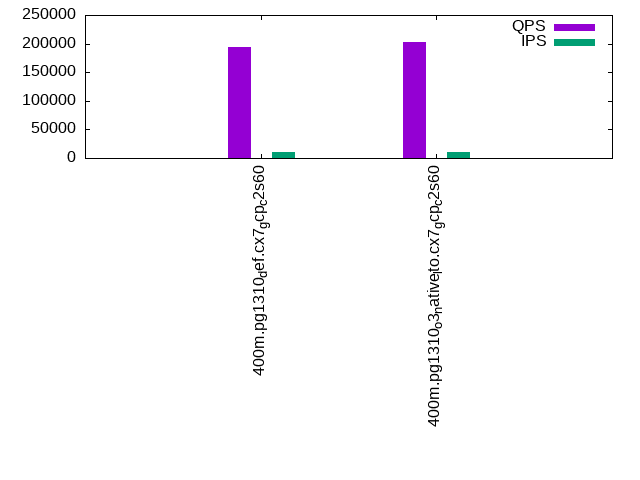
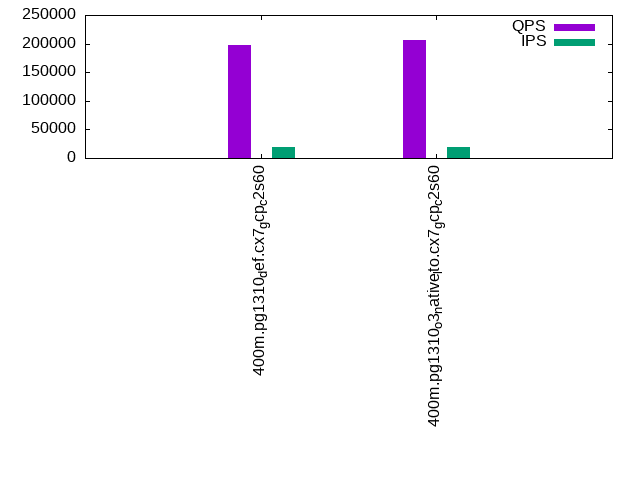
Summary
The numbers are inserts/s for l.i0 and l.i1, indexed docs (or rows) /s for l.x and queries/s for q*.2. The values are the average rate over the entire test for inserts (IPS) and queries (QPS). The range of values for IPS and QPS is split into 3 parts: bottom 25%, middle 50%, top 25%. Values in the bottom 25% have a red background, values in the top 25% have a green background and values in the middle have no color. A gray background is used for values that can be ignored because the DBMS did not sustain the target insert rate. Red backgrounds are not used when the minimum value is within 80% of the max value.
| dbms | l.i0 | l.x | l.i1 | q100.1 | q500.1 | q1000.1 |
|---|---|---|---|---|---|---|
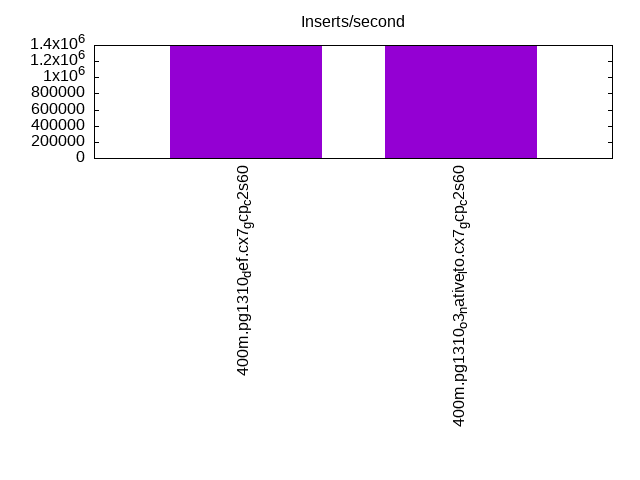
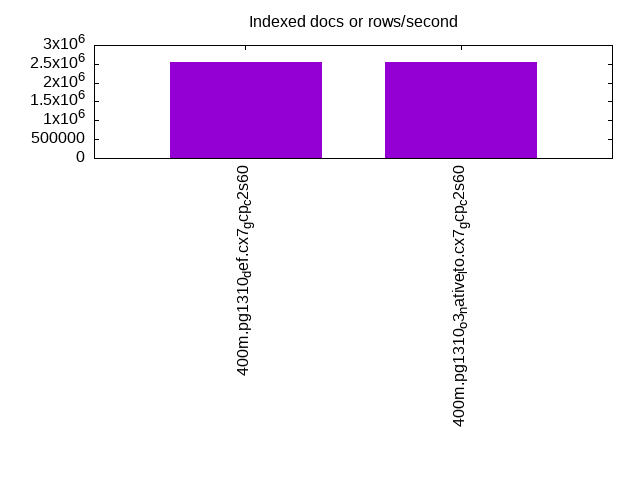
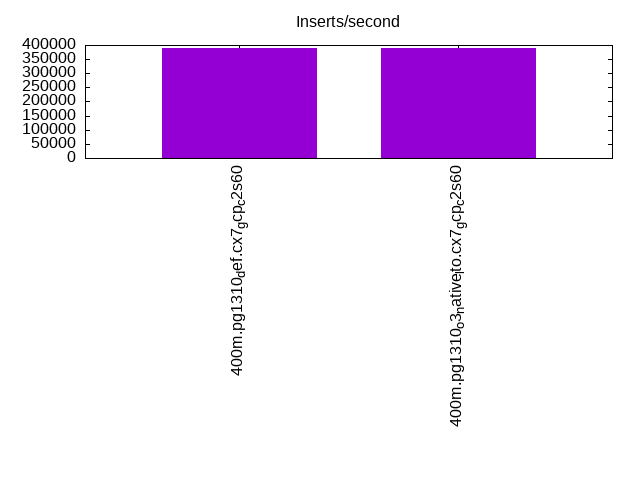
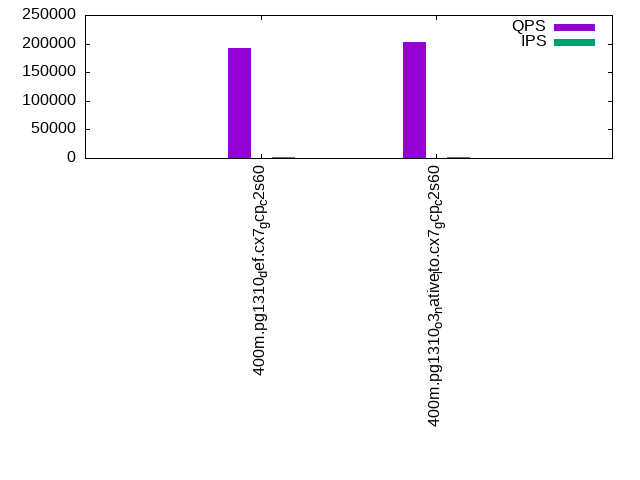
| 400m.pg1310_def.cx7_gcp_c2s60 | 1384083 | 2548408 | 390625 | 192369 | 193828 | 197050 |
| 400m.pg1310_o3_native_lto.cx7_gcp_c2s60 | 1398601 | 2548408 | 391007 | 202283 | 202002 | 206280 |
This lists the average rate of inserts/s for the tests that do inserts concurrent with queries. For such tests the query rate is listed in the table above. The read+write tests are setup so that the insert rate should match the target rate every second. Cells that are not at least 95% of the target have a red background to indicate a failure to satisfy the target.
| dbms | q100.1 | q500.1 | q1000.1 |
|---|---|---|---|
| pg1310_def.cx7_gcp_c2s60 | 1976 | 9885 | 19769 |
| pg1310_o3_native_lto.cx7_gcp_c2s60 | 1976 | 9885 | 19769 |
| target | 2000 | 10000 | 20000 |
l.i0
l.i0: load without secondary indexes. Graphs for performance per 1-second interval are here.
Average throughput:
Insert response time histogram: each cell has the percentage of responses that take <= the time in the header and max is the max response time in seconds. For the max column values in the top 25% of the range have a red background and in the bottom 25% of the range have a green background. The red background is not used when the min value is within 80% of the max value.
| dbms | 256us | 1ms | 4ms | 16ms | 64ms | 256ms | 1s | 4s | 16s | gt | max |
|---|---|---|---|---|---|---|---|---|---|---|---|
| pg1310_def.cx7_gcp_c2s60 | 60.424 | 38.599 | 0.927 | 0.020 | 0.019 | 0.012 | 0.948 | ||||
| pg1310_o3_native_lto.cx7_gcp_c2s60 | 58.623 | 40.556 | 0.776 | 0.012 | 0.019 | 0.013 | 0.780 |
Performance metrics for the DBMS listed above. Some are normalized by throughput, others are not. Legend for results is here.
ips	qps	rps	rmbps	wps	wmbps	rpq	rkbpq	wpi	wkbpi	csps	cpups	cspq	cpupq	dbgb1	dbgb2	rss	maxop	p50	p99	tag
1384083	0	0	0.0	1840.4	462.1	0.000	0.000	0.001	0.342	225249	60.8	0.163	13	38.3	103.4	NA	0.948	79146	9889	400m.pg1310_def.cx7_gcp_c2s60
1398601	0	0	0.0	1880.2	466.2	0.000	0.000	0.001	0.341	252982	59.4	0.181	13	38.3	103.4	NA	0.780	79589	7392	400m.pg1310_o3_native_lto.cx7_gcp_c2s60
l.x
l.x: create secondary indexes.
Average throughput:
Performance metrics for the DBMS listed above. Some are normalized by throughput, others are not. Legend for results is here.
ips	qps	rps	rmbps	wps	wmbps	rpq	rkbpq	wpi	wkbpi	csps	cpups	cspq	cpupq	dbgb1	dbgb2	rss	maxop	p50	p99	tag
2548408	0	6942	108.1	3495.9	849.1	0.003	0.043	0.001	0.341	99732	25.7	0.039	3	73.5	170.7	0.0	0.205	NA	NA	400m.pg1310_def.cx7_gcp_c2s60
2548408	0	9905	112.1	3471.0	851.8	0.004	0.045	0.001	0.342	103215	25.1	0.041	3	73.5	170.7	0.0	0.399	NA	NA	400m.pg1310_o3_native_lto.cx7_gcp_c2s60
l.i1
l.i1: continue load after secondary indexes created. Graphs for performance per 1-second interval are here.
Average throughput:
Insert response time histogram: each cell has the percentage of responses that take <= the time in the header and max is the max response time in seconds. For the max column values in the top 25% of the range have a red background and in the bottom 25% of the range have a green background. The red background is not used when the min value is within 80% of the max value.
| dbms | 256us | 1ms | 4ms | 16ms | 64ms | 256ms | 1s | 4s | 16s | gt | max |
|---|---|---|---|---|---|---|---|---|---|---|---|
| pg1310_def.cx7_gcp_c2s60 | 0.001 | 95.834 | 2.442 | 1.679 | 0.033 | 0.012 | 0.843 | ||||
| pg1310_o3_native_lto.cx7_gcp_c2s60 | 0.035 | 95.889 | 2.323 | 1.704 | 0.038 | 0.012 | 0.969 |
Performance metrics for the DBMS listed above. Some are normalized by throughput, others are not. Legend for results is here.
ips	qps	rps	rmbps	wps	wmbps	rpq	rkbpq	wpi	wkbpi	csps	cpups	cspq	cpupq	dbgb1	dbgb2	rss	maxop	p50	p99	tag
390625	0	5127	43.9	3567.7	491.7	0.013	0.115	0.009	1.289	288090	50.2	0.738	39	163.3	320.3	0.0	0.843	25223	1698	400m.pg1310_def.cx7_gcp_c2s60
391007	0	4916	43.3	3570.6	495.2	0.013	0.113	0.009	1.297	308027	49.3	0.788	38	163.3	319.3	NA	0.969	25322	1798	400m.pg1310_o3_native_lto.cx7_gcp_c2s60
q100.1
q100.1: range queries with 100 insert/s per client. Graphs for performance per 1-second interval are here.
Average throughput:
Query response time histogram: each cell has the percentage of responses that take <= the time in the header and max is the max response time in seconds. For max values in the top 25% of the range have a red background and in the bottom 25% of the range have a green background. The red background is not used when the min value is within 80% of the max value.
| dbms | 256us | 1ms | 4ms | 16ms | 64ms | 256ms | 1s | 4s | 16s | gt | max |
|---|---|---|---|---|---|---|---|---|---|---|---|
| pg1310_def.cx7_gcp_c2s60 | 99.970 | 0.023 | 0.006 | 0.001 | nonzero | 0.025 | |||||
| pg1310_o3_native_lto.cx7_gcp_c2s60 | 99.976 | 0.018 | 0.006 | 0.001 | nonzero | 0.024 |
Insert response time histogram: each cell has the percentage of responses that take <= the time in the header and max is the max response time in seconds. For max values in the top 25% of the range have a red background and in the bottom 25% of the range have a green background. The red background is not used when the min value is within 80% of the max value.
| dbms | 256us | 1ms | 4ms | 16ms | 64ms | 256ms | 1s | 4s | 16s | gt | max |
|---|---|---|---|---|---|---|---|---|---|---|---|
| pg1310_def.cx7_gcp_c2s60 | 91.564 | 6.311 | 2.115 | 0.001 | 0.008 | 0.299 | |||||
| pg1310_o3_native_lto.cx7_gcp_c2s60 | 92.054 | 5.771 | 2.160 | 0.015 | 0.123 |
Performance metrics for the DBMS listed above. Some are normalized by throughput, others are not. Legend for results is here.
ips	qps	rps	rmbps	wps	wmbps	rpq	rkbpq	wpi	wkbpi	csps	cpups	cspq	cpupq	dbgb1	dbgb2	rss	maxop	p50	p99	tag
1976	192369	0	0.0	3702.2	88.9	0.000	0.000	1.874	46.095	681354	63.1	3.542	98	163.9	266.8	0.0	0.025	9557	9142	400m.pg1310_def.cx7_gcp_c2s60
1976	202283	0	0.0	3707.8	88.8	0.000	0.000	1.877	46.009	716261	62.9	3.541	93	163.9	266.0	0.0	0.024	9962	9541	400m.pg1310_o3_native_lto.cx7_gcp_c2s60
q500.1
q500.1: range queries with 500 insert/s per client. Graphs for performance per 1-second interval are here.
Average throughput:
Query response time histogram: each cell has the percentage of responses that take <= the time in the header and max is the max response time in seconds. For max values in the top 25% of the range have a red background and in the bottom 25% of the range have a green background. The red background is not used when the min value is within 80% of the max value.
| dbms | 256us | 1ms | 4ms | 16ms | 64ms | 256ms | 1s | 4s | 16s | gt | max |
|---|---|---|---|---|---|---|---|---|---|---|---|
| pg1310_def.cx7_gcp_c2s60 | 99.909 | 0.059 | 0.029 | 0.003 | nonzero | nonzero | 0.083 | ||||
| pg1310_o3_native_lto.cx7_gcp_c2s60 | 99.915 | 0.054 | 0.028 | 0.003 | nonzero | 0.063 |
Insert response time histogram: each cell has the percentage of responses that take <= the time in the header and max is the max response time in seconds. For max values in the top 25% of the range have a red background and in the bottom 25% of the range have a green background. The red background is not used when the min value is within 80% of the max value.
| dbms | 256us | 1ms | 4ms | 16ms | 64ms | 256ms | 1s | 4s | 16s | gt | max |
|---|---|---|---|---|---|---|---|---|---|---|---|
| pg1310_def.cx7_gcp_c2s60 | 44.411 | 26.247 | 27.947 | 1.395 | nonzero | 0.260 | |||||
| pg1310_o3_native_lto.cx7_gcp_c2s60 | 44.383 | 25.768 | 28.405 | 1.444 | 0.236 |
Performance metrics for the DBMS listed above. Some are normalized by throughput, others are not. Legend for results is here.
ips	qps	rps	rmbps	wps	wmbps	rpq	rkbpq	wpi	wkbpi	csps	cpups	cspq	cpupq	dbgb1	dbgb2	rss	maxop	p50	p99	tag
9885	193828	0	0.0	6176.7	204.9	0.000	0.000	0.625	21.230	675126	64.2	3.483	99	167.5	245.1	0.0	0.083	9621	9146	400m.pg1310_def.cx7_gcp_c2s60
9885	202002	0	0.0	6179.4	204.8	0.000	0.000	0.625	21.217	703278	63.9	3.482	95	167.5	244.9	0.0	0.063	10053	9510	400m.pg1310_o3_native_lto.cx7_gcp_c2s60
q1000.1
q1000.1: range queries with 1000 insert/s per client. Graphs for performance per 1-second interval are here.
Average throughput:
Query response time histogram: each cell has the percentage of responses that take <= the time in the header and max is the max response time in seconds. For max values in the top 25% of the range have a red background and in the bottom 25% of the range have a green background. The red background is not used when the min value is within 80% of the max value.
| dbms | 256us | 1ms | 4ms | 16ms | 64ms | 256ms | 1s | 4s | 16s | gt | max |
|---|---|---|---|---|---|---|---|---|---|---|---|
| pg1310_def.cx7_gcp_c2s60 | 99.847 | 0.102 | 0.044 | 0.008 | 0.001 | nonzero | 0.085 | ||||
| pg1310_o3_native_lto.cx7_gcp_c2s60 | 99.855 | 0.095 | 0.042 | 0.007 | 0.001 | nonzero | 0.093 |
Insert response time histogram: each cell has the percentage of responses that take <= the time in the header and max is the max response time in seconds. For max values in the top 25% of the range have a red background and in the bottom 25% of the range have a green background. The red background is not used when the min value is within 80% of the max value.
| dbms | 256us | 1ms | 4ms | 16ms | 64ms | 256ms | 1s | 4s | 16s | gt | max |
|---|---|---|---|---|---|---|---|---|---|---|---|
| pg1310_def.cx7_gcp_c2s60 | 56.106 | 21.458 | 20.849 | 1.587 | nonzero | 0.258 | |||||
| pg1310_o3_native_lto.cx7_gcp_c2s60 | 56.539 | 21.159 | 20.734 | 1.567 | 0.001 | 0.278 |
Performance metrics for the DBMS listed above. Some are normalized by throughput, others are not. Legend for results is here.
ips	qps	rps	rmbps	wps	wmbps	rpq	rkbpq	wpi	wkbpi	csps	cpups	cspq	cpupq	dbgb1	dbgb2	rss	maxop	p50	p99	tag
19769	197050	0	0.0	5630.4	304.9	0.000	0.000	0.285	15.795	665704	65.4	3.378	100	179.6	259.6	0.0	0.085	9738	8950	400m.pg1310_def.cx7_gcp_c2s60
19769	206280	0	0.0	5634.1	306.4	0.000	0.000	0.285	15.872	697095	65.1	3.379	95	179.6	259.6	0.0	0.093	10249	9302	400m.pg1310_o3_native_lto.cx7_gcp_c2s60
l.i0
l.i0: load without secondary indexes
Performance metrics for all DBMS, not just the ones listed above. Some are normalized by throughput, others are not. Legend for results is here.
ips	qps	rps	rmbps	wps	wmbps	rpq	rkbpq	wpi	wkbpi	csps	cpups	cspq	cpupq	dbgb1	dbgb2	rss	maxop	p50	p99	tag
1384083	0	0	0.0	1840.4	462.1	0.000	0.000	0.001	0.342	225249	60.8	0.163	13	38.3	103.4	NA	0.948	79146	9889	400m.pg1310_def.cx7_gcp_c2s60
1398601	0	0	0.0	1880.2	466.2	0.000	0.000	0.001	0.341	252982	59.4	0.181	13	38.3	103.4	NA	0.780	79589	7392	400m.pg1310_o3_native_lto.cx7_gcp_c2s60
l.x
l.x: create secondary indexes
Performance metrics for all DBMS, not just the ones listed above. Some are normalized by throughput, others are not. Legend for results is here.
ips	qps	rps	rmbps	wps	wmbps	rpq	rkbpq	wpi	wkbpi	csps	cpups	cspq	cpupq	dbgb1	dbgb2	rss	maxop	p50	p99	tag
2548408	0	6942	108.1	3495.9	849.1	0.003	0.043	0.001	0.341	99732	25.7	0.039	3	73.5	170.7	0.0	0.205	NA	NA	400m.pg1310_def.cx7_gcp_c2s60
2548408	0	9905	112.1	3471.0	851.8	0.004	0.045	0.001	0.342	103215	25.1	0.041	3	73.5	170.7	0.0	0.399	NA	NA	400m.pg1310_o3_native_lto.cx7_gcp_c2s60
l.i1
l.i1: continue load after secondary indexes created
Performance metrics for all DBMS, not just the ones listed above. Some are normalized by throughput, others are not. Legend for results is here.
ips	qps	rps	rmbps	wps	wmbps	rpq	rkbpq	wpi	wkbpi	csps	cpups	cspq	cpupq	dbgb1	dbgb2	rss	maxop	p50	p99	tag
390625	0	5127	43.9	3567.7	491.7	0.013	0.115	0.009	1.289	288090	50.2	0.738	39	163.3	320.3	0.0	0.843	25223	1698	400m.pg1310_def.cx7_gcp_c2s60
391007	0	4916	43.3	3570.6	495.2	0.013	0.113	0.009	1.297	308027	49.3	0.788	38	163.3	319.3	NA	0.969	25322	1798	400m.pg1310_o3_native_lto.cx7_gcp_c2s60
q100.1
q100.1: range queries with 100 insert/s per client
Performance metrics for all DBMS, not just the ones listed above. Some are normalized by throughput, others are not. Legend for results is here.
ips	qps	rps	rmbps	wps	wmbps	rpq	rkbpq	wpi	wkbpi	csps	cpups	cspq	cpupq	dbgb1	dbgb2	rss	maxop	p50	p99	tag
1976	192369	0	0.0	3702.2	88.9	0.000	0.000	1.874	46.095	681354	63.1	3.542	98	163.9	266.8	0.0	0.025	9557	9142	400m.pg1310_def.cx7_gcp_c2s60
1976	202283	0	0.0	3707.8	88.8	0.000	0.000	1.877	46.009	716261	62.9	3.541	93	163.9	266.0	0.0	0.024	9962	9541	400m.pg1310_o3_native_lto.cx7_gcp_c2s60
q500.1
q500.1: range queries with 500 insert/s per client
Performance metrics for all DBMS, not just the ones listed above. Some are normalized by throughput, others are not. Legend for results is here.
ips	qps	rps	rmbps	wps	wmbps	rpq	rkbpq	wpi	wkbpi	csps	cpups	cspq	cpupq	dbgb1	dbgb2	rss	maxop	p50	p99	tag
9885	193828	0	0.0	6176.7	204.9	0.000	0.000	0.625	21.230	675126	64.2	3.483	99	167.5	245.1	0.0	0.083	9621	9146	400m.pg1310_def.cx7_gcp_c2s60
9885	202002	0	0.0	6179.4	204.8	0.000	0.000	0.625	21.217	703278	63.9	3.482	95	167.5	244.9	0.0	0.063	10053	9510	400m.pg1310_o3_native_lto.cx7_gcp_c2s60
q1000.1
q1000.1: range queries with 1000 insert/s per client
Performance metrics for all DBMS, not just the ones listed above. Some are normalized by throughput, others are not. Legend for results is here.
ips	qps	rps	rmbps	wps	wmbps	rpq	rkbpq	wpi	wkbpi	csps	cpups	cspq	cpupq	dbgb1	dbgb2	rss	maxop	p50	p99	tag
19769	197050	0	0.0	5630.4	304.9	0.000	0.000	0.285	15.795	665704	65.4	3.378	100	179.6	259.6	0.0	0.085	9738	8950	400m.pg1310_def.cx7_gcp_c2s60
19769	206280	0	0.0	5634.1	306.4	0.000	0.000	0.285	15.872	697095	65.1	3.379	95	179.6	259.6	0.0	0.093	10249	9302	400m.pg1310_o3_native_lto.cx7_gcp_c2s60
l.i0
- l.i0: load without secondary indexes
- Legend for results is here.
- Each entry lists the percentage of responses that fit in that bucket (slower than max time for previous bucket, faster than min time for next bucket).
Insert response time histogram
256us	1ms	4ms	16ms	64ms	256ms	1s	4s	16s	gt	max	tag
0.000	60.424	38.599	0.927	0.020	0.019	0.012	0.000	0.000	0.000	0.948	pg1310_def.cx7_gcp_c2s60
0.000	58.623	40.556	0.776	0.012	0.019	0.013	0.000	0.000	0.000	0.780	pg1310_o3_native_lto.cx7_gcp_c2s60
l.x
- l.x: create secondary indexes
- Legend for results is here.
- Each entry lists the percentage of responses that fit in that bucket (slower than max time for previous bucket, faster than min time for next bucket).
TODO - determine whether there is data for create index response time
l.i1
- l.i1: continue load after secondary indexes created
- Legend for results is here.
- Each entry lists the percentage of responses that fit in that bucket (slower than max time for previous bucket, faster than min time for next bucket).
Insert response time histogram
256us	1ms	4ms	16ms	64ms	256ms	1s	4s	16s	gt	max	tag
0.000	0.001	95.834	2.442	1.679	0.033	0.012	0.000	0.000	0.000	0.843	pg1310_def.cx7_gcp_c2s60
0.000	0.035	95.889	2.323	1.704	0.038	0.012	0.000	0.000	0.000	0.969	pg1310_o3_native_lto.cx7_gcp_c2s60
q100.1
- q100.1: range queries with 100 insert/s per client
- Legend for results is here.
- Each entry lists the percentage of responses that fit in that bucket (slower than max time for previous bucket, faster than min time for next bucket).
Query response time histogram
256us	1ms	4ms	16ms	64ms	256ms	1s	4s	16s	gt	max	tag
99.970	0.023	0.006	0.001	nonzero	0.000	0.000	0.000	0.000	0.000	0.025	pg1310_def.cx7_gcp_c2s60
99.976	0.018	0.006	0.001	nonzero	0.000	0.000	0.000	0.000	0.000	0.024	pg1310_o3_native_lto.cx7_gcp_c2s60
Insert response time histogram
256us	1ms	4ms	16ms	64ms	256ms	1s	4s	16s	gt	max	tag
0.000	0.000	91.564	6.311	2.115	0.001	0.008	0.000	0.000	0.000	0.299	pg1310_def.cx7_gcp_c2s60
0.000	0.000	92.054	5.771	2.160	0.015	0.000	0.000	0.000	0.000	0.123	pg1310_o3_native_lto.cx7_gcp_c2s60
q500.1
- q500.1: range queries with 500 insert/s per client
- Legend for results is here.
- Each entry lists the percentage of responses that fit in that bucket (slower than max time for previous bucket, faster than min time for next bucket).
Query response time histogram
256us	1ms	4ms	16ms	64ms	256ms	1s	4s	16s	gt	max	tag
99.909	0.059	0.029	0.003	nonzero	nonzero	0.000	0.000	0.000	0.000	0.083	pg1310_def.cx7_gcp_c2s60
99.915	0.054	0.028	0.003	nonzero	0.000	0.000	0.000	0.000	0.000	0.063	pg1310_o3_native_lto.cx7_gcp_c2s60
Insert response time histogram
256us	1ms	4ms	16ms	64ms	256ms	1s	4s	16s	gt	max	tag
0.000	0.000	44.411	26.247	27.947	1.395	nonzero	0.000	0.000	0.000	0.260	pg1310_def.cx7_gcp_c2s60
0.000	0.000	44.383	25.768	28.405	1.444	0.000	0.000	0.000	0.000	0.236	pg1310_o3_native_lto.cx7_gcp_c2s60
q1000.1
- q1000.1: range queries with 1000 insert/s per client
- Legend for results is here.
- Each entry lists the percentage of responses that fit in that bucket (slower than max time for previous bucket, faster than min time for next bucket).
Query response time histogram
256us	1ms	4ms	16ms	64ms	256ms	1s	4s	16s	gt	max	tag
99.847	0.102	0.044	0.008	0.001	nonzero	0.000	0.000	0.000	0.000	0.085	pg1310_def.cx7_gcp_c2s60
99.855	0.095	0.042	0.007	0.001	nonzero	0.000	0.000	0.000	0.000	0.093	pg1310_o3_native_lto.cx7_gcp_c2s60
Insert response time histogram
256us	1ms	4ms	16ms	64ms	256ms	1s	4s	16s	gt	max	tag
0.000	0.000	56.106	21.458	20.849	1.587	nonzero	0.000	0.000	0.000	0.258	pg1310_def.cx7_gcp_c2s60
0.000	0.000	56.539	21.159	20.734	1.567	0.001	0.000	0.000	0.000	0.278	pg1310_o3_native_lto.cx7_gcp_c2s60