Introduction
This is a report for the insert benchmark with 400M docs and 20 client(s). It is generated by scripts (bash, awk, sed) and Tufte might not be impressed. An overview of the insert benchmark is here and a short update is here. Below, by DBMS, I mean DBMS+version.config. An example is my8020.c10b40 where my means MySQL, 8020 is version 8.0.20 and c10b40 is the name for the configuration file.
The test server is a c2-standard-60 from GCP with 30 cores, hyperthreading disabled, 240G RAM and 3T from XFS and SW RAID 0 striped over 8 local NVMe drives. The benchmark was run with 20 clients and there were 1 or 2 connections per client (1 for queries, 1 for inserts). The benchmark loads 400M rows without secondary indexes, creates secondary indexes, loads another 400M rows then does 3 read+write tests for one hour each that do queries as fast as possible with 100, 500 and then 1000 writes/second/client concurrent with the queries. Each read-write test runs for 1800 seconds. The test was configured to use one table. The database is cached by the storage engine and the only IO is for writes. Clients and the DBMS share one server. The per-database configs are in the per-database subdirectories here.
The tested DBMS are:
- pg1214_def.cx7_gcp_c2s60 - Postgres 12.14, the cx7_gcp_c2s60 config and a default build that used -O2
- pg1214_o3_native_lto.cx7_gcp_c2s60 - Postgres 12.14, the cx7_gcp_c2s60 config and a build that uses -O3 -march=native -mtune=native -flto (link-time optimization)
Contents
- Summary
- l.i0: load without secondary indexes
- l.x: create secondary indexes
- l.i1: continue load after secondary indexes created
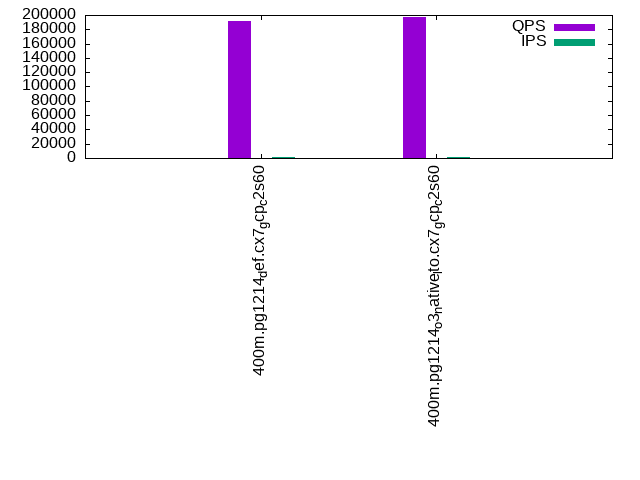
- q100.1: range queries with 100 insert/s per client
- q500.1: range queries with 500 insert/s per client
- q1000.1: range queries with 1000 insert/s per client
Summary
The numbers are inserts/s for l.i0 and l.i1, indexed docs (or rows) /s for l.x and queries/s for q*.2. The values are the average rate over the entire test for inserts (IPS) and queries (QPS). The range of values for IPS and QPS is split into 3 parts: bottom 25%, middle 50%, top 25%. Values in the bottom 25% have a red background, values in the top 25% have a green background and values in the middle have no color. A gray background is used for values that can be ignored because the DBMS did not sustain the target insert rate. Red backgrounds are not used when the minimum value is within 80% of the max value.
| dbms | l.i0 | l.x | l.i1 | q100.1 | q500.1 | q1000.1 |
|---|---|---|---|---|---|---|
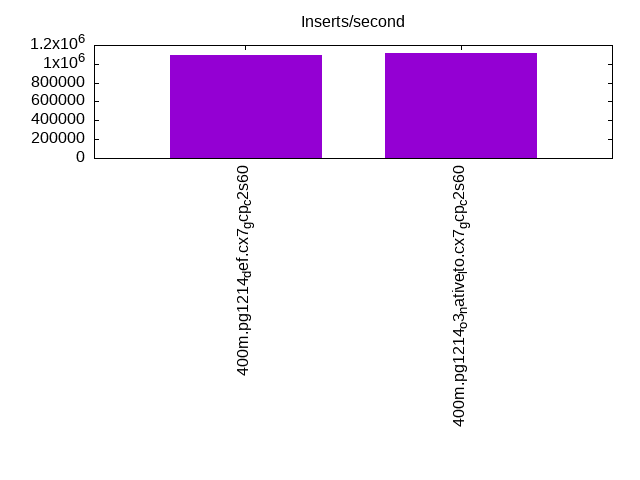
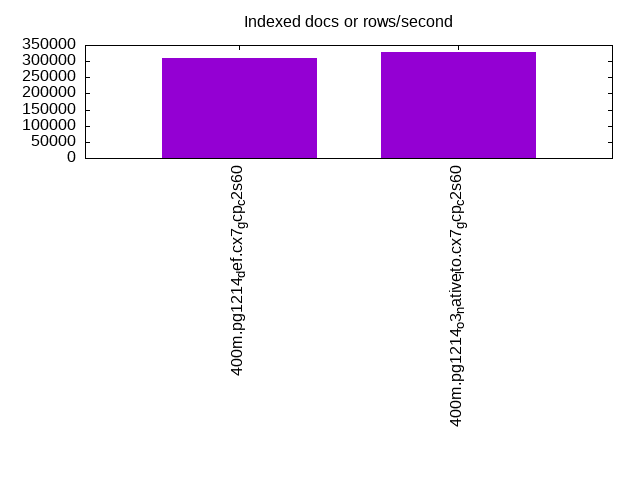
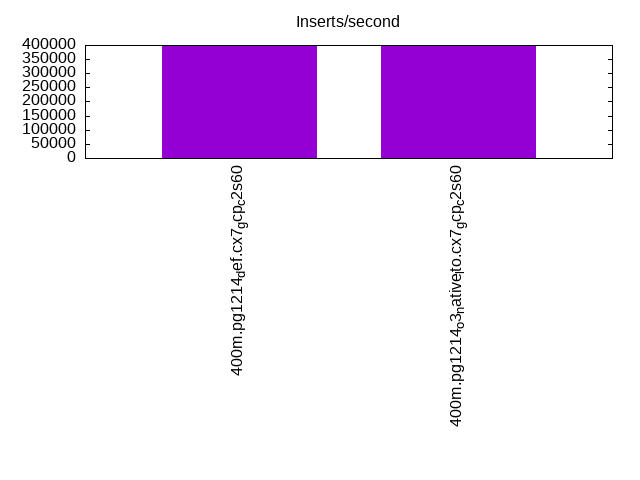
| 400m.pg1214_def.cx7_gcp_c2s60 | 1092896 | 310155 | 396040 | 190935 | 192570 | 198761 |
| 400m.pg1214_o3_native_lto.cx7_gcp_c2s60 | 1111111 | 327951 | 398010 | 197494 | 200007 | 205299 |
This lists the average rate of inserts/s for the tests that do inserts concurrent with queries. For such tests the query rate is listed in the table above. The read+write tests are setup so that the insert rate should match the target rate every second. Cells that are not at least 95% of the target have a red background to indicate a failure to satisfy the target.
| dbms | q100.1 | q500.1 | q1000.1 |
|---|---|---|---|
| pg1214_def.cx7_gcp_c2s60 | 1976 | 9885 | 19769 |
| pg1214_o3_native_lto.cx7_gcp_c2s60 | 1977 | 9885 | 19769 |
| target | 2000 | 10000 | 20000 |
l.i0
l.i0: load without secondary indexes. Graphs for performance per 1-second interval are here.
Average throughput:
Insert response time histogram: each cell has the percentage of responses that take <= the time in the header and max is the max response time in seconds. For the max column values in the top 25% of the range have a red background and in the bottom 25% of the range have a green background. The red background is not used when the min value is within 80% of the max value.
| dbms | 256us | 1ms | 4ms | 16ms | 64ms | 256ms | 1s | 4s | 16s | gt | max |
|---|---|---|---|---|---|---|---|---|---|---|---|
| pg1214_def.cx7_gcp_c2s60 | 18.689 | 78.103 | 3.158 | 0.012 | 0.021 | 0.016 | 0.752 | ||||
| pg1214_o3_native_lto.cx7_gcp_c2s60 | 25.467 | 71.174 | 3.311 | 0.009 | 0.025 | 0.015 | 0.729 |
Performance metrics for the DBMS listed above. Some are normalized by throughput, others are not. Legend for results is here.
ips	qps	rps	rmbps	wps	wmbps	rpq	rkbpq	wpi	wkbpi	csps	cpups	cspq	cpupq	dbgb1	dbgb2	rss	maxop	p50	p99	tag
1092896	0	0	0.0	1703.6	413.1	0.000	0.000	0.002	0.387	288881	58.5	0.264	16	43.0	112.2	0.0	0.752	60665	6293	400m.pg1214_def.cx7_gcp_c2s60
1111111	0	0	0.0	1785.1	427.3	0.000	0.000	0.002	0.394	308509	57.4	0.278	15	43.0	112.3	0.0	0.729	61833	12986	400m.pg1214_o3_native_lto.cx7_gcp_c2s60
l.x
l.x: create secondary indexes.
Average throughput:
Performance metrics for the DBMS listed above. Some are normalized by throughput, others are not. Legend for results is here.
ips	qps	rps	rmbps	wps	wmbps	rpq	rkbpq	wpi	wkbpi	csps	cpups	cspq	cpupq	dbgb1	dbgb2	rss	maxop	p50	p99	tag
310155	0	1478	18.2	609.9	124.6	0.005	0.060	0.002	0.411	1430	3.3	0.005	3	78.3	148.3	0.0	0.002	NA	NA	400m.pg1214_def.cx7_gcp_c2s60
327951	0	1654	19.8	650.3	129.4	0.005	0.062	0.002	0.404	1882	3.3	0.006	3	78.3	153.5	0.0	0.002	NA	NA	400m.pg1214_o3_native_lto.cx7_gcp_c2s60
l.i1
l.i1: continue load after secondary indexes created. Graphs for performance per 1-second interval are here.
Average throughput:
Insert response time histogram: each cell has the percentage of responses that take <= the time in the header and max is the max response time in seconds. For the max column values in the top 25% of the range have a red background and in the bottom 25% of the range have a green background. The red background is not used when the min value is within 80% of the max value.
| dbms | 256us | 1ms | 4ms | 16ms | 64ms | 256ms | 1s | 4s | 16s | gt | max |
|---|---|---|---|---|---|---|---|---|---|---|---|
| pg1214_def.cx7_gcp_c2s60 | 94.579 | 4.326 | 1.057 | 0.024 | 0.013 | 0.879 | |||||
| pg1214_o3_native_lto.cx7_gcp_c2s60 | 94.561 | 4.407 | 0.992 | 0.026 | 0.013 | 0.865 |
Performance metrics for the DBMS listed above. Some are normalized by throughput, others are not. Legend for results is here.
ips	qps	rps	rmbps	wps	wmbps	rpq	rkbpq	wpi	wkbpi	csps	cpups	cspq	cpupq	dbgb1	dbgb2	rss	maxop	p50	p99	tag
396040	0	3063	27.9	2357.4	389.8	0.008	0.072	0.006	1.008	259388	54.0	0.655	41	170.2	296.8	0.0	0.879	24373	1948	400m.pg1214_def.cx7_gcp_c2s60
398010	0	2999	27.8	2466.9	390.4	0.008	0.072	0.006	1.004	277376	53.3	0.697	40	170.2	305.6	0.0	0.865	24473	1848	400m.pg1214_o3_native_lto.cx7_gcp_c2s60
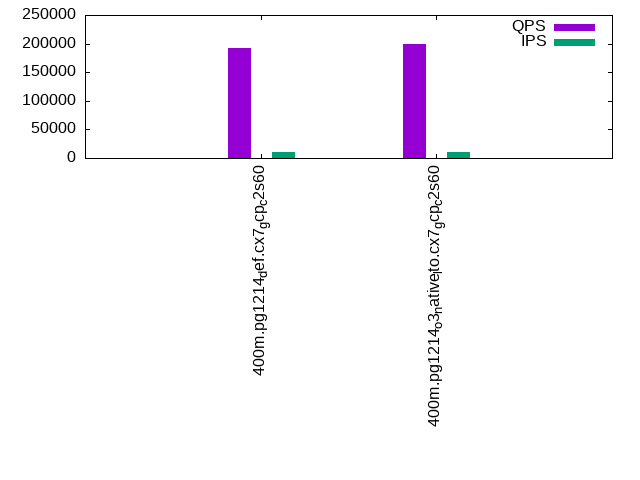
q100.1
q100.1: range queries with 100 insert/s per client. Graphs for performance per 1-second interval are here.
Average throughput:
Query response time histogram: each cell has the percentage of responses that take <= the time in the header and max is the max response time in seconds. For max values in the top 25% of the range have a red background and in the bottom 25% of the range have a green background. The red background is not used when the min value is within 80% of the max value.
| dbms | 256us | 1ms | 4ms | 16ms | 64ms | 256ms | 1s | 4s | 16s | gt | max |
|---|---|---|---|---|---|---|---|---|---|---|---|
| pg1214_def.cx7_gcp_c2s60 | 99.973 | 0.020 | 0.006 | 0.001 | nonzero | 0.026 | |||||
| pg1214_o3_native_lto.cx7_gcp_c2s60 | 99.975 | 0.018 | 0.006 | 0.001 | nonzero | 0.023 |
Insert response time histogram: each cell has the percentage of responses that take <= the time in the header and max is the max response time in seconds. For max values in the top 25% of the range have a red background and in the bottom 25% of the range have a green background. The red background is not used when the min value is within 80% of the max value.
| dbms | 256us | 1ms | 4ms | 16ms | 64ms | 256ms | 1s | 4s | 16s | gt | max |
|---|---|---|---|---|---|---|---|---|---|---|---|
| pg1214_def.cx7_gcp_c2s60 | 96.664 | 2.686 | 0.642 | 0.008 | 0.072 | ||||||
| pg1214_o3_native_lto.cx7_gcp_c2s60 | 98.608 | 1.206 | 0.186 | 0.040 |
Performance metrics for the DBMS listed above. Some are normalized by throughput, others are not. Legend for results is here.
ips	qps	rps	rmbps	wps	wmbps	rpq	rkbpq	wpi	wkbpi	csps	cpups	cspq	cpupq	dbgb1	dbgb2	rss	maxop	p50	p99	tag
1976	190935	0	0.0	2853.1	62.9	0.000	0.000	1.444	32.614	682101	62.9	3.572	99	171.0	272.4	0.0	0.026	9557	9210	400m.pg1214_def.cx7_gcp_c2s60
1977	197494	0	0.0	2772.4	79.9	0.000	0.000	1.402	41.384	703046	63.0	3.560	96	171.1	293.7	0.0	0.023	9850	9494	400m.pg1214_o3_native_lto.cx7_gcp_c2s60
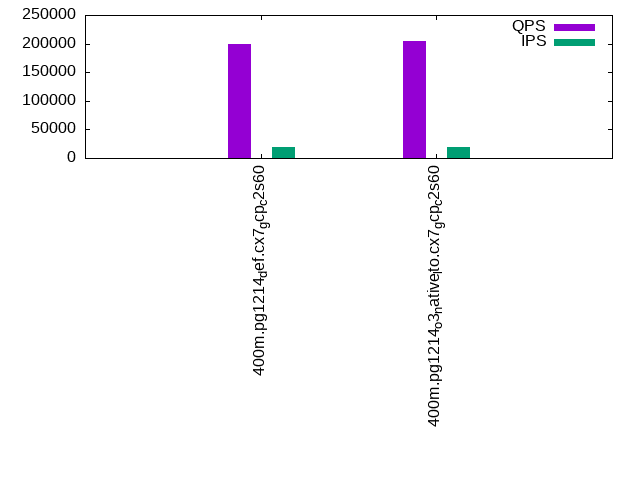
q500.1
q500.1: range queries with 500 insert/s per client. Graphs for performance per 1-second interval are here.
Average throughput:
Query response time histogram: each cell has the percentage of responses that take <= the time in the header and max is the max response time in seconds. For max values in the top 25% of the range have a red background and in the bottom 25% of the range have a green background. The red background is not used when the min value is within 80% of the max value.
| dbms | 256us | 1ms | 4ms | 16ms | 64ms | 256ms | 1s | 4s | 16s | gt | max |
|---|---|---|---|---|---|---|---|---|---|---|---|
| pg1214_def.cx7_gcp_c2s60 | 99.913 | 0.057 | 0.027 | 0.003 | nonzero | nonzero | 0.109 | ||||
| pg1214_o3_native_lto.cx7_gcp_c2s60 | 99.919 | 0.052 | 0.026 | 0.003 | nonzero | 0.032 |
Insert response time histogram: each cell has the percentage of responses that take <= the time in the header and max is the max response time in seconds. For max values in the top 25% of the range have a red background and in the bottom 25% of the range have a green background. The red background is not used when the min value is within 80% of the max value.
| dbms | 256us | 1ms | 4ms | 16ms | 64ms | 256ms | 1s | 4s | 16s | gt | max |
|---|---|---|---|---|---|---|---|---|---|---|---|
| pg1214_def.cx7_gcp_c2s60 | 51.757 | 28.010 | 19.903 | 0.326 | 0.004 | 0.284 | |||||
| pg1214_o3_native_lto.cx7_gcp_c2s60 | 51.870 | 27.890 | 19.893 | 0.342 | 0.005 | 0.334 |
Performance metrics for the DBMS listed above. Some are normalized by throughput, others are not. Legend for results is here.
ips	qps	rps	rmbps	wps	wmbps	rpq	rkbpq	wpi	wkbpi	csps	cpups	cspq	cpupq	dbgb1	dbgb2	rss	maxop	p50	p99	tag
9885	192570	0	0.0	4865.2	155.6	0.000	0.000	0.492	16.122	673508	63.9	3.497	100	175.9	244.8	0.0	0.109	9590	9130	400m.pg1214_def.cx7_gcp_c2s60
9885	200007	0	0.0	4794.9	156.4	0.000	0.000	0.485	16.204	697274	63.8	3.486	96	176.0	257.7	0.0	0.032	9893	9477	400m.pg1214_o3_native_lto.cx7_gcp_c2s60
q1000.1
q1000.1: range queries with 1000 insert/s per client. Graphs for performance per 1-second interval are here.
Average throughput:
Query response time histogram: each cell has the percentage of responses that take <= the time in the header and max is the max response time in seconds. For max values in the top 25% of the range have a red background and in the bottom 25% of the range have a green background. The red background is not used when the min value is within 80% of the max value.
| dbms | 256us | 1ms | 4ms | 16ms | 64ms | 256ms | 1s | 4s | 16s | gt | max |
|---|---|---|---|---|---|---|---|---|---|---|---|
| pg1214_def.cx7_gcp_c2s60 | 99.865 | 0.094 | 0.037 | 0.004 | nonzero | 0.038 | |||||
| pg1214_o3_native_lto.cx7_gcp_c2s60 | 99.869 | 0.091 | 0.037 | 0.004 | nonzero | nonzero | 0.146 |
Insert response time histogram: each cell has the percentage of responses that take <= the time in the header and max is the max response time in seconds. For max values in the top 25% of the range have a red background and in the bottom 25% of the range have a green background. The red background is not used when the min value is within 80% of the max value.
| dbms | 256us | 1ms | 4ms | 16ms | 64ms | 256ms | 1s | 4s | 16s | gt | max |
|---|---|---|---|---|---|---|---|---|---|---|---|
| pg1214_def.cx7_gcp_c2s60 | 61.249 | 25.870 | 12.569 | 0.313 | 0.233 | ||||||
| pg1214_o3_native_lto.cx7_gcp_c2s60 | 60.416 | 26.150 | 13.099 | 0.335 | nonzero | 0.273 |
Performance metrics for the DBMS listed above. Some are normalized by throughput, others are not. Legend for results is here.
ips	qps	rps	rmbps	wps	wmbps	rpq	rkbpq	wpi	wkbpi	csps	cpups	cspq	cpupq	dbgb1	dbgb2	rss	maxop	p50	p99	tag
19769	198761	0	0.0	4373.1	213.2	0.000	0.000	0.221	11.043	666664	65.4	3.354	99	189.4	253.7	0.0	0.038	9817	9158	400m.pg1214_def.cx7_gcp_c2s60
19769	205299	0	0.0	4435.9	218.3	0.000	0.000	0.224	11.307	688133	65.4	3.352	96	189.4	259.9	0.0	0.146	10261	9526	400m.pg1214_o3_native_lto.cx7_gcp_c2s60
l.i0
l.i0: load without secondary indexes
Performance metrics for all DBMS, not just the ones listed above. Some are normalized by throughput, others are not. Legend for results is here.
ips	qps	rps	rmbps	wps	wmbps	rpq	rkbpq	wpi	wkbpi	csps	cpups	cspq	cpupq	dbgb1	dbgb2	rss	maxop	p50	p99	tag
1092896	0	0	0.0	1703.6	413.1	0.000	0.000	0.002	0.387	288881	58.5	0.264	16	43.0	112.2	0.0	0.752	60665	6293	400m.pg1214_def.cx7_gcp_c2s60
1111111	0	0	0.0	1785.1	427.3	0.000	0.000	0.002	0.394	308509	57.4	0.278	15	43.0	112.3	0.0	0.729	61833	12986	400m.pg1214_o3_native_lto.cx7_gcp_c2s60
l.x
l.x: create secondary indexes
Performance metrics for all DBMS, not just the ones listed above. Some are normalized by throughput, others are not. Legend for results is here.
ips	qps	rps	rmbps	wps	wmbps	rpq	rkbpq	wpi	wkbpi	csps	cpups	cspq	cpupq	dbgb1	dbgb2	rss	maxop	p50	p99	tag
310155	0	1478	18.2	609.9	124.6	0.005	0.060	0.002	0.411	1430	3.3	0.005	3	78.3	148.3	0.0	0.002	NA	NA	400m.pg1214_def.cx7_gcp_c2s60
327951	0	1654	19.8	650.3	129.4	0.005	0.062	0.002	0.404	1882	3.3	0.006	3	78.3	153.5	0.0	0.002	NA	NA	400m.pg1214_o3_native_lto.cx7_gcp_c2s60
l.i1
l.i1: continue load after secondary indexes created
Performance metrics for all DBMS, not just the ones listed above. Some are normalized by throughput, others are not. Legend for results is here.
ips	qps	rps	rmbps	wps	wmbps	rpq	rkbpq	wpi	wkbpi	csps	cpups	cspq	cpupq	dbgb1	dbgb2	rss	maxop	p50	p99	tag
396040	0	3063	27.9	2357.4	389.8	0.008	0.072	0.006	1.008	259388	54.0	0.655	41	170.2	296.8	0.0	0.879	24373	1948	400m.pg1214_def.cx7_gcp_c2s60
398010	0	2999	27.8	2466.9	390.4	0.008	0.072	0.006	1.004	277376	53.3	0.697	40	170.2	305.6	0.0	0.865	24473	1848	400m.pg1214_o3_native_lto.cx7_gcp_c2s60
q100.1
q100.1: range queries with 100 insert/s per client
Performance metrics for all DBMS, not just the ones listed above. Some are normalized by throughput, others are not. Legend for results is here.
ips	qps	rps	rmbps	wps	wmbps	rpq	rkbpq	wpi	wkbpi	csps	cpups	cspq	cpupq	dbgb1	dbgb2	rss	maxop	p50	p99	tag
1976	190935	0	0.0	2853.1	62.9	0.000	0.000	1.444	32.614	682101	62.9	3.572	99	171.0	272.4	0.0	0.026	9557	9210	400m.pg1214_def.cx7_gcp_c2s60
1977	197494	0	0.0	2772.4	79.9	0.000	0.000	1.402	41.384	703046	63.0	3.560	96	171.1	293.7	0.0	0.023	9850	9494	400m.pg1214_o3_native_lto.cx7_gcp_c2s60
q500.1
q500.1: range queries with 500 insert/s per client
Performance metrics for all DBMS, not just the ones listed above. Some are normalized by throughput, others are not. Legend for results is here.
ips	qps	rps	rmbps	wps	wmbps	rpq	rkbpq	wpi	wkbpi	csps	cpups	cspq	cpupq	dbgb1	dbgb2	rss	maxop	p50	p99	tag
9885	192570	0	0.0	4865.2	155.6	0.000	0.000	0.492	16.122	673508	63.9	3.497	100	175.9	244.8	0.0	0.109	9590	9130	400m.pg1214_def.cx7_gcp_c2s60
9885	200007	0	0.0	4794.9	156.4	0.000	0.000	0.485	16.204	697274	63.8	3.486	96	176.0	257.7	0.0	0.032	9893	9477	400m.pg1214_o3_native_lto.cx7_gcp_c2s60
q1000.1
q1000.1: range queries with 1000 insert/s per client
Performance metrics for all DBMS, not just the ones listed above. Some are normalized by throughput, others are not. Legend for results is here.
ips	qps	rps	rmbps	wps	wmbps	rpq	rkbpq	wpi	wkbpi	csps	cpups	cspq	cpupq	dbgb1	dbgb2	rss	maxop	p50	p99	tag
19769	198761	0	0.0	4373.1	213.2	0.000	0.000	0.221	11.043	666664	65.4	3.354	99	189.4	253.7	0.0	0.038	9817	9158	400m.pg1214_def.cx7_gcp_c2s60
19769	205299	0	0.0	4435.9	218.3	0.000	0.000	0.224	11.307	688133	65.4	3.352	96	189.4	259.9	0.0	0.146	10261	9526	400m.pg1214_o3_native_lto.cx7_gcp_c2s60
l.i0
- l.i0: load without secondary indexes
- Legend for results is here.
- Each entry lists the percentage of responses that fit in that bucket (slower than max time for previous bucket, faster than min time for next bucket).
Insert response time histogram
256us	1ms	4ms	16ms	64ms	256ms	1s	4s	16s	gt	max	tag
0.000	18.689	78.103	3.158	0.012	0.021	0.016	0.000	0.000	0.000	0.752	pg1214_def.cx7_gcp_c2s60
0.000	25.467	71.174	3.311	0.009	0.025	0.015	0.000	0.000	0.000	0.729	pg1214_o3_native_lto.cx7_gcp_c2s60
l.x
- l.x: create secondary indexes
- Legend for results is here.
- Each entry lists the percentage of responses that fit in that bucket (slower than max time for previous bucket, faster than min time for next bucket).
TODO - determine whether there is data for create index response time
l.i1
- l.i1: continue load after secondary indexes created
- Legend for results is here.
- Each entry lists the percentage of responses that fit in that bucket (slower than max time for previous bucket, faster than min time for next bucket).
Insert response time histogram
256us	1ms	4ms	16ms	64ms	256ms	1s	4s	16s	gt	max	tag
0.000	0.000	94.579	4.326	1.057	0.024	0.013	0.000	0.000	0.000	0.879	pg1214_def.cx7_gcp_c2s60
0.000	0.000	94.561	4.407	0.992	0.026	0.013	0.000	0.000	0.000	0.865	pg1214_o3_native_lto.cx7_gcp_c2s60
q100.1
- q100.1: range queries with 100 insert/s per client
- Legend for results is here.
- Each entry lists the percentage of responses that fit in that bucket (slower than max time for previous bucket, faster than min time for next bucket).
Query response time histogram
256us	1ms	4ms	16ms	64ms	256ms	1s	4s	16s	gt	max	tag
99.973	0.020	0.006	0.001	nonzero	0.000	0.000	0.000	0.000	0.000	0.026	pg1214_def.cx7_gcp_c2s60
99.975	0.018	0.006	0.001	nonzero	0.000	0.000	0.000	0.000	0.000	0.023	pg1214_o3_native_lto.cx7_gcp_c2s60
Insert response time histogram
256us	1ms	4ms	16ms	64ms	256ms	1s	4s	16s	gt	max	tag
0.000	0.000	96.664	2.686	0.642	0.008	0.000	0.000	0.000	0.000	0.072	pg1214_def.cx7_gcp_c2s60
0.000	0.000	98.608	1.206	0.186	0.000	0.000	0.000	0.000	0.000	0.040	pg1214_o3_native_lto.cx7_gcp_c2s60
q500.1
- q500.1: range queries with 500 insert/s per client
- Legend for results is here.
- Each entry lists the percentage of responses that fit in that bucket (slower than max time for previous bucket, faster than min time for next bucket).
Query response time histogram
256us	1ms	4ms	16ms	64ms	256ms	1s	4s	16s	gt	max	tag
99.913	0.057	0.027	0.003	nonzero	nonzero	0.000	0.000	0.000	0.000	0.109	pg1214_def.cx7_gcp_c2s60
99.919	0.052	0.026	0.003	nonzero	0.000	0.000	0.000	0.000	0.000	0.032	pg1214_o3_native_lto.cx7_gcp_c2s60
Insert response time histogram
256us	1ms	4ms	16ms	64ms	256ms	1s	4s	16s	gt	max	tag
0.000	0.000	51.757	28.010	19.903	0.326	0.004	0.000	0.000	0.000	0.284	pg1214_def.cx7_gcp_c2s60
0.000	0.000	51.870	27.890	19.893	0.342	0.005	0.000	0.000	0.000	0.334	pg1214_o3_native_lto.cx7_gcp_c2s60
q1000.1
- q1000.1: range queries with 1000 insert/s per client
- Legend for results is here.
- Each entry lists the percentage of responses that fit in that bucket (slower than max time for previous bucket, faster than min time for next bucket).
Query response time histogram
256us	1ms	4ms	16ms	64ms	256ms	1s	4s	16s	gt	max	tag
99.865	0.094	0.037	0.004	nonzero	0.000	0.000	0.000	0.000	0.000	0.038	pg1214_def.cx7_gcp_c2s60
99.869	0.091	0.037	0.004	nonzero	nonzero	0.000	0.000	0.000	0.000	0.146	pg1214_o3_native_lto.cx7_gcp_c2s60
Insert response time histogram
256us	1ms	4ms	16ms	64ms	256ms	1s	4s	16s	gt	max	tag
0.000	0.000	61.249	25.870	12.569	0.313	0.000	0.000	0.000	0.000	0.233	pg1214_def.cx7_gcp_c2s60
0.000	0.000	60.416	26.150	13.099	0.335	nonzero	0.000	0.000	0.000	0.273	pg1214_o3_native_lto.cx7_gcp_c2s60