Introduction
This is a report for the insert benchmark with 400M docs and 20 client(s). It is generated by scripts (bash, awk, sed) and Tufte might not be impressed. An overview of the insert benchmark is here and a short update is here. Below, by DBMS, I mean DBMS+version.config. An example is my8020.c10b40 where my means MySQL, 8020 is version 8.0.20 and c10b40 is the name for the configuration file.
The test server is a c2-standard-60 from GCP with 30 cores, hyperthreading disabled, 240G RAM and 3T from XFS and SW RAID 0 striped over 8 local NVMe drives. The benchmark was run with 20 clients and there were 1 or 2 connections per client (1 for queries, 1 for inserts). The benchmark loads 400M rows without secondary indexes, creates secondary indexes, loads another 400M rows then does 3 read+write tests for one hour each that do queries as fast as possible with 100, 500 and then 1000 writes/second/client concurrent with the queries. Each read-write test runs for 1800 seconds. The test was configured to use one table. The database fits in the OS page cache but not the DBMS buffer pool. Clients and the DBMS share one server. The per-database configs are in the per-database subdirectories here.
The tested DBMS are:
- pg1214_def.cx7_gcp_c2s60_4g - Postgres 12.14, the cx7_gcp_c2s60_4g config and a default build that used -O2
- pg1214_o3_native_lto.cx7_gcp_c2s60_4g - Postgres 12.14, the cx7_gcp_c2s60_4g config and a build that uses -O3 -march=native -mtune=native -flto (link-time optimization)
Contents
- Summary
- l.i0: load without secondary indexes
- l.x: create secondary indexes
- l.i1: continue load after secondary indexes created
- q100.1: range queries with 100 insert/s per client
- q500.1: range queries with 500 insert/s per client
- q1000.1: range queries with 1000 insert/s per client
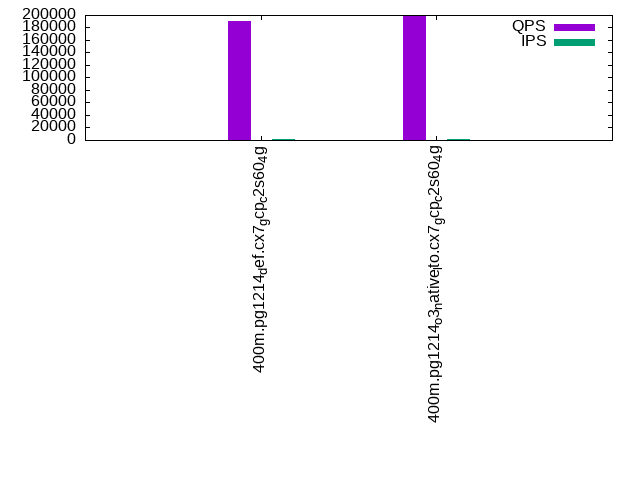
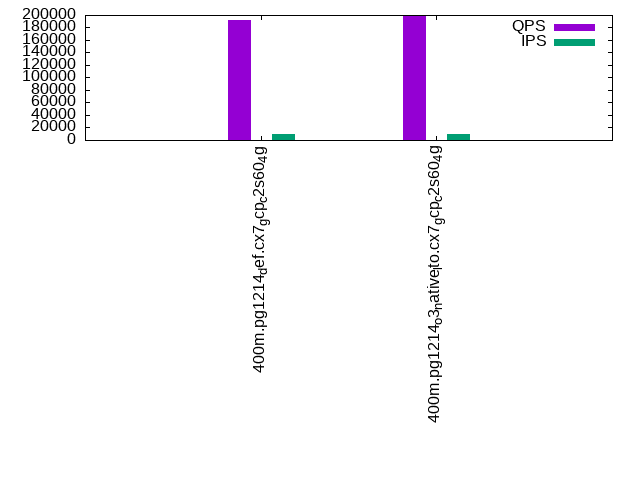
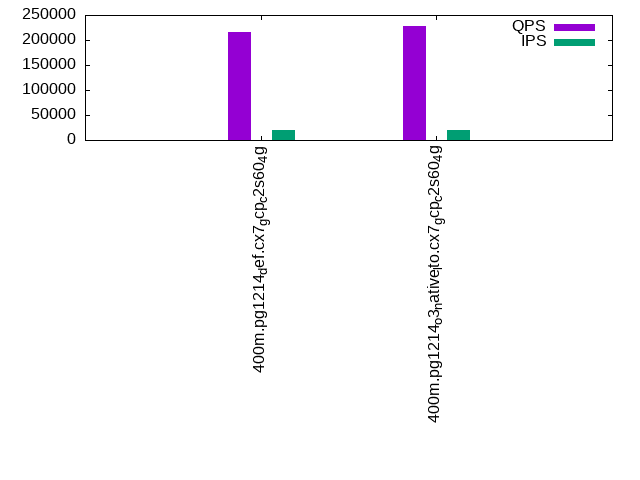
Summary
The numbers are inserts/s for l.i0 and l.i1, indexed docs (or rows) /s for l.x and queries/s for q*.2. The values are the average rate over the entire test for inserts (IPS) and queries (QPS). The range of values for IPS and QPS is split into 3 parts: bottom 25%, middle 50%, top 25%. Values in the bottom 25% have a red background, values in the top 25% have a green background and values in the middle have no color. A gray background is used for values that can be ignored because the DBMS did not sustain the target insert rate. Red backgrounds are not used when the minimum value is within 80% of the max value.
| dbms | l.i0 | l.x | l.i1 | q100.1 | q500.1 | q1000.1 |
|---|---|---|---|---|---|---|
| 400m.pg1214_def.cx7_gcp_c2s60_4g | 1095890 | 291831 | 33690 | 190522 | 191892 | 216892 |
| 400m.pg1214_o3_native_lto.cx7_gcp_c2s60_4g | 1120448 | 310637 | 33650 | 198191 | 199459 | 227352 |
This lists the average rate of inserts/s for the tests that do inserts concurrent with queries. For such tests the query rate is listed in the table above. The read+write tests are setup so that the insert rate should match the target rate every second. Cells that are not at least 95% of the target have a red background to indicate a failure to satisfy the target.
| dbms | q100.1 | q500.1 | q1000.1 |
|---|---|---|---|
| pg1214_def.cx7_gcp_c2s60_4g | 1976 | 9885 | 19640 |
| pg1214_o3_native_lto.cx7_gcp_c2s60_4g | 1976 | 9890 | 19661 |
| target | 2000 | 10000 | 20000 |
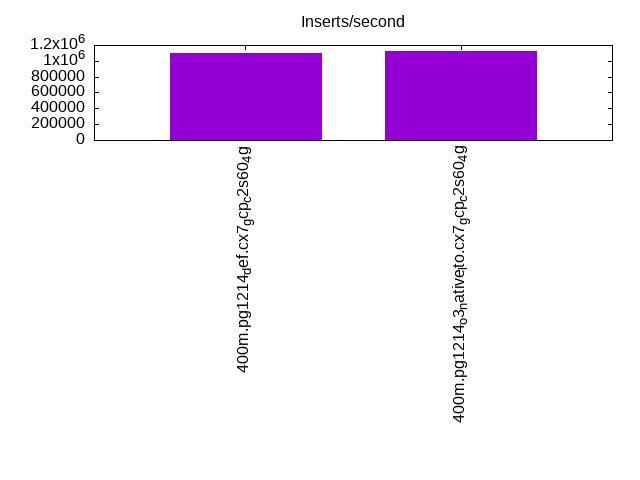
l.i0
l.i0: load without secondary indexes. Graphs for performance per 1-second interval are here.
Average throughput:
Insert response time histogram: each cell has the percentage of responses that take <= the time in the header and max is the max response time in seconds. For the max column values in the top 25% of the range have a red background and in the bottom 25% of the range have a green background. The red background is not used when the min value is within 80% of the max value.
| dbms | 256us | 1ms | 4ms | 16ms | 64ms | 256ms | 1s | 4s | 16s | gt | max |
|---|---|---|---|---|---|---|---|---|---|---|---|
| pg1214_def.cx7_gcp_c2s60_4g | 19.294 | 77.769 | 2.865 | 0.031 | 0.028 | 0.014 | 0.858 | ||||
| pg1214_o3_native_lto.cx7_gcp_c2s60_4g | 26.679 | 70.318 | 2.939 | 0.022 | 0.025 | 0.016 | 0.001 | 1.283 |
Performance metrics for the DBMS listed above. Some are normalized by throughput, others are not. Legend for results is here.
ips	qps	rps	rmbps	wps	wmbps	rpq	rkbpq	wpi	wkbpi	csps	cpups	cspq	cpupq	dbgb1	dbgb2	rss	maxop	p50	p99	tag
1095890	0	296	2.7	2464.6	463.6	0.000	0.003	0.002	0.433	287892	58.5	0.263	16	43.0	112.4	NA	0.858	60861	11687	400m.pg1214_def.cx7_gcp_c2s60_4g
1120448	0	320	2.5	2481.0	469.8	0.000	0.002	0.002	0.429	308124	58.1	0.275	16	43.0	112.4	NA	1.283	62158	12186	400m.pg1214_o3_native_lto.cx7_gcp_c2s60_4g
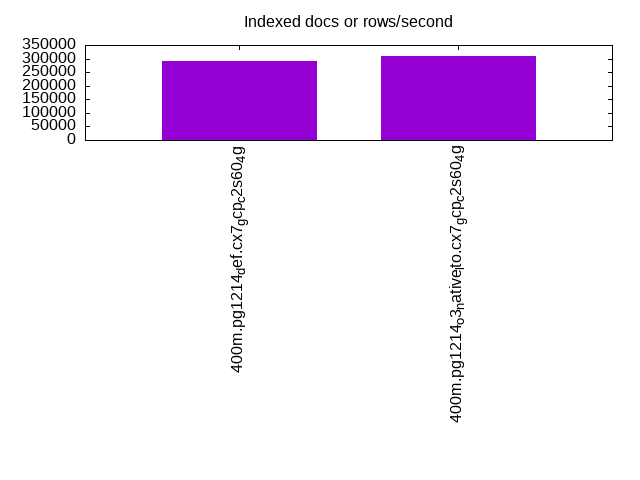
l.x
l.x: create secondary indexes.
Average throughput:
Performance metrics for the DBMS listed above. Some are normalized by throughput, others are not. Legend for results is here.
ips	qps	rps	rmbps	wps	wmbps	rpq	rkbpq	wpi	wkbpi	csps	cpups	cspq	cpupq	dbgb1	dbgb2	rss	maxop	p50	p99	tag
291831	0	1662	42.3	583.5	108.8	0.006	0.148	0.002	0.382	1386	3.4	0.005	3	78.3	148.0	0.0	0.002	NA	NA	400m.pg1214_def.cx7_gcp_c2s60_4g
310637	0	1457	44.0	596.7	115.3	0.005	0.145	0.002	0.380	1937	3.4	0.006	3	78.3	150.2	0.0	0.002	NA	NA	400m.pg1214_o3_native_lto.cx7_gcp_c2s60_4g
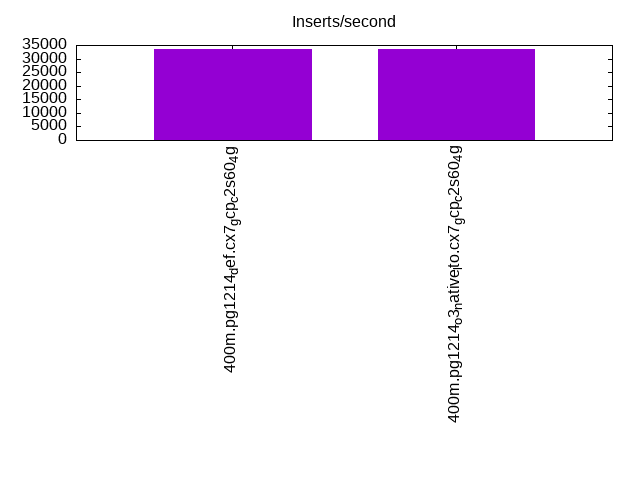
l.i1
l.i1: continue load after secondary indexes created. Graphs for performance per 1-second interval are here.
Average throughput:
Insert response time histogram: each cell has the percentage of responses that take <= the time in the header and max is the max response time in seconds. For the max column values in the top 25% of the range have a red background and in the bottom 25% of the range have a green background. The red background is not used when the min value is within 80% of the max value.
| dbms | 256us | 1ms | 4ms | 16ms | 64ms | 256ms | 1s | 4s | 16s | gt | max |
|---|---|---|---|---|---|---|---|---|---|---|---|
| pg1214_def.cx7_gcp_c2s60_4g | 0.210 | 6.450 | 88.001 | 5.339 | nonzero | 0.467 | |||||
| pg1214_o3_native_lto.cx7_gcp_c2s60_4g | 0.209 | 6.571 | 87.937 | 5.282 | 0.001 | 0.623 |
Performance metrics for the DBMS listed above. Some are normalized by throughput, others are not. Legend for results is here.
ips	qps	rps	rmbps	wps	wmbps	rpq	rkbpq	wpi	wkbpi	csps	cpups	cspq	cpupq	dbgb1	dbgb2	rss	maxop	p50	p99	tag
33690	0	71267	659.8	61200.6	594.2	2.115	20.055	1.817	18.060	129432	13.0	3.842	116	170.2	236.9	0.0	0.467	1698	749	400m.pg1214_def.cx7_gcp_c2s60_4g
33650	0	72355	664.8	61181.5	592.8	2.150	20.232	1.818	18.040	130254	12.6	3.871	112	170.2	235.1	0.0	0.623	1698	749	400m.pg1214_o3_native_lto.cx7_gcp_c2s60_4g
q100.1
q100.1: range queries with 100 insert/s per client. Graphs for performance per 1-second interval are here.
Average throughput:
Query response time histogram: each cell has the percentage of responses that take <= the time in the header and max is the max response time in seconds. For max values in the top 25% of the range have a red background and in the bottom 25% of the range have a green background. The red background is not used when the min value is within 80% of the max value.
| dbms | 256us | 1ms | 4ms | 16ms | 64ms | 256ms | 1s | 4s | 16s | gt | max |
|---|---|---|---|---|---|---|---|---|---|---|---|
| pg1214_def.cx7_gcp_c2s60_4g | 99.912 | 0.085 | 0.002 | 0.001 | nonzero | 0.027 | |||||
| pg1214_o3_native_lto.cx7_gcp_c2s60_4g | 99.926 | 0.071 | 0.002 | 0.001 | nonzero | 0.026 |
Insert response time histogram: each cell has the percentage of responses that take <= the time in the header and max is the max response time in seconds. For max values in the top 25% of the range have a red background and in the bottom 25% of the range have a green background. The red background is not used when the min value is within 80% of the max value.
| dbms | 256us | 1ms | 4ms | 16ms | 64ms | 256ms | 1s | 4s | 16s | gt | max |
|---|---|---|---|---|---|---|---|---|---|---|---|
| pg1214_def.cx7_gcp_c2s60_4g | 0.363 | 99.593 | 0.044 | 0.168 | |||||||
| pg1214_o3_native_lto.cx7_gcp_c2s60_4g | 0.603 | 99.392 | 0.004 | 0.001 | 0.322 |
Performance metrics for the DBMS listed above. Some are normalized by throughput, others are not. Legend for results is here.
ips	qps	rps	rmbps	wps	wmbps	rpq	rkbpq	wpi	wkbpi	csps	cpups	cspq	cpupq	dbgb1	dbgb2	rss	maxop	p50	p99	tag
1976	190522	3981	39.5	3959.6	50.8	0.021	0.212	2.004	26.348	680052	63.0	3.569	99	171.0	226.1	0.0	0.027	9418	9030	400m.pg1214_def.cx7_gcp_c2s60_4g
1976	198191	3800	38.6	3962.6	50.1	0.019	0.200	2.006	25.980	707664	62.7	3.571	95	171.1	219.9	0.0	0.026	9781	9401	400m.pg1214_o3_native_lto.cx7_gcp_c2s60_4g
q500.1
q500.1: range queries with 500 insert/s per client. Graphs for performance per 1-second interval are here.
Average throughput:
Query response time histogram: each cell has the percentage of responses that take <= the time in the header and max is the max response time in seconds. For max values in the top 25% of the range have a red background and in the bottom 25% of the range have a green background. The red background is not used when the min value is within 80% of the max value.
| dbms | 256us | 1ms | 4ms | 16ms | 64ms | 256ms | 1s | 4s | 16s | gt | max |
|---|---|---|---|---|---|---|---|---|---|---|---|
| pg1214_def.cx7_gcp_c2s60_4g | 99.650 | 0.337 | 0.012 | 0.001 | nonzero | 0.028 | |||||
| pg1214_o3_native_lto.cx7_gcp_c2s60_4g | 99.689 | 0.299 | 0.011 | 0.001 | nonzero | nonzero | 0.226 |
Insert response time histogram: each cell has the percentage of responses that take <= the time in the header and max is the max response time in seconds. For max values in the top 25% of the range have a red background and in the bottom 25% of the range have a green background. The red background is not used when the min value is within 80% of the max value.
| dbms | 256us | 1ms | 4ms | 16ms | 64ms | 256ms | 1s | 4s | 16s | gt | max |
|---|---|---|---|---|---|---|---|---|---|---|---|
| pg1214_def.cx7_gcp_c2s60_4g | 0.344 | 99.610 | 0.045 | 0.209 | |||||||
| pg1214_o3_native_lto.cx7_gcp_c2s60_4g | 0.536 | 99.410 | 0.054 | nonzero | 0.269 |
Performance metrics for the DBMS listed above. Some are normalized by throughput, others are not. Legend for results is here.
ips	qps	rps	rmbps	wps	wmbps	rpq	rkbpq	wpi	wkbpi	csps	cpups	cspq	cpupq	dbgb1	dbgb2	rss	maxop	p50	p99	tag
9885	191892	18760	188.3	19530.8	208.9	0.098	1.005	1.976	21.639	664482	65.5	3.463	102	175.9	223.5	0.0	0.028	9541	8934	400m.pg1214_def.cx7_gcp_c2s60_4g
9890	199459	18235	186.0	19514.5	208.0	0.091	0.955	1.973	21.539	690985	65.3	3.464	98	176.0	220.6	0.0	0.226	9861	9206	400m.pg1214_o3_native_lto.cx7_gcp_c2s60_4g
q1000.1
q1000.1: range queries with 1000 insert/s per client. Graphs for performance per 1-second interval are here.
Average throughput:
Query response time histogram: each cell has the percentage of responses that take <= the time in the header and max is the max response time in seconds. For max values in the top 25% of the range have a red background and in the bottom 25% of the range have a green background. The red background is not used when the min value is within 80% of the max value.
| dbms | 256us | 1ms | 4ms | 16ms | 64ms | 256ms | 1s | 4s | 16s | gt | max |
|---|---|---|---|---|---|---|---|---|---|---|---|
| pg1214_def.cx7_gcp_c2s60_4g | 99.435 | 0.544 | 0.020 | 0.001 | nonzero | 0.043 | |||||
| pg1214_o3_native_lto.cx7_gcp_c2s60_4g | 99.477 | 0.503 | 0.019 | 0.001 | nonzero | 0.064 |
Insert response time histogram: each cell has the percentage of responses that take <= the time in the header and max is the max response time in seconds. For max values in the top 25% of the range have a red background and in the bottom 25% of the range have a green background. The red background is not used when the min value is within 80% of the max value.
| dbms | 256us | 1ms | 4ms | 16ms | 64ms | 256ms | 1s | 4s | 16s | gt | max |
|---|---|---|---|---|---|---|---|---|---|---|---|
| pg1214_def.cx7_gcp_c2s60_4g | 1.643 | 93.034 | 5.319 | 0.004 | 0.520 | ||||||
| pg1214_o3_native_lto.cx7_gcp_c2s60_4g | 1.597 | 93.272 | 5.128 | 0.003 | 0.552 |
Performance metrics for the DBMS listed above. Some are normalized by throughput, others are not. Legend for results is here.
ips	qps	rps	rmbps	wps	wmbps	rpq	rkbpq	wpi	wkbpi	csps	cpups	cspq	cpupq	dbgb1	dbgb2	rss	maxop	p50	p99	tag
19640	216892	37936	384.3	37297.3	398.6	0.175	1.814	1.899	20.781	675428	69.8	3.114	97	189.4	249.9	0.0	0.043	10580	8071	400m.pg1214_def.cx7_gcp_c2s60_4g
19661	227352	38049	384.6	37303.1	400.8	0.167	1.732	1.897	20.873	705286	69.7	3.102	92	189.4	249.9	0.0	0.064	11092	8279	400m.pg1214_o3_native_lto.cx7_gcp_c2s60_4g
l.i0
l.i0: load without secondary indexes
Performance metrics for all DBMS, not just the ones listed above. Some are normalized by throughput, others are not. Legend for results is here.
ips	qps	rps	rmbps	wps	wmbps	rpq	rkbpq	wpi	wkbpi	csps	cpups	cspq	cpupq	dbgb1	dbgb2	rss	maxop	p50	p99	tag
1095890	0	296	2.7	2464.6	463.6	0.000	0.003	0.002	0.433	287892	58.5	0.263	16	43.0	112.4	NA	0.858	60861	11687	400m.pg1214_def.cx7_gcp_c2s60_4g
1120448	0	320	2.5	2481.0	469.8	0.000	0.002	0.002	0.429	308124	58.1	0.275	16	43.0	112.4	NA	1.283	62158	12186	400m.pg1214_o3_native_lto.cx7_gcp_c2s60_4g
l.x
l.x: create secondary indexes
Performance metrics for all DBMS, not just the ones listed above. Some are normalized by throughput, others are not. Legend for results is here.
ips	qps	rps	rmbps	wps	wmbps	rpq	rkbpq	wpi	wkbpi	csps	cpups	cspq	cpupq	dbgb1	dbgb2	rss	maxop	p50	p99	tag
291831	0	1662	42.3	583.5	108.8	0.006	0.148	0.002	0.382	1386	3.4	0.005	3	78.3	148.0	0.0	0.002	NA	NA	400m.pg1214_def.cx7_gcp_c2s60_4g
310637	0	1457	44.0	596.7	115.3	0.005	0.145	0.002	0.380	1937	3.4	0.006	3	78.3	150.2	0.0	0.002	NA	NA	400m.pg1214_o3_native_lto.cx7_gcp_c2s60_4g
l.i1
l.i1: continue load after secondary indexes created
Performance metrics for all DBMS, not just the ones listed above. Some are normalized by throughput, others are not. Legend for results is here.
ips	qps	rps	rmbps	wps	wmbps	rpq	rkbpq	wpi	wkbpi	csps	cpups	cspq	cpupq	dbgb1	dbgb2	rss	maxop	p50	p99	tag
33690	0	71267	659.8	61200.6	594.2	2.115	20.055	1.817	18.060	129432	13.0	3.842	116	170.2	236.9	0.0	0.467	1698	749	400m.pg1214_def.cx7_gcp_c2s60_4g
33650	0	72355	664.8	61181.5	592.8	2.150	20.232	1.818	18.040	130254	12.6	3.871	112	170.2	235.1	0.0	0.623	1698	749	400m.pg1214_o3_native_lto.cx7_gcp_c2s60_4g
q100.1
q100.1: range queries with 100 insert/s per client
Performance metrics for all DBMS, not just the ones listed above. Some are normalized by throughput, others are not. Legend for results is here.
ips	qps	rps	rmbps	wps	wmbps	rpq	rkbpq	wpi	wkbpi	csps	cpups	cspq	cpupq	dbgb1	dbgb2	rss	maxop	p50	p99	tag
1976	190522	3981	39.5	3959.6	50.8	0.021	0.212	2.004	26.348	680052	63.0	3.569	99	171.0	226.1	0.0	0.027	9418	9030	400m.pg1214_def.cx7_gcp_c2s60_4g
1976	198191	3800	38.6	3962.6	50.1	0.019	0.200	2.006	25.980	707664	62.7	3.571	95	171.1	219.9	0.0	0.026	9781	9401	400m.pg1214_o3_native_lto.cx7_gcp_c2s60_4g
q500.1
q500.1: range queries with 500 insert/s per client
Performance metrics for all DBMS, not just the ones listed above. Some are normalized by throughput, others are not. Legend for results is here.
ips	qps	rps	rmbps	wps	wmbps	rpq	rkbpq	wpi	wkbpi	csps	cpups	cspq	cpupq	dbgb1	dbgb2	rss	maxop	p50	p99	tag
9885	191892	18760	188.3	19530.8	208.9	0.098	1.005	1.976	21.639	664482	65.5	3.463	102	175.9	223.5	0.0	0.028	9541	8934	400m.pg1214_def.cx7_gcp_c2s60_4g
9890	199459	18235	186.0	19514.5	208.0	0.091	0.955	1.973	21.539	690985	65.3	3.464	98	176.0	220.6	0.0	0.226	9861	9206	400m.pg1214_o3_native_lto.cx7_gcp_c2s60_4g
q1000.1
q1000.1: range queries with 1000 insert/s per client
Performance metrics for all DBMS, not just the ones listed above. Some are normalized by throughput, others are not. Legend for results is here.
ips	qps	rps	rmbps	wps	wmbps	rpq	rkbpq	wpi	wkbpi	csps	cpups	cspq	cpupq	dbgb1	dbgb2	rss	maxop	p50	p99	tag
19640	216892	37936	384.3	37297.3	398.6	0.175	1.814	1.899	20.781	675428	69.8	3.114	97	189.4	249.9	0.0	0.043	10580	8071	400m.pg1214_def.cx7_gcp_c2s60_4g
19661	227352	38049	384.6	37303.1	400.8	0.167	1.732	1.897	20.873	705286	69.7	3.102	92	189.4	249.9	0.0	0.064	11092	8279	400m.pg1214_o3_native_lto.cx7_gcp_c2s60_4g
l.i0
- l.i0: load without secondary indexes
- Legend for results is here.
- Each entry lists the percentage of responses that fit in that bucket (slower than max time for previous bucket, faster than min time for next bucket).
Insert response time histogram
256us	1ms	4ms	16ms	64ms	256ms	1s	4s	16s	gt	max	tag
0.000	19.294	77.769	2.865	0.031	0.028	0.014	0.000	0.000	0.000	0.858	pg1214_def.cx7_gcp_c2s60_4g
0.000	26.679	70.318	2.939	0.022	0.025	0.016	0.001	0.000	0.000	1.283	pg1214_o3_native_lto.cx7_gcp_c2s60_4g
l.x
- l.x: create secondary indexes
- Legend for results is here.
- Each entry lists the percentage of responses that fit in that bucket (slower than max time for previous bucket, faster than min time for next bucket).
TODO - determine whether there is data for create index response time
l.i1
- l.i1: continue load after secondary indexes created
- Legend for results is here.
- Each entry lists the percentage of responses that fit in that bucket (slower than max time for previous bucket, faster than min time for next bucket).
Insert response time histogram
256us	1ms	4ms	16ms	64ms	256ms	1s	4s	16s	gt	max	tag
0.000	0.000	0.210	6.450	88.001	5.339	nonzero	0.000	0.000	0.000	0.467	pg1214_def.cx7_gcp_c2s60_4g
0.000	0.000	0.209	6.571	87.937	5.282	0.001	0.000	0.000	0.000	0.623	pg1214_o3_native_lto.cx7_gcp_c2s60_4g
q100.1
- q100.1: range queries with 100 insert/s per client
- Legend for results is here.
- Each entry lists the percentage of responses that fit in that bucket (slower than max time for previous bucket, faster than min time for next bucket).
Query response time histogram
256us	1ms	4ms	16ms	64ms	256ms	1s	4s	16s	gt	max	tag
99.912	0.085	0.002	0.001	nonzero	0.000	0.000	0.000	0.000	0.000	0.027	pg1214_def.cx7_gcp_c2s60_4g
99.926	0.071	0.002	0.001	nonzero	0.000	0.000	0.000	0.000	0.000	0.026	pg1214_o3_native_lto.cx7_gcp_c2s60_4g
Insert response time histogram
256us	1ms	4ms	16ms	64ms	256ms	1s	4s	16s	gt	max	tag
0.000	0.000	0.000	0.363	99.593	0.044	0.000	0.000	0.000	0.000	0.168	pg1214_def.cx7_gcp_c2s60_4g
0.000	0.000	0.000	0.603	99.392	0.004	0.001	0.000	0.000	0.000	0.322	pg1214_o3_native_lto.cx7_gcp_c2s60_4g
q500.1
- q500.1: range queries with 500 insert/s per client
- Legend for results is here.
- Each entry lists the percentage of responses that fit in that bucket (slower than max time for previous bucket, faster than min time for next bucket).
Query response time histogram
256us	1ms	4ms	16ms	64ms	256ms	1s	4s	16s	gt	max	tag
99.650	0.337	0.012	0.001	nonzero	0.000	0.000	0.000	0.000	0.000	0.028	pg1214_def.cx7_gcp_c2s60_4g
99.689	0.299	0.011	0.001	nonzero	nonzero	0.000	0.000	0.000	0.000	0.226	pg1214_o3_native_lto.cx7_gcp_c2s60_4g
Insert response time histogram
256us	1ms	4ms	16ms	64ms	256ms	1s	4s	16s	gt	max	tag
0.000	0.000	0.000	0.344	99.610	0.045	0.000	0.000	0.000	0.000	0.209	pg1214_def.cx7_gcp_c2s60_4g
0.000	0.000	0.000	0.536	99.410	0.054	nonzero	0.000	0.000	0.000	0.269	pg1214_o3_native_lto.cx7_gcp_c2s60_4g
q1000.1
- q1000.1: range queries with 1000 insert/s per client
- Legend for results is here.
- Each entry lists the percentage of responses that fit in that bucket (slower than max time for previous bucket, faster than min time for next bucket).
Query response time histogram
256us	1ms	4ms	16ms	64ms	256ms	1s	4s	16s	gt	max	tag
99.435	0.544	0.020	0.001	nonzero	0.000	0.000	0.000	0.000	0.000	0.043	pg1214_def.cx7_gcp_c2s60_4g
99.477	0.503	0.019	0.001	nonzero	0.000	0.000	0.000	0.000	0.000	0.064	pg1214_o3_native_lto.cx7_gcp_c2s60_4g
Insert response time histogram
256us	1ms	4ms	16ms	64ms	256ms	1s	4s	16s	gt	max	tag
0.000	0.000	0.000	1.643	93.034	5.319	0.004	0.000	0.000	0.000	0.520	pg1214_def.cx7_gcp_c2s60_4g
0.000	0.000	0.000	1.597	93.272	5.128	0.003	0.000	0.000	0.000	0.552	pg1214_o3_native_lto.cx7_gcp_c2s60_4g