Introduction
This is a report for the insert benchmark with 400M docs and 20 client(s). It is generated by scripts (bash, awk, sed) and Tufte might not be impressed. An overview of the insert benchmark is here and a short update is here. Below, by DBMS, I mean DBMS+version.config. An example is my8020.c10b40 where my means MySQL, 8020 is version 8.0.20 and c10b40 is the name for the configuration file.
The test server is a c2-standard-60 from GCP with 30 cores, hyperthreading disabled, 240G RAM and 3T from XFS and SW RAID 0 striped over 8 local NVMe drives. The benchmark was run with 20 clients and there were 1 or 2 connections per client (1 for queries, 1 for inserts). The benchmark loads 400M rows without secondary indexes, creates secondary indexes, loads another 400M rows then does 3 read+write tests for one hour each that do queries as fast as possible with 100, 500 and then 1000 writes/second/client concurrent with the queries. Each read-write test runs for 1800 seconds. The test was configured to use a table per client. The database fits in the OS page cache but not the DBMS buffer pool. Clients and the DBMS share one server. The per-database configs are in the per-database subdirectories here.
The tested DBMS are:
- pg1214_def.cx7_gcp_c2s60_4g - Postgres 12.14, the cx7_gcp_c2s60_4g config and a default build that used -O2
- pg1214_o3_native_lto.cx7_gcp_c2s60_4g - Postgres 12.14, the cx7_gcp_c2s60_4g config and a build that uses -O3 -march=native -mtune=native -flto (link-time optimization)
Contents
- Summary
- l.i0: load without secondary indexes
- l.x: create secondary indexes
- l.i1: continue load after secondary indexes created
- q100.1: range queries with 100 insert/s per client
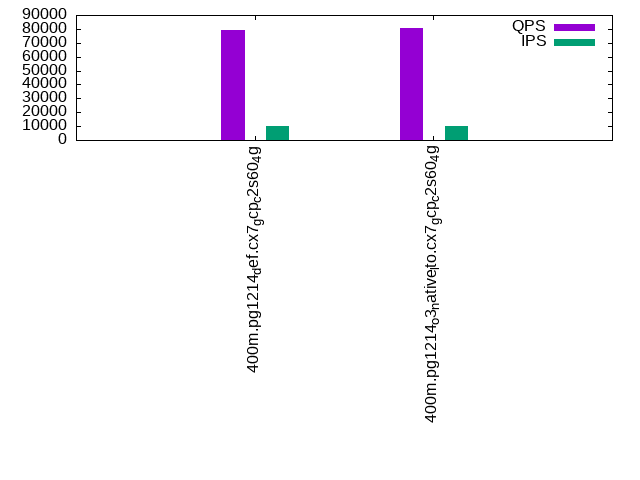
- q500.1: range queries with 500 insert/s per client
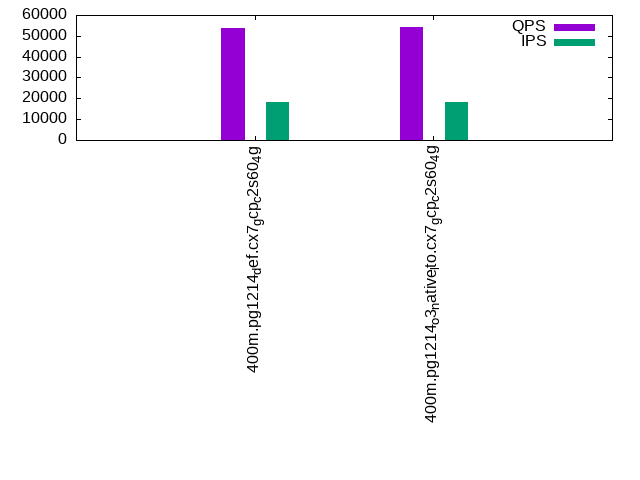
- q1000.1: range queries with 1000 insert/s per client
Summary
The numbers are inserts/s for l.i0 and l.i1, indexed docs (or rows) /s for l.x and queries/s for q*.2. The values are the average rate over the entire test for inserts (IPS) and queries (QPS). The range of values for IPS and QPS is split into 3 parts: bottom 25%, middle 50%, top 25%. Values in the bottom 25% have a red background, values in the top 25% have a green background and values in the middle have no color. A gray background is used for values that can be ignored because the DBMS did not sustain the target insert rate. Red backgrounds are not used when the minimum value is within 80% of the max value.
| dbms | l.i0 | l.x | l.i1 | q100.1 | q500.1 | q1000.1 |
|---|---|---|---|---|---|---|
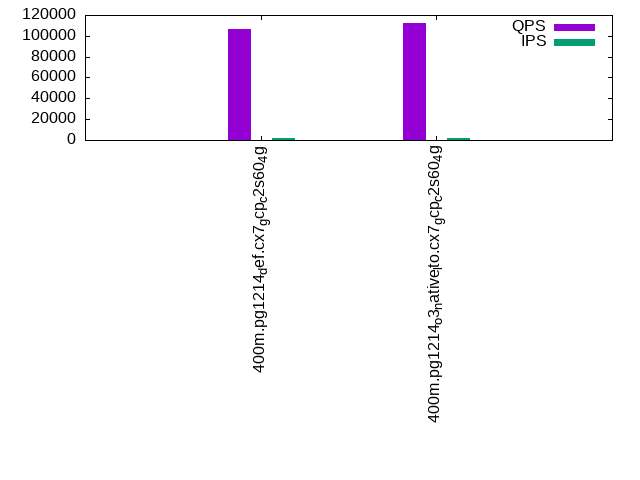
| 400m.pg1214_def.cx7_gcp_c2s60_4g | 1393728 | 1951707 | 23010 | 106161 | 78943 | 53674 |
| 400m.pg1214_o3_native_lto.cx7_gcp_c2s60_4g | 1408451 | 1990547 | 23214 | 112795 | 80661 | 54110 |
This lists the average rate of inserts/s for the tests that do inserts concurrent with queries. For such tests the query rate is listed in the table above. The read+write tests are setup so that the insert rate should match the target rate every second. Cells that are not at least 95% of the target have a red background to indicate a failure to satisfy the target.
| dbms | q100.1 | q500.1 | q1000.1 |
|---|---|---|---|
| pg1214_def.cx7_gcp_c2s60_4g | 1976 | 9885 | 18090 |
| pg1214_o3_native_lto.cx7_gcp_c2s60_4g | 1976 | 9885 | 18000 |
| target | 2000 | 10000 | 20000 |
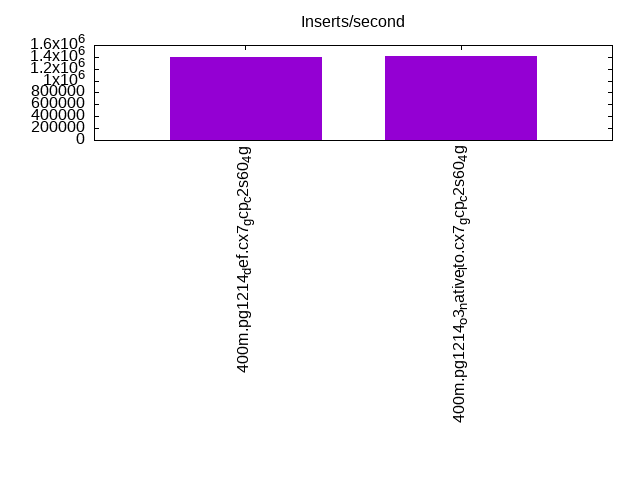
l.i0
l.i0: load without secondary indexes. Graphs for performance per 1-second interval are here.
Average throughput:
Insert response time histogram: each cell has the percentage of responses that take <= the time in the header and max is the max response time in seconds. For the max column values in the top 25% of the range have a red background and in the bottom 25% of the range have a green background. The red background is not used when the min value is within 80% of the max value.
| dbms | 256us | 1ms | 4ms | 16ms | 64ms | 256ms | 1s | 4s | 16s | gt | max |
|---|---|---|---|---|---|---|---|---|---|---|---|
| pg1214_def.cx7_gcp_c2s60_4g | 63.836 | 34.872 | 1.179 | 0.076 | 0.030 | 0.007 | 0.001 | 1.052 | |||
| pg1214_o3_native_lto.cx7_gcp_c2s60_4g | 62.613 | 36.237 | 1.038 | 0.067 | 0.035 | 0.010 | 0.509 |
Performance metrics for the DBMS listed above. Some are normalized by throughput, others are not. Legend for results is here.
ips	qps	rps	rmbps	wps	wmbps	rpq	rkbpq	wpi	wkbpi	csps	cpups	cspq	cpupq	dbgb1	dbgb2	rss	maxop	p50	p99	tag
1393728	0	737	32.8	10957.4	597.3	0.001	0.024	0.008	0.439	196847	60.7	0.141	13	38.3	103.2	NA	1.052	78909	11592	400m.pg1214_def.cx7_gcp_c2s60_4g
1408451	0	1201	32.0	11058.2	597.8	0.001	0.023	0.008	0.435	216947	59.5	0.154	13	38.3	103.2	NA	0.509	80110	19978	400m.pg1214_o3_native_lto.cx7_gcp_c2s60_4g
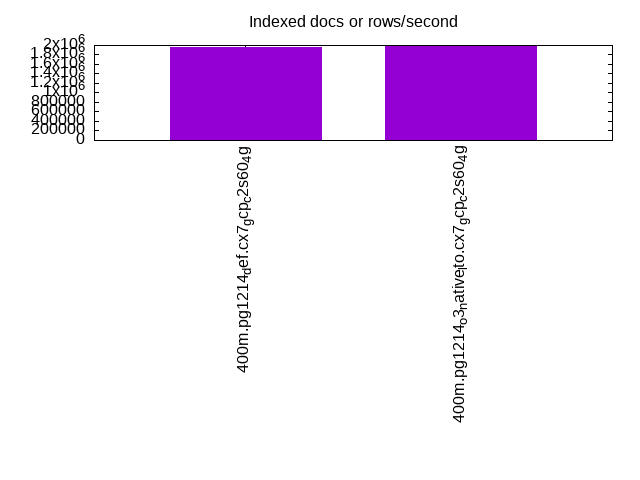
l.x
l.x: create secondary indexes.
Average throughput:
Performance metrics for the DBMS listed above. Some are normalized by throughput, others are not. Legend for results is here.
ips	qps	rps	rmbps	wps	wmbps	rpq	rkbpq	wpi	wkbpi	csps	cpups	cspq	cpupq	dbgb1	dbgb2	rss	maxop	p50	p99	tag
1951707	0	10916	287.2	8310.3	728.5	0.006	0.151	0.004	0.382	130158	23.0	0.067	4	73.5	176.7	0.0	0.099	NA	NA	400m.pg1214_def.cx7_gcp_c2s60_4g
1990547	0	13373	296.2	7980.7	735.0	0.007	0.152	0.004	0.378	131468	22.0	0.066	3	73.5	176.6	NA	0.176	NA	NA	400m.pg1214_o3_native_lto.cx7_gcp_c2s60_4g
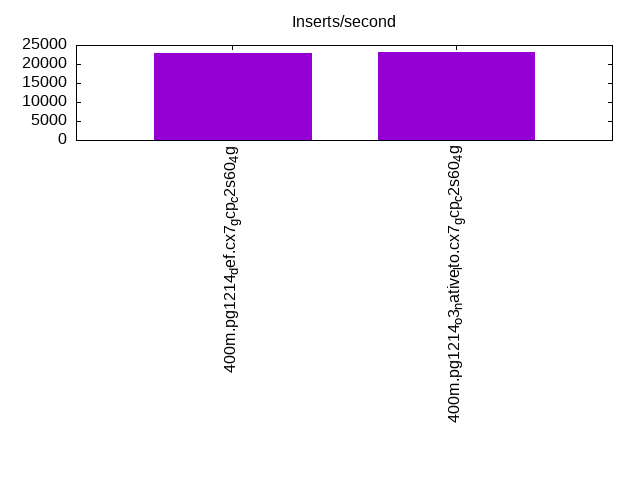
l.i1
l.i1: continue load after secondary indexes created. Graphs for performance per 1-second interval are here.
Average throughput:
Insert response time histogram: each cell has the percentage of responses that take <= the time in the header and max is the max response time in seconds. For the max column values in the top 25% of the range have a red background and in the bottom 25% of the range have a green background. The red background is not used when the min value is within 80% of the max value.
| dbms | 256us | 1ms | 4ms | 16ms | 64ms | 256ms | 1s | 4s | 16s | gt | max |
|---|---|---|---|---|---|---|---|---|---|---|---|
| pg1214_def.cx7_gcp_c2s60_4g | nonzero | 0.047 | 88.292 | 11.657 | 0.004 | 0.403 | |||||
| pg1214_o3_native_lto.cx7_gcp_c2s60_4g | 0.021 | 88.552 | 11.423 | 0.003 | 0.411 |
Performance metrics for the DBMS listed above. Some are normalized by throughput, others are not. Legend for results is here.
ips	qps	rps	rmbps	wps	wmbps	rpq	rkbpq	wpi	wkbpi	csps	cpups	cspq	cpupq	dbgb1	dbgb2	rss	maxop	p50	p99	tag
23010	0	70629	730.3	62499.6	602.6	3.070	32.499	2.716	26.818	132794	12.2	5.771	159	163.1	241.8	0.0	0.403	1199	599	400m.pg1214_def.cx7_gcp_c2s60_4g
23214	0	70200	726.8	63027.7	607.0	3.024	32.061	2.715	26.777	133977	11.9	5.771	154	163.1	240.8	0.0	0.411	1199	599	400m.pg1214_o3_native_lto.cx7_gcp_c2s60_4g
q100.1
q100.1: range queries with 100 insert/s per client. Graphs for performance per 1-second interval are here.
Average throughput:
Query response time histogram: each cell has the percentage of responses that take <= the time in the header and max is the max response time in seconds. For max values in the top 25% of the range have a red background and in the bottom 25% of the range have a green background. The red background is not used when the min value is within 80% of the max value.
| dbms | 256us | 1ms | 4ms | 16ms | 64ms | 256ms | 1s | 4s | 16s | gt | max |
|---|---|---|---|---|---|---|---|---|---|---|---|
| pg1214_def.cx7_gcp_c2s60_4g | 68.849 | 30.954 | 0.191 | 0.005 | nonzero | nonzero | 0.091 | ||||
| pg1214_o3_native_lto.cx7_gcp_c2s60_4g | 71.395 | 28.418 | 0.182 | 0.004 | nonzero | nonzero | 0.113 |
Insert response time histogram: each cell has the percentage of responses that take <= the time in the header and max is the max response time in seconds. For max values in the top 25% of the range have a red background and in the bottom 25% of the range have a green background. The red background is not used when the min value is within 80% of the max value.
| dbms | 256us | 1ms | 4ms | 16ms | 64ms | 256ms | 1s | 4s | 16s | gt | max |
|---|---|---|---|---|---|---|---|---|---|---|---|
| pg1214_def.cx7_gcp_c2s60_4g | 0.022 | 99.511 | 0.467 | 0.096 | |||||||
| pg1214_o3_native_lto.cx7_gcp_c2s60_4g | 0.025 | 99.975 | 0.062 |
Performance metrics for the DBMS listed above. Some are normalized by throughput, others are not. Legend for results is here.
ips	qps	rps	rmbps	wps	wmbps	rpq	rkbpq	wpi	wkbpi	csps	cpups	cspq	cpupq	dbgb1	dbgb2	rss	maxop	p50	p99	tag
1976	106161	85938	730.8	6179.3	72.3	0.810	7.049	3.127	37.495	487716	39.0	4.594	110	163.6	254.6	0.0	0.091	5388	4779	400m.pg1214_def.cx7_gcp_c2s60_4g
1976	112795	78618	758.9	6246.7	72.0	0.697	6.890	3.162	37.323	510081	39.7	4.522	106	163.6	235.4	0.0	0.113	5676	5146	400m.pg1214_o3_native_lto.cx7_gcp_c2s60_4g
q500.1
q500.1: range queries with 500 insert/s per client. Graphs for performance per 1-second interval are here.
Average throughput:
Query response time histogram: each cell has the percentage of responses that take <= the time in the header and max is the max response time in seconds. For max values in the top 25% of the range have a red background and in the bottom 25% of the range have a green background. The red background is not used when the min value is within 80% of the max value.
| dbms | 256us | 1ms | 4ms | 16ms | 64ms | 256ms | 1s | 4s | 16s | gt | max |
|---|---|---|---|---|---|---|---|---|---|---|---|
| pg1214_def.cx7_gcp_c2s60_4g | 61.832 | 36.767 | 1.276 | 0.120 | 0.006 | nonzero | 0.076 | ||||
| pg1214_o3_native_lto.cx7_gcp_c2s60_4g | 62.309 | 36.334 | 1.236 | 0.116 | 0.005 | 0.056 |
Insert response time histogram: each cell has the percentage of responses that take <= the time in the header and max is the max response time in seconds. For max values in the top 25% of the range have a red background and in the bottom 25% of the range have a green background. The red background is not used when the min value is within 80% of the max value.
| dbms | 256us | 1ms | 4ms | 16ms | 64ms | 256ms | 1s | 4s | 16s | gt | max |
|---|---|---|---|---|---|---|---|---|---|---|---|
| pg1214_def.cx7_gcp_c2s60_4g | 0.008 | 92.474 | 7.517 | nonzero | 0.271 | ||||||
| pg1214_o3_native_lto.cx7_gcp_c2s60_4g | 0.011 | 92.496 | 7.493 | 0.001 | 0.280 |
Performance metrics for the DBMS listed above. Some are normalized by throughput, others are not. Legend for results is here.
ips	qps	rps	rmbps	wps	wmbps	rpq	rkbpq	wpi	wkbpi	csps	cpups	cspq	cpupq	dbgb1	dbgb2	rss	maxop	p50	p99	tag
9885	78943	93856	891.6	29128.0	304.6	1.189	11.566	2.947	31.557	420138	37.7	5.322	143	167.1	239.5	0.0	0.076	4157	1933	400m.pg1214_def.cx7_gcp_c2s60_4g
9885	80661	95005	896.3	29185.3	303.1	1.178	11.379	2.953	31.399	428360	37.0	5.311	138	167.1	230.5	0.0	0.056	4267	2108	400m.pg1214_o3_native_lto.cx7_gcp_c2s60_4g
q1000.1
q1000.1: range queries with 1000 insert/s per client. Graphs for performance per 1-second interval are here.
Average throughput:
Query response time histogram: each cell has the percentage of responses that take <= the time in the header and max is the max response time in seconds. For max values in the top 25% of the range have a red background and in the bottom 25% of the range have a green background. The red background is not used when the min value is within 80% of the max value.
| dbms | 256us | 1ms | 4ms | 16ms | 64ms | 256ms | 1s | 4s | 16s | gt | max |
|---|---|---|---|---|---|---|---|---|---|---|---|
| pg1214_def.cx7_gcp_c2s60_4g | 54.805 | 41.267 | 3.336 | 0.553 | 0.039 | 0.057 | |||||
| pg1214_o3_native_lto.cx7_gcp_c2s60_4g | 54.862 | 41.216 | 3.322 | 0.563 | 0.037 | nonzero | 0.162 |
Insert response time histogram: each cell has the percentage of responses that take <= the time in the header and max is the max response time in seconds. For max values in the top 25% of the range have a red background and in the bottom 25% of the range have a green background. The red background is not used when the min value is within 80% of the max value.
| dbms | 256us | 1ms | 4ms | 16ms | 64ms | 256ms | 1s | 4s | 16s | gt | max |
|---|---|---|---|---|---|---|---|---|---|---|---|
| pg1214_def.cx7_gcp_c2s60_4g | 82.773 | 17.226 | 0.001 | 0.283 | |||||||
| pg1214_o3_native_lto.cx7_gcp_c2s60_4g | 0.018 | 82.556 | 17.424 | 0.001 | 0.296 |
Performance metrics for the DBMS listed above. Some are normalized by throughput, others are not. Legend for results is here.
ips	qps	rps	rmbps	wps	wmbps	rpq	rkbpq	wpi	wkbpi	csps	cpups	cspq	cpupq	dbgb1	dbgb2	rss	maxop	p50	p99	tag
18090	53674	96476	940.8	51613.1	532.4	1.797	17.948	2.853	30.135	366781	37.2	6.833	208	179.3	257.4	0.0	0.057	2765	1470	400m.pg1214_def.cx7_gcp_c2s60_4g
18000	54110	96553	938.9	51514.4	539.1	1.784	17.768	2.862	30.670	368878	36.4	6.817	202	179.3	257.4	0.0	0.162	2829	1518	400m.pg1214_o3_native_lto.cx7_gcp_c2s60_4g
l.i0
l.i0: load without secondary indexes
Performance metrics for all DBMS, not just the ones listed above. Some are normalized by throughput, others are not. Legend for results is here.
ips	qps	rps	rmbps	wps	wmbps	rpq	rkbpq	wpi	wkbpi	csps	cpups	cspq	cpupq	dbgb1	dbgb2	rss	maxop	p50	p99	tag
1393728	0	737	32.8	10957.4	597.3	0.001	0.024	0.008	0.439	196847	60.7	0.141	13	38.3	103.2	NA	1.052	78909	11592	400m.pg1214_def.cx7_gcp_c2s60_4g
1408451	0	1201	32.0	11058.2	597.8	0.001	0.023	0.008	0.435	216947	59.5	0.154	13	38.3	103.2	NA	0.509	80110	19978	400m.pg1214_o3_native_lto.cx7_gcp_c2s60_4g
l.x
l.x: create secondary indexes
Performance metrics for all DBMS, not just the ones listed above. Some are normalized by throughput, others are not. Legend for results is here.
ips	qps	rps	rmbps	wps	wmbps	rpq	rkbpq	wpi	wkbpi	csps	cpups	cspq	cpupq	dbgb1	dbgb2	rss	maxop	p50	p99	tag
1951707	0	10916	287.2	8310.3	728.5	0.006	0.151	0.004	0.382	130158	23.0	0.067	4	73.5	176.7	0.0	0.099	NA	NA	400m.pg1214_def.cx7_gcp_c2s60_4g
1990547	0	13373	296.2	7980.7	735.0	0.007	0.152	0.004	0.378	131468	22.0	0.066	3	73.5	176.6	NA	0.176	NA	NA	400m.pg1214_o3_native_lto.cx7_gcp_c2s60_4g
l.i1
l.i1: continue load after secondary indexes created
Performance metrics for all DBMS, not just the ones listed above. Some are normalized by throughput, others are not. Legend for results is here.
ips	qps	rps	rmbps	wps	wmbps	rpq	rkbpq	wpi	wkbpi	csps	cpups	cspq	cpupq	dbgb1	dbgb2	rss	maxop	p50	p99	tag
23010	0	70629	730.3	62499.6	602.6	3.070	32.499	2.716	26.818	132794	12.2	5.771	159	163.1	241.8	0.0	0.403	1199	599	400m.pg1214_def.cx7_gcp_c2s60_4g
23214	0	70200	726.8	63027.7	607.0	3.024	32.061	2.715	26.777	133977	11.9	5.771	154	163.1	240.8	0.0	0.411	1199	599	400m.pg1214_o3_native_lto.cx7_gcp_c2s60_4g
q100.1
q100.1: range queries with 100 insert/s per client
Performance metrics for all DBMS, not just the ones listed above. Some are normalized by throughput, others are not. Legend for results is here.
ips	qps	rps	rmbps	wps	wmbps	rpq	rkbpq	wpi	wkbpi	csps	cpups	cspq	cpupq	dbgb1	dbgb2	rss	maxop	p50	p99	tag
1976	106161	85938	730.8	6179.3	72.3	0.810	7.049	3.127	37.495	487716	39.0	4.594	110	163.6	254.6	0.0	0.091	5388	4779	400m.pg1214_def.cx7_gcp_c2s60_4g
1976	112795	78618	758.9	6246.7	72.0	0.697	6.890	3.162	37.323	510081	39.7	4.522	106	163.6	235.4	0.0	0.113	5676	5146	400m.pg1214_o3_native_lto.cx7_gcp_c2s60_4g
q500.1
q500.1: range queries with 500 insert/s per client
Performance metrics for all DBMS, not just the ones listed above. Some are normalized by throughput, others are not. Legend for results is here.
ips	qps	rps	rmbps	wps	wmbps	rpq	rkbpq	wpi	wkbpi	csps	cpups	cspq	cpupq	dbgb1	dbgb2	rss	maxop	p50	p99	tag
9885	78943	93856	891.6	29128.0	304.6	1.189	11.566	2.947	31.557	420138	37.7	5.322	143	167.1	239.5	0.0	0.076	4157	1933	400m.pg1214_def.cx7_gcp_c2s60_4g
9885	80661	95005	896.3	29185.3	303.1	1.178	11.379	2.953	31.399	428360	37.0	5.311	138	167.1	230.5	0.0	0.056	4267	2108	400m.pg1214_o3_native_lto.cx7_gcp_c2s60_4g
q1000.1
q1000.1: range queries with 1000 insert/s per client
Performance metrics for all DBMS, not just the ones listed above. Some are normalized by throughput, others are not. Legend for results is here.
ips	qps	rps	rmbps	wps	wmbps	rpq	rkbpq	wpi	wkbpi	csps	cpups	cspq	cpupq	dbgb1	dbgb2	rss	maxop	p50	p99	tag
18090	53674	96476	940.8	51613.1	532.4	1.797	17.948	2.853	30.135	366781	37.2	6.833	208	179.3	257.4	0.0	0.057	2765	1470	400m.pg1214_def.cx7_gcp_c2s60_4g
18000	54110	96553	938.9	51514.4	539.1	1.784	17.768	2.862	30.670	368878	36.4	6.817	202	179.3	257.4	0.0	0.162	2829	1518	400m.pg1214_o3_native_lto.cx7_gcp_c2s60_4g
l.i0
- l.i0: load without secondary indexes
- Legend for results is here.
- Each entry lists the percentage of responses that fit in that bucket (slower than max time for previous bucket, faster than min time for next bucket).
Insert response time histogram
256us	1ms	4ms	16ms	64ms	256ms	1s	4s	16s	gt	max	tag
0.000	63.836	34.872	1.179	0.076	0.030	0.007	0.001	0.000	0.000	1.052	pg1214_def.cx7_gcp_c2s60_4g
0.000	62.613	36.237	1.038	0.067	0.035	0.010	0.000	0.000	0.000	0.509	pg1214_o3_native_lto.cx7_gcp_c2s60_4g
l.x
- l.x: create secondary indexes
- Legend for results is here.
- Each entry lists the percentage of responses that fit in that bucket (slower than max time for previous bucket, faster than min time for next bucket).
TODO - determine whether there is data for create index response time
l.i1
- l.i1: continue load after secondary indexes created
- Legend for results is here.
- Each entry lists the percentage of responses that fit in that bucket (slower than max time for previous bucket, faster than min time for next bucket).
Insert response time histogram
256us	1ms	4ms	16ms	64ms	256ms	1s	4s	16s	gt	max	tag
0.000	0.000	nonzero	0.047	88.292	11.657	0.004	0.000	0.000	0.000	0.403	pg1214_def.cx7_gcp_c2s60_4g
0.000	0.000	0.000	0.021	88.552	11.423	0.003	0.000	0.000	0.000	0.411	pg1214_o3_native_lto.cx7_gcp_c2s60_4g
q100.1
- q100.1: range queries with 100 insert/s per client
- Legend for results is here.
- Each entry lists the percentage of responses that fit in that bucket (slower than max time for previous bucket, faster than min time for next bucket).
Query response time histogram
256us	1ms	4ms	16ms	64ms	256ms	1s	4s	16s	gt	max	tag
68.849	30.954	0.191	0.005	nonzero	nonzero	0.000	0.000	0.000	0.000	0.091	pg1214_def.cx7_gcp_c2s60_4g
71.395	28.418	0.182	0.004	nonzero	nonzero	0.000	0.000	0.000	0.000	0.113	pg1214_o3_native_lto.cx7_gcp_c2s60_4g
Insert response time histogram
256us	1ms	4ms	16ms	64ms	256ms	1s	4s	16s	gt	max	tag
0.000	0.000	0.000	0.022	99.511	0.467	0.000	0.000	0.000	0.000	0.096	pg1214_def.cx7_gcp_c2s60_4g
0.000	0.000	0.000	0.025	99.975	0.000	0.000	0.000	0.000	0.000	0.062	pg1214_o3_native_lto.cx7_gcp_c2s60_4g
q500.1
- q500.1: range queries with 500 insert/s per client
- Legend for results is here.
- Each entry lists the percentage of responses that fit in that bucket (slower than max time for previous bucket, faster than min time for next bucket).
Query response time histogram
256us	1ms	4ms	16ms	64ms	256ms	1s	4s	16s	gt	max	tag
61.832	36.767	1.276	0.120	0.006	nonzero	0.000	0.000	0.000	0.000	0.076	pg1214_def.cx7_gcp_c2s60_4g
62.309	36.334	1.236	0.116	0.005	0.000	0.000	0.000	0.000	0.000	0.056	pg1214_o3_native_lto.cx7_gcp_c2s60_4g
Insert response time histogram
256us	1ms	4ms	16ms	64ms	256ms	1s	4s	16s	gt	max	tag
0.000	0.000	0.000	0.008	92.474	7.517	nonzero	0.000	0.000	0.000	0.271	pg1214_def.cx7_gcp_c2s60_4g
0.000	0.000	0.000	0.011	92.496	7.493	0.001	0.000	0.000	0.000	0.280	pg1214_o3_native_lto.cx7_gcp_c2s60_4g
q1000.1
- q1000.1: range queries with 1000 insert/s per client
- Legend for results is here.
- Each entry lists the percentage of responses that fit in that bucket (slower than max time for previous bucket, faster than min time for next bucket).
Query response time histogram
256us	1ms	4ms	16ms	64ms	256ms	1s	4s	16s	gt	max	tag
54.805	41.267	3.336	0.553	0.039	0.000	0.000	0.000	0.000	0.000	0.057	pg1214_def.cx7_gcp_c2s60_4g
54.862	41.216	3.322	0.563	0.037	nonzero	0.000	0.000	0.000	0.000	0.162	pg1214_o3_native_lto.cx7_gcp_c2s60_4g
Insert response time histogram
256us	1ms	4ms	16ms	64ms	256ms	1s	4s	16s	gt	max	tag
0.000	0.000	0.000	0.000	82.773	17.226	0.001	0.000	0.000	0.000	0.283	pg1214_def.cx7_gcp_c2s60_4g
0.000	0.000	0.000	0.018	82.556	17.424	0.001	0.000	0.000	0.000	0.296	pg1214_o3_native_lto.cx7_gcp_c2s60_4g