Introduction
This is a report for the insert benchmark with 400M docs and 20 client(s). It is generated by scripts (bash, awk, sed) and Tufte might not be impressed. An overview of the insert benchmark is here and a short update is here. Below, by DBMS, I mean DBMS+version.config. An example is my8020.c10b40 where my means MySQL, 8020 is version 8.0.20 and c10b40 is the name for the configuration file.
The test server is a c2-standard-60 from GCP with 30 cores, hyperthreading disabled, 240G RAM and 3T from XFS and SW RAID 0 striped over 8 local NVMe drives. The benchmark was run with 20 clients and there were 1 or 2 connections per client (1 for queries, 1 for inserts). The benchmark loads 400M rows without secondary indexes, creates secondary indexes, loads another 400M rows then does 3 read+write tests for one hour each that do queries as fast as possible with 100, 500 and then 1000 writes/second/client concurrent with the queries. Each read-write test runs for 1800 seconds. The test was configured to use one table. The database is cached by the storage engine and the only IO is for writes. Clients and the DBMS share one server. The per-database configs are in the per-database subdirectories here.
The tested DBMS are:
- pg1119_def.cx7_gcp_c2s60 - Postgres 11.19, the cx7_gcp_c2s60 config and a default build that used -O2
- pg1119_o3_native_lto.cx7_gcp_c2s60 - Postgres 11.19, the cx7_gcp_c2s60 config and a build that uses -O3 -march=native -mtune=native -flto (link-time optimization)
Contents
- Summary
- l.i0: load without secondary indexes
- l.x: create secondary indexes
- l.i1: continue load after secondary indexes created
- q100.1: range queries with 100 insert/s per client
- q500.1: range queries with 500 insert/s per client
- q1000.1: range queries with 1000 insert/s per client
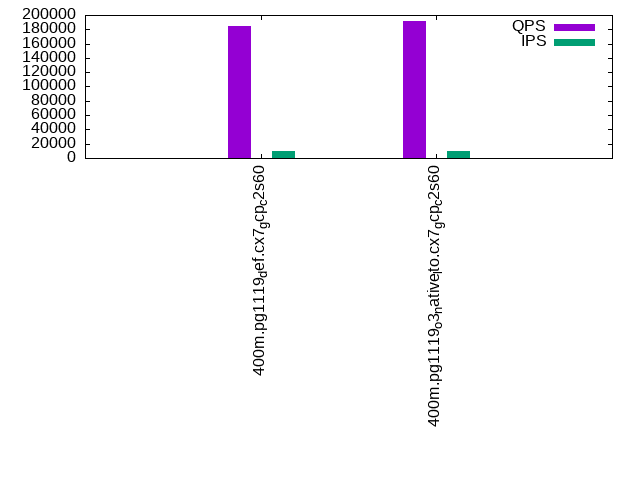
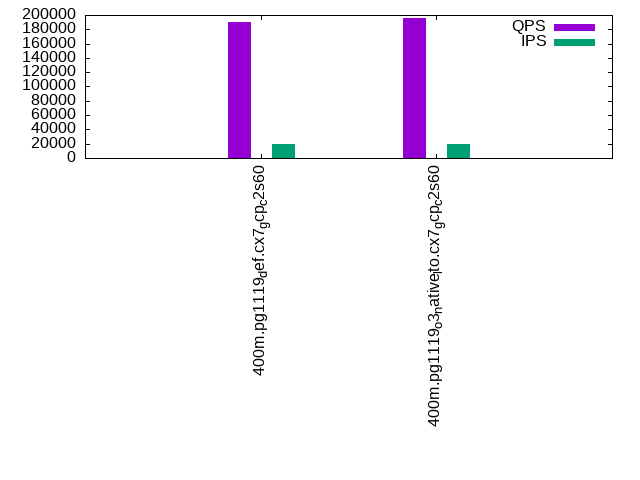
Summary
The numbers are inserts/s for l.i0 and l.i1, indexed docs (or rows) /s for l.x and queries/s for q*.2. The values are the average rate over the entire test for inserts (IPS) and queries (QPS). The range of values for IPS and QPS is split into 3 parts: bottom 25%, middle 50%, top 25%. Values in the bottom 25% have a red background, values in the top 25% have a green background and values in the middle have no color. A gray background is used for values that can be ignored because the DBMS did not sustain the target insert rate. Red backgrounds are not used when the minimum value is within 80% of the max value.
| dbms | l.i0 | l.x | l.i1 | q100.1 | q500.1 | q1000.1 |
|---|---|---|---|---|---|---|
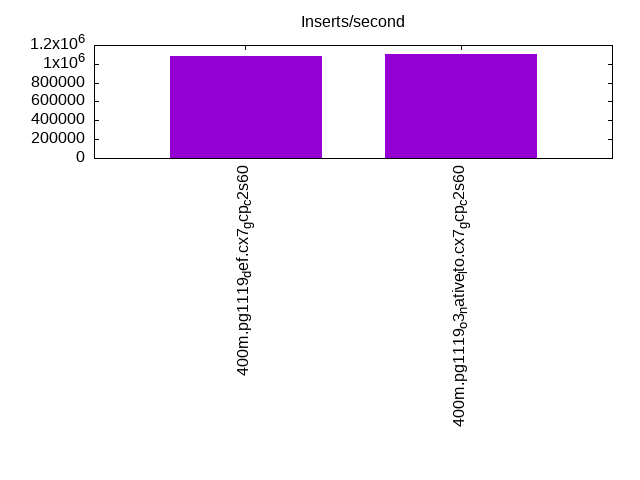
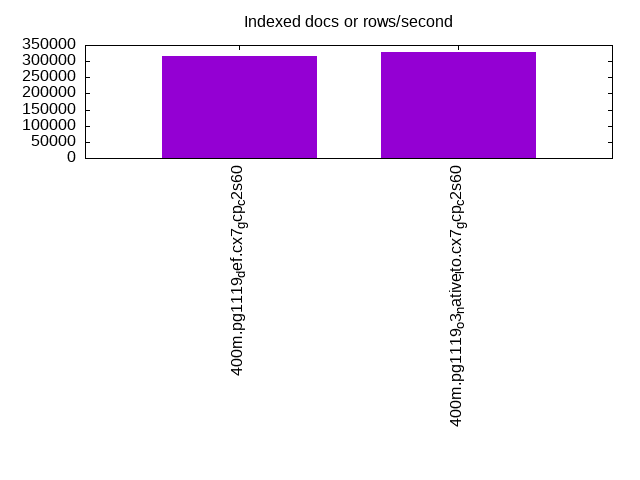
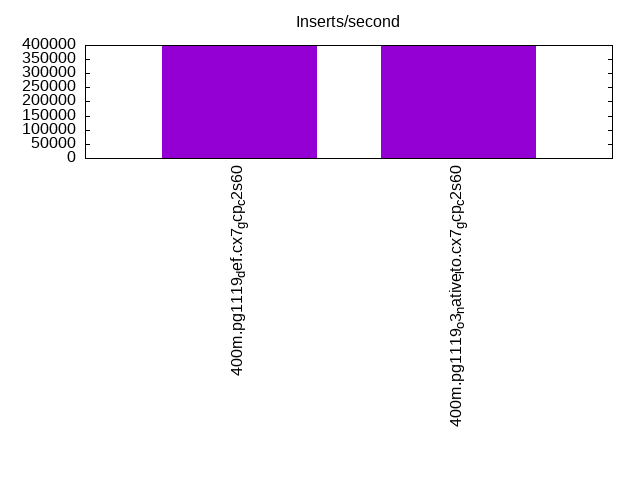
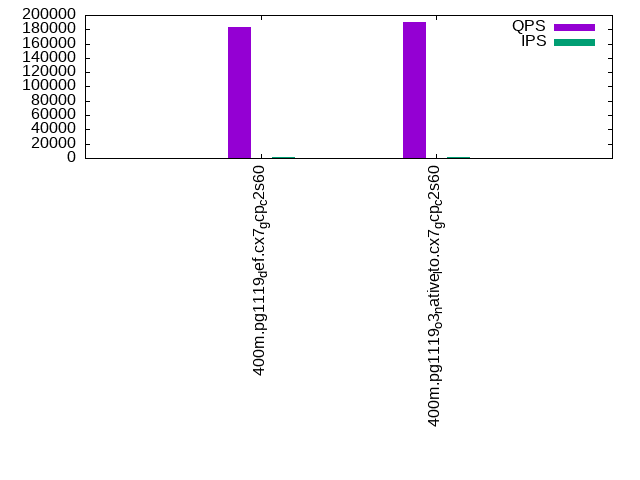
| 400m.pg1119_def.cx7_gcp_c2s60 | 1086956 | 316284 | 397614 | 182954 | 185106 | 189631 |
| 400m.pg1119_o3_native_lto.cx7_gcp_c2s60 | 1108033 | 326879 | 396432 | 189845 | 191245 | 195503 |
This lists the average rate of inserts/s for the tests that do inserts concurrent with queries. For such tests the query rate is listed in the table above. The read+write tests are setup so that the insert rate should match the target rate every second. Cells that are not at least 95% of the target have a red background to indicate a failure to satisfy the target.
| dbms | q100.1 | q500.1 | q1000.1 |
|---|---|---|---|
| pg1119_def.cx7_gcp_c2s60 | 1976 | 9885 | 19748 |
| pg1119_o3_native_lto.cx7_gcp_c2s60 | 1976 | 9890 | 19758 |
| target | 2000 | 10000 | 20000 |
l.i0
l.i0: load without secondary indexes. Graphs for performance per 1-second interval are here.
Average throughput:
Insert response time histogram: each cell has the percentage of responses that take <= the time in the header and max is the max response time in seconds. For the max column values in the top 25% of the range have a red background and in the bottom 25% of the range have a green background. The red background is not used when the min value is within 80% of the max value.
| dbms | 256us | 1ms | 4ms | 16ms | 64ms | 256ms | 1s | 4s | 16s | gt | max |
|---|---|---|---|---|---|---|---|---|---|---|---|
| pg1119_def.cx7_gcp_c2s60 | 19.224 | 77.584 | 3.141 | 0.012 | 0.021 | 0.016 | 0.001 | 1.102 | |||
| pg1119_o3_native_lto.cx7_gcp_c2s60 | 25.318 | 71.429 | 3.195 | 0.015 | 0.025 | 0.018 | 0.813 |
Performance metrics for the DBMS listed above. Some are normalized by throughput, others are not. Legend for results is here.
ips	qps	rps	rmbps	wps	wmbps	rpq	rkbpq	wpi	wkbpi	csps	cpups	cspq	cpupq	dbgb1	dbgb2	rss	maxop	p50	p99	tag
1086956	0	0	0.0	1763.1	419.5	0.000	0.000	0.002	0.395	314878	58.5	0.290	16	44.2	114.2	NA	1.102	60634	3995	400m.pg1119_def.cx7_gcp_c2s60
1108033	0	0	0.0	1764.4	421.0	0.000	0.000	0.002	0.389	350126	57.7	0.316	16	44.2	114.1	NA	0.813	61833	9693	400m.pg1119_o3_native_lto.cx7_gcp_c2s60
l.x
l.x: create secondary indexes.
Average throughput:
Performance metrics for the DBMS listed above. Some are normalized by throughput, others are not. Legend for results is here.
ips	qps	rps	rmbps	wps	wmbps	rpq	rkbpq	wpi	wkbpi	csps	cpups	cspq	cpupq	dbgb1	dbgb2	rss	maxop	p50	p99	tag
316284	0	1919	19.5	613.6	124.8	0.006	0.063	0.002	0.404	1670	3.3	0.005	3	79.5	151.4	0.0	0.002	NA	NA	400m.pg1119_def.cx7_gcp_c2s60
326879	0	1438	19.7	640.6	133.1	0.004	0.062	0.002	0.417	2019	3.3	0.006	3	79.5	155.2	0.0	0.002	NA	NA	400m.pg1119_o3_native_lto.cx7_gcp_c2s60
l.i1
l.i1: continue load after secondary indexes created. Graphs for performance per 1-second interval are here.
Average throughput:
Insert response time histogram: each cell has the percentage of responses that take <= the time in the header and max is the max response time in seconds. For the max column values in the top 25% of the range have a red background and in the bottom 25% of the range have a green background. The red background is not used when the min value is within 80% of the max value.
| dbms | 256us | 1ms | 4ms | 16ms | 64ms | 256ms | 1s | 4s | 16s | gt | max |
|---|---|---|---|---|---|---|---|---|---|---|---|
| pg1119_def.cx7_gcp_c2s60 | 94.502 | 4.529 | 0.928 | 0.028 | 0.013 | 0.001 | 1.529 | ||||
| pg1119_o3_native_lto.cx7_gcp_c2s60 | 94.637 | 4.305 | 1.015 | 0.026 | 0.016 | 0.001 | 1.199 |
Performance metrics for the DBMS listed above. Some are normalized by throughput, others are not. Legend for results is here.
ips	qps	rps	rmbps	wps	wmbps	rpq	rkbpq	wpi	wkbpi	csps	cpups	cspq	cpupq	dbgb1	dbgb2	rss	maxop	p50	p99	tag
397614	0	3127	27.8	2455.5	412.5	0.008	0.072	0.006	1.062	267225	53.9	0.672	41	176.5	309.8	0.0	1.529	24273	1798	400m.pg1119_def.cx7_gcp_c2s60
396432	0	3106	28.0	2489.5	417.0	0.008	0.072	0.006	1.077	286909	52.8	0.724	40	176.5	312.4	0.0	1.199	24484	1698	400m.pg1119_o3_native_lto.cx7_gcp_c2s60
q100.1
q100.1: range queries with 100 insert/s per client. Graphs for performance per 1-second interval are here.
Average throughput:
Query response time histogram: each cell has the percentage of responses that take <= the time in the header and max is the max response time in seconds. For max values in the top 25% of the range have a red background and in the bottom 25% of the range have a green background. The red background is not used when the min value is within 80% of the max value.
| dbms | 256us | 1ms | 4ms | 16ms | 64ms | 256ms | 1s | 4s | 16s | gt | max |
|---|---|---|---|---|---|---|---|---|---|---|---|
| pg1119_def.cx7_gcp_c2s60 | 99.964 | 0.029 | 0.006 | 0.001 | nonzero | 0.027 | |||||
| pg1119_o3_native_lto.cx7_gcp_c2s60 | 99.971 | 0.022 | 0.006 | 0.001 | nonzero | 0.025 |
Insert response time histogram: each cell has the percentage of responses that take <= the time in the header and max is the max response time in seconds. For max values in the top 25% of the range have a red background and in the bottom 25% of the range have a green background. The red background is not used when the min value is within 80% of the max value.
| dbms | 256us | 1ms | 4ms | 16ms | 64ms | 256ms | 1s | 4s | 16s | gt | max |
|---|---|---|---|---|---|---|---|---|---|---|---|
| pg1119_def.cx7_gcp_c2s60 | 98.442 | 1.024 | 0.531 | 0.004 | 0.095 | ||||||
| pg1119_o3_native_lto.cx7_gcp_c2s60 | 98.812 | 0.992 | 0.196 | 0.047 |
Performance metrics for the DBMS listed above. Some are normalized by throughput, others are not. Legend for results is here.
ips	qps	rps	rmbps	wps	wmbps	rpq	rkbpq	wpi	wkbpi	csps	cpups	cspq	cpupq	dbgb1	dbgb2	rss	maxop	p50	p99	tag
1976	182954	0	0.0	3005.6	70.9	0.000	0.000	1.521	36.729	653763	62.7	3.573	103	177.6	294.0	0.0	0.027	9078	8742	400m.pg1119_def.cx7_gcp_c2s60
1976	189845	0	0.0	2873.6	74.5	0.000	0.000	1.454	38.594	677689	62.7	3.570	99	177.6	299.1	0.0	0.025	9414	9082	400m.pg1119_o3_native_lto.cx7_gcp_c2s60
q500.1
q500.1: range queries with 500 insert/s per client. Graphs for performance per 1-second interval are here.
Average throughput:
Query response time histogram: each cell has the percentage of responses that take <= the time in the header and max is the max response time in seconds. For max values in the top 25% of the range have a red background and in the bottom 25% of the range have a green background. The red background is not used when the min value is within 80% of the max value.
| dbms | 256us | 1ms | 4ms | 16ms | 64ms | 256ms | 1s | 4s | 16s | gt | max |
|---|---|---|---|---|---|---|---|---|---|---|---|
| pg1119_def.cx7_gcp_c2s60 | 99.901 | 0.068 | 0.028 | 0.003 | nonzero | 0.028 | |||||
| pg1119_o3_native_lto.cx7_gcp_c2s60 | 99.910 | 0.060 | 0.027 | 0.003 | nonzero | nonzero | 0.133 |
Insert response time histogram: each cell has the percentage of responses that take <= the time in the header and max is the max response time in seconds. For max values in the top 25% of the range have a red background and in the bottom 25% of the range have a green background. The red background is not used when the min value is within 80% of the max value.
| dbms | 256us | 1ms | 4ms | 16ms | 64ms | 256ms | 1s | 4s | 16s | gt | max |
|---|---|---|---|---|---|---|---|---|---|---|---|
| pg1119_def.cx7_gcp_c2s60 | 51.996 | 28.145 | 19.550 | 0.309 | 0.185 | ||||||
| pg1119_o3_native_lto.cx7_gcp_c2s60 | 52.091 | 28.115 | 19.492 | 0.298 | 0.005 | 0.319 |
Performance metrics for the DBMS listed above. Some are normalized by throughput, others are not. Legend for results is here.
ips	qps	rps	rmbps	wps	wmbps	rpq	rkbpq	wpi	wkbpi	csps	cpups	cspq	cpupq	dbgb1	dbgb2	rss	maxop	p50	p99	tag
9885	185106	0	0.0	5273.7	159.2	0.000	0.000	0.534	16.496	646760	63.9	3.494	104	183.7	256.3	0.0	0.028	9222	8774	400m.pg1119_def.cx7_gcp_c2s60
9890	191245	0	0.0	5211.0	158.3	0.000	0.000	0.527	16.391	668357	63.9	3.495	100	183.7	264.2	0.0	0.133	9513	9078	400m.pg1119_o3_native_lto.cx7_gcp_c2s60
q1000.1
q1000.1: range queries with 1000 insert/s per client. Graphs for performance per 1-second interval are here.
Average throughput:
Query response time histogram: each cell has the percentage of responses that take <= the time in the header and max is the max response time in seconds. For max values in the top 25% of the range have a red background and in the bottom 25% of the range have a green background. The red background is not used when the min value is within 80% of the max value.
| dbms | 256us | 1ms | 4ms | 16ms | 64ms | 256ms | 1s | 4s | 16s | gt | max |
|---|---|---|---|---|---|---|---|---|---|---|---|
| pg1119_def.cx7_gcp_c2s60 | 99.842 | 0.117 | 0.037 | 0.003 | nonzero | nonzero | 2.008 | ||||
| pg1119_o3_native_lto.cx7_gcp_c2s60 | 99.849 | 0.109 | 0.038 | 0.003 | nonzero | nonzero | nonzero | 0.443 |
Insert response time histogram: each cell has the percentage of responses that take <= the time in the header and max is the max response time in seconds. For max values in the top 25% of the range have a red background and in the bottom 25% of the range have a green background. The red background is not used when the min value is within 80% of the max value.
| dbms | 256us | 1ms | 4ms | 16ms | 64ms | 256ms | 1s | 4s | 16s | gt | max |
|---|---|---|---|---|---|---|---|---|---|---|---|
| pg1119_def.cx7_gcp_c2s60 | 71.339 | 19.569 | 8.863 | 0.225 | 0.001 | 0.003 | 2.128 | ||||
| pg1119_o3_native_lto.cx7_gcp_c2s60 | 66.895 | 22.762 | 10.093 | 0.246 | 0.001 | 0.003 | 1.889 |
Performance metrics for the DBMS listed above. Some are normalized by throughput, others are not. Legend for results is here.
ips	qps	rps	rmbps	wps	wmbps	rpq	rkbpq	wpi	wkbpi	csps	cpups	cspq	cpupq	dbgb1	dbgb2	rss	maxop	p50	p99	tag
19748	189631	149	1.4	5176.7	216.3	0.001	0.007	0.262	11.218	640201	65.3	3.376	103	197.2	263.0	0.0	2.008	9466	8826	400m.pg1119_def.cx7_gcp_c2s60
19758	195503	152	1.4	5260.2	222.5	0.001	0.007	0.266	11.530	658328	65.4	3.367	100	197.2	266.4	0.0	0.443	9733	9110	400m.pg1119_o3_native_lto.cx7_gcp_c2s60
l.i0
l.i0: load without secondary indexes
Performance metrics for all DBMS, not just the ones listed above. Some are normalized by throughput, others are not. Legend for results is here.
ips	qps	rps	rmbps	wps	wmbps	rpq	rkbpq	wpi	wkbpi	csps	cpups	cspq	cpupq	dbgb1	dbgb2	rss	maxop	p50	p99	tag
1086956	0	0	0.0	1763.1	419.5	0.000	0.000	0.002	0.395	314878	58.5	0.290	16	44.2	114.2	NA	1.102	60634	3995	400m.pg1119_def.cx7_gcp_c2s60
1108033	0	0	0.0	1764.4	421.0	0.000	0.000	0.002	0.389	350126	57.7	0.316	16	44.2	114.1	NA	0.813	61833	9693	400m.pg1119_o3_native_lto.cx7_gcp_c2s60
l.x
l.x: create secondary indexes
Performance metrics for all DBMS, not just the ones listed above. Some are normalized by throughput, others are not. Legend for results is here.
ips	qps	rps	rmbps	wps	wmbps	rpq	rkbpq	wpi	wkbpi	csps	cpups	cspq	cpupq	dbgb1	dbgb2	rss	maxop	p50	p99	tag
316284	0	1919	19.5	613.6	124.8	0.006	0.063	0.002	0.404	1670	3.3	0.005	3	79.5	151.4	0.0	0.002	NA	NA	400m.pg1119_def.cx7_gcp_c2s60
326879	0	1438	19.7	640.6	133.1	0.004	0.062	0.002	0.417	2019	3.3	0.006	3	79.5	155.2	0.0	0.002	NA	NA	400m.pg1119_o3_native_lto.cx7_gcp_c2s60
l.i1
l.i1: continue load after secondary indexes created
Performance metrics for all DBMS, not just the ones listed above. Some are normalized by throughput, others are not. Legend for results is here.
ips	qps	rps	rmbps	wps	wmbps	rpq	rkbpq	wpi	wkbpi	csps	cpups	cspq	cpupq	dbgb1	dbgb2	rss	maxop	p50	p99	tag
397614	0	3127	27.8	2455.5	412.5	0.008	0.072	0.006	1.062	267225	53.9	0.672	41	176.5	309.8	0.0	1.529	24273	1798	400m.pg1119_def.cx7_gcp_c2s60
396432	0	3106	28.0	2489.5	417.0	0.008	0.072	0.006	1.077	286909	52.8	0.724	40	176.5	312.4	0.0	1.199	24484	1698	400m.pg1119_o3_native_lto.cx7_gcp_c2s60
q100.1
q100.1: range queries with 100 insert/s per client
Performance metrics for all DBMS, not just the ones listed above. Some are normalized by throughput, others are not. Legend for results is here.
ips	qps	rps	rmbps	wps	wmbps	rpq	rkbpq	wpi	wkbpi	csps	cpups	cspq	cpupq	dbgb1	dbgb2	rss	maxop	p50	p99	tag
1976	182954	0	0.0	3005.6	70.9	0.000	0.000	1.521	36.729	653763	62.7	3.573	103	177.6	294.0	0.0	0.027	9078	8742	400m.pg1119_def.cx7_gcp_c2s60
1976	189845	0	0.0	2873.6	74.5	0.000	0.000	1.454	38.594	677689	62.7	3.570	99	177.6	299.1	0.0	0.025	9414	9082	400m.pg1119_o3_native_lto.cx7_gcp_c2s60
q500.1
q500.1: range queries with 500 insert/s per client
Performance metrics for all DBMS, not just the ones listed above. Some are normalized by throughput, others are not. Legend for results is here.
ips	qps	rps	rmbps	wps	wmbps	rpq	rkbpq	wpi	wkbpi	csps	cpups	cspq	cpupq	dbgb1	dbgb2	rss	maxop	p50	p99	tag
9885	185106	0	0.0	5273.7	159.2	0.000	0.000	0.534	16.496	646760	63.9	3.494	104	183.7	256.3	0.0	0.028	9222	8774	400m.pg1119_def.cx7_gcp_c2s60
9890	191245	0	0.0	5211.0	158.3	0.000	0.000	0.527	16.391	668357	63.9	3.495	100	183.7	264.2	0.0	0.133	9513	9078	400m.pg1119_o3_native_lto.cx7_gcp_c2s60
q1000.1
q1000.1: range queries with 1000 insert/s per client
Performance metrics for all DBMS, not just the ones listed above. Some are normalized by throughput, others are not. Legend for results is here.
ips	qps	rps	rmbps	wps	wmbps	rpq	rkbpq	wpi	wkbpi	csps	cpups	cspq	cpupq	dbgb1	dbgb2	rss	maxop	p50	p99	tag
19748	189631	149	1.4	5176.7	216.3	0.001	0.007	0.262	11.218	640201	65.3	3.376	103	197.2	263.0	0.0	2.008	9466	8826	400m.pg1119_def.cx7_gcp_c2s60
19758	195503	152	1.4	5260.2	222.5	0.001	0.007	0.266	11.530	658328	65.4	3.367	100	197.2	266.4	0.0	0.443	9733	9110	400m.pg1119_o3_native_lto.cx7_gcp_c2s60
l.i0
- l.i0: load without secondary indexes
- Legend for results is here.
- Each entry lists the percentage of responses that fit in that bucket (slower than max time for previous bucket, faster than min time for next bucket).
Insert response time histogram
256us	1ms	4ms	16ms	64ms	256ms	1s	4s	16s	gt	max	tag
0.000	19.224	77.584	3.141	0.012	0.021	0.016	0.001	0.000	0.000	1.102	pg1119_def.cx7_gcp_c2s60
0.000	25.318	71.429	3.195	0.015	0.025	0.018	0.000	0.000	0.000	0.813	pg1119_o3_native_lto.cx7_gcp_c2s60
l.x
- l.x: create secondary indexes
- Legend for results is here.
- Each entry lists the percentage of responses that fit in that bucket (slower than max time for previous bucket, faster than min time for next bucket).
TODO - determine whether there is data for create index response time
l.i1
- l.i1: continue load after secondary indexes created
- Legend for results is here.
- Each entry lists the percentage of responses that fit in that bucket (slower than max time for previous bucket, faster than min time for next bucket).
Insert response time histogram
256us	1ms	4ms	16ms	64ms	256ms	1s	4s	16s	gt	max	tag
0.000	0.000	94.502	4.529	0.928	0.028	0.013	0.001	0.000	0.000	1.529	pg1119_def.cx7_gcp_c2s60
0.000	0.000	94.637	4.305	1.015	0.026	0.016	0.001	0.000	0.000	1.199	pg1119_o3_native_lto.cx7_gcp_c2s60
q100.1
- q100.1: range queries with 100 insert/s per client
- Legend for results is here.
- Each entry lists the percentage of responses that fit in that bucket (slower than max time for previous bucket, faster than min time for next bucket).
Query response time histogram
256us	1ms	4ms	16ms	64ms	256ms	1s	4s	16s	gt	max	tag
99.964	0.029	0.006	0.001	nonzero	0.000	0.000	0.000	0.000	0.000	0.027	pg1119_def.cx7_gcp_c2s60
99.971	0.022	0.006	0.001	nonzero	0.000	0.000	0.000	0.000	0.000	0.025	pg1119_o3_native_lto.cx7_gcp_c2s60
Insert response time histogram
256us	1ms	4ms	16ms	64ms	256ms	1s	4s	16s	gt	max	tag
0.000	0.000	98.442	1.024	0.531	0.004	0.000	0.000	0.000	0.000	0.095	pg1119_def.cx7_gcp_c2s60
0.000	0.000	98.812	0.992	0.196	0.000	0.000	0.000	0.000	0.000	0.047	pg1119_o3_native_lto.cx7_gcp_c2s60
q500.1
- q500.1: range queries with 500 insert/s per client
- Legend for results is here.
- Each entry lists the percentage of responses that fit in that bucket (slower than max time for previous bucket, faster than min time for next bucket).
Query response time histogram
256us	1ms	4ms	16ms	64ms	256ms	1s	4s	16s	gt	max	tag
99.901	0.068	0.028	0.003	nonzero	0.000	0.000	0.000	0.000	0.000	0.028	pg1119_def.cx7_gcp_c2s60
99.910	0.060	0.027	0.003	nonzero	nonzero	0.000	0.000	0.000	0.000	0.133	pg1119_o3_native_lto.cx7_gcp_c2s60
Insert response time histogram
256us	1ms	4ms	16ms	64ms	256ms	1s	4s	16s	gt	max	tag
0.000	0.000	51.996	28.145	19.550	0.309	0.000	0.000	0.000	0.000	0.185	pg1119_def.cx7_gcp_c2s60
0.000	0.000	52.091	28.115	19.492	0.298	0.005	0.000	0.000	0.000	0.319	pg1119_o3_native_lto.cx7_gcp_c2s60
q1000.1
- q1000.1: range queries with 1000 insert/s per client
- Legend for results is here.
- Each entry lists the percentage of responses that fit in that bucket (slower than max time for previous bucket, faster than min time for next bucket).
Query response time histogram
256us	1ms	4ms	16ms	64ms	256ms	1s	4s	16s	gt	max	tag
99.842	0.117	0.037	0.003	nonzero	0.000	0.000	nonzero	0.000	0.000	2.008	pg1119_def.cx7_gcp_c2s60
99.849	0.109	0.038	0.003	nonzero	nonzero	nonzero	0.000	0.000	0.000	0.443	pg1119_o3_native_lto.cx7_gcp_c2s60
Insert response time histogram
256us	1ms	4ms	16ms	64ms	256ms	1s	4s	16s	gt	max	tag
0.000	0.000	71.339	19.569	8.863	0.225	0.001	0.003	0.000	0.000	2.128	pg1119_def.cx7_gcp_c2s60
0.000	0.000	66.895	22.762	10.093	0.246	0.001	0.003	0.000	0.000	1.889	pg1119_o3_native_lto.cx7_gcp_c2s60