Introduction
This is a report for the insert benchmark with 400M docs and 20 client(s). It is generated by scripts (bash, awk, sed) and Tufte might not be impressed. An overview of the insert benchmark is here and a short update is here. Below, by DBMS, I mean DBMS+version.config. An example is my8020.c10b40 where my means MySQL, 8020 is version 8.0.20 and c10b40 is the name for the configuration file.
The test server is a c2-standard-60 from GCP with 30 cores, hyperthreading disabled, 240G RAM and 3T from XFS and SW RAID 0 striped over 8 local NVMe drives. The benchmark was run with 20 clients and there were 1 or 2 connections per client (1 for queries, 1 for inserts). The benchmark loads 400M rows without secondary indexes, creates secondary indexes, loads another 400M rows then does 3 read+write tests for one hour each that do queries as fast as possible with 100, 500 and then 1000 writes/second/client concurrent with the queries. Each read-write test runs for 1800 seconds. The test was configured to use a table per client. The database fits in the OS page cache but not the DBMS buffer pool. Clients and the DBMS share one server. The per-database configs are in the per-database subdirectories here.
The tested DBMS are:
- pg1119_def.cx7_gcp_c2s60_4g - Postgres 11.19, the cx7_gcp_c2s60_4g config and a default build that used -O2
- pg1119_o3_native_lto.cx7_gcp_c2s60_4g - Postgres 11.19, the cx7_gcp_c2s60_4g config and a build that uses -O3 -march=native -mtune=native -flto (link-time optimization)
Contents
- Summary
- l.i0: load without secondary indexes
- l.x: create secondary indexes
- l.i1: continue load after secondary indexes created
- q100.1: range queries with 100 insert/s per client
- q500.1: range queries with 500 insert/s per client
- q1000.1: range queries with 1000 insert/s per client
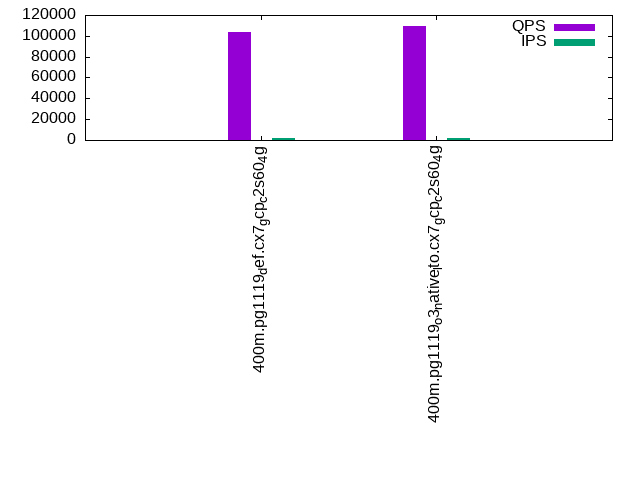
Summary
The numbers are inserts/s for l.i0 and l.i1, indexed docs (or rows) /s for l.x and queries/s for q*.2. The values are the average rate over the entire test for inserts (IPS) and queries (QPS). The range of values for IPS and QPS is split into 3 parts: bottom 25%, middle 50%, top 25%. Values in the bottom 25% have a red background, values in the top 25% have a green background and values in the middle have no color. A gray background is used for values that can be ignored because the DBMS did not sustain the target insert rate. Red backgrounds are not used when the minimum value is within 80% of the max value.
| dbms | l.i0 | l.x | l.i1 | q100.1 | q500.1 | q1000.1 |
|---|---|---|---|---|---|---|
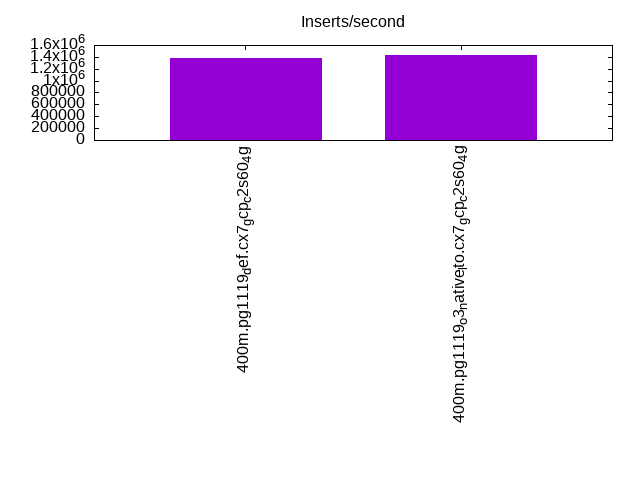
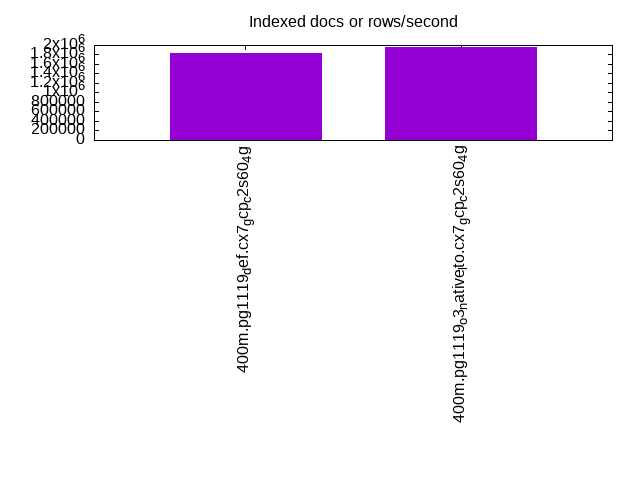
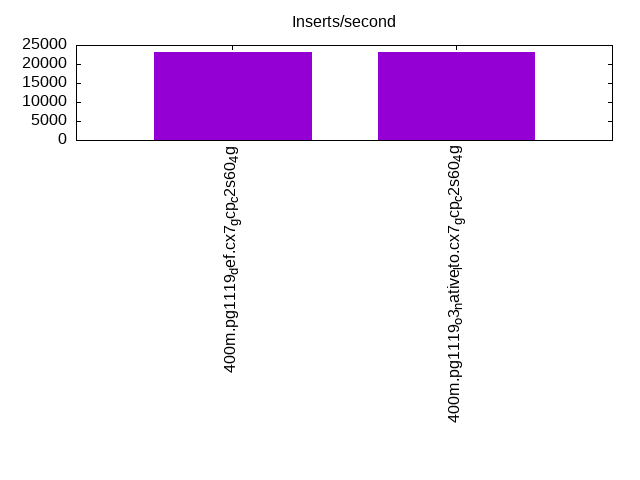
| 400m.pg1119_def.cx7_gcp_c2s60_4g | 1388889 | 1835321 | 23072 | 103244 | 77728 | 52847 |
| 400m.pg1119_o3_native_lto.cx7_gcp_c2s60_4g | 1428571 | 1961274 | 23049 | 109038 | 77910 | 53513 |
This lists the average rate of inserts/s for the tests that do inserts concurrent with queries. For such tests the query rate is listed in the table above. The read+write tests are setup so that the insert rate should match the target rate every second. Cells that are not at least 95% of the target have a red background to indicate a failure to satisfy the target.
| dbms | q100.1 | q500.1 | q1000.1 |
|---|---|---|---|
| pg1119_def.cx7_gcp_c2s60_4g | 1976 | 9885 | 18027 |
| pg1119_o3_native_lto.cx7_gcp_c2s60_4g | 1976 | 9890 | 18036 |
| target | 2000 | 10000 | 20000 |
l.i0
l.i0: load without secondary indexes. Graphs for performance per 1-second interval are here.
Average throughput:
Insert response time histogram: each cell has the percentage of responses that take <= the time in the header and max is the max response time in seconds. For the max column values in the top 25% of the range have a red background and in the bottom 25% of the range have a green background. The red background is not used when the min value is within 80% of the max value.
| dbms | 256us | 1ms | 4ms | 16ms | 64ms | 256ms | 1s | 4s | 16s | gt | max |
|---|---|---|---|---|---|---|---|---|---|---|---|
| pg1119_def.cx7_gcp_c2s60_4g | 63.456 | 35.412 | 1.047 | 0.049 | 0.026 | 0.010 | 0.997 | ||||
| pg1119_o3_native_lto.cx7_gcp_c2s60_4g | 63.091 | 35.848 | 0.970 | 0.046 | 0.034 | 0.011 | 0.450 |
Performance metrics for the DBMS listed above. Some are normalized by throughput, others are not. Legend for results is here.
ips	qps	rps	rmbps	wps	wmbps	rpq	rkbpq	wpi	wkbpi	csps	cpups	cspq	cpupq	dbgb1	dbgb2	rss	maxop	p50	p99	tag
1388889	0	70	3.6	9893.9	580.5	0.000	0.003	0.007	0.428	206614	60.5	0.149	13	38.3	103.2	NA	0.997	78649	9489	400m.pg1119_def.cx7_gcp_c2s60_4g
1428571	0	54	3.2	10074.9	594.0	0.000	0.002	0.007	0.426	224502	59.8	0.157	13	38.3	103.2	NA	0.450	81410	14384	400m.pg1119_o3_native_lto.cx7_gcp_c2s60_4g
l.x
l.x: create secondary indexes.
Average throughput:
Performance metrics for the DBMS listed above. Some are normalized by throughput, others are not. Legend for results is here.
ips	qps	rps	rmbps	wps	wmbps	rpq	rkbpq	wpi	wkbpi	csps	cpups	cspq	cpupq	dbgb1	dbgb2	rss	maxop	p50	p99	tag
1835321	0	8107	253.0	6367.1	754.1	0.004	0.141	0.003	0.421	140270	21.4	0.076	3	73.5	177.9	NA	0.191	NA	NA	400m.pg1119_def.cx7_gcp_c2s60_4g
1961274	0	13878	269.4	5385.8	760.2	0.007	0.141	0.003	0.397	125614	21.6	0.064	3	73.5	176.1	NA	0.454	NA	NA	400m.pg1119_o3_native_lto.cx7_gcp_c2s60_4g
l.i1
l.i1: continue load after secondary indexes created. Graphs for performance per 1-second interval are here.
Average throughput:
Insert response time histogram: each cell has the percentage of responses that take <= the time in the header and max is the max response time in seconds. For the max column values in the top 25% of the range have a red background and in the bottom 25% of the range have a green background. The red background is not used when the min value is within 80% of the max value.
| dbms | 256us | 1ms | 4ms | 16ms | 64ms | 256ms | 1s | 4s | 16s | gt | max |
|---|---|---|---|---|---|---|---|---|---|---|---|
| pg1119_def.cx7_gcp_c2s60_4g | nonzero | 0.032 | 88.386 | 11.580 | 0.003 | 0.438 | |||||
| pg1119_o3_native_lto.cx7_gcp_c2s60_4g | 0.014 | 88.351 | 11.631 | 0.004 | 0.368 |
Performance metrics for the DBMS listed above. Some are normalized by throughput, others are not. Legend for results is here.
ips	qps	rps	rmbps	wps	wmbps	rpq	rkbpq	wpi	wkbpi	csps	cpups	cspq	cpupq	dbgb1	dbgb2	rss	maxop	p50	p99	tag
23072	0	70133	725.0	62774.9	606.4	3.040	32.179	2.721	26.912	132833	12.3	5.757	160	165.8	246.8	NA	0.438	1199	599	400m.pg1119_def.cx7_gcp_c2s60_4g
23049	0	70546	728.7	62723.6	605.9	3.061	32.373	2.721	26.917	133167	12.1	5.777	157	165.8	246.1	0.0	0.368	1199	599	400m.pg1119_o3_native_lto.cx7_gcp_c2s60_4g
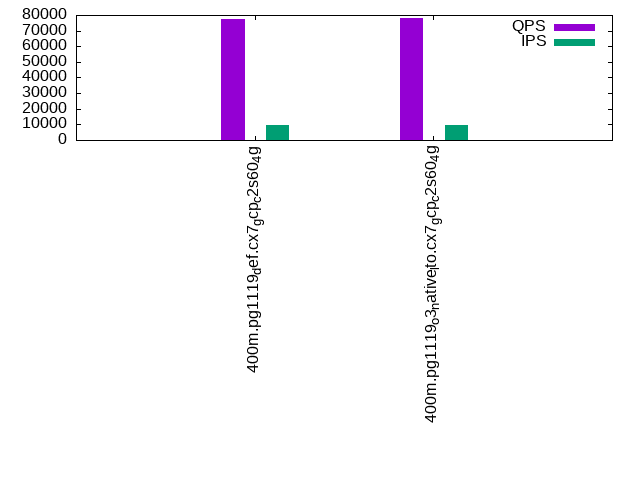
q100.1
q100.1: range queries with 100 insert/s per client. Graphs for performance per 1-second interval are here.
Average throughput:
Query response time histogram: each cell has the percentage of responses that take <= the time in the header and max is the max response time in seconds. For max values in the top 25% of the range have a red background and in the bottom 25% of the range have a green background. The red background is not used when the min value is within 80% of the max value.
| dbms | 256us | 1ms | 4ms | 16ms | 64ms | 256ms | 1s | 4s | 16s | gt | max |
|---|---|---|---|---|---|---|---|---|---|---|---|
| pg1119_def.cx7_gcp_c2s60_4g | 67.656 | 32.154 | 0.184 | 0.006 | nonzero | 0.023 | |||||
| pg1119_o3_native_lto.cx7_gcp_c2s60_4g | 69.977 | 29.838 | 0.179 | 0.006 | nonzero | 0.060 |
Insert response time histogram: each cell has the percentage of responses that take <= the time in the header and max is the max response time in seconds. For max values in the top 25% of the range have a red background and in the bottom 25% of the range have a green background. The red background is not used when the min value is within 80% of the max value.
| dbms | 256us | 1ms | 4ms | 16ms | 64ms | 256ms | 1s | 4s | 16s | gt | max |
|---|---|---|---|---|---|---|---|---|---|---|---|
| pg1119_def.cx7_gcp_c2s60_4g | 0.008 | 99.450 | 0.542 | 0.101 | |||||||
| pg1119_o3_native_lto.cx7_gcp_c2s60_4g | 0.011 | 98.931 | 1.058 | 0.123 |
Performance metrics for the DBMS listed above. Some are normalized by throughput, others are not. Legend for results is here.
ips	qps	rps	rmbps	wps	wmbps	rpq	rkbpq	wpi	wkbpi	csps	cpups	cspq	cpupq	dbgb1	dbgb2	rss	maxop	p50	p99	tag
1976	103244	82553	715.9	6270.7	73.8	0.800	7.100	3.174	38.255	474950	39.5	4.600	115	166.6	263.0	0.0	0.023	5194	4683	400m.pg1119_def.cx7_gcp_c2s60_4g
1976	109038	76296	734.4	6276.4	74.4	0.700	6.897	3.177	38.566	495053	40.3	4.540	111	166.6	262.7	0.0	0.060	5580	4923	400m.pg1119_o3_native_lto.cx7_gcp_c2s60_4g
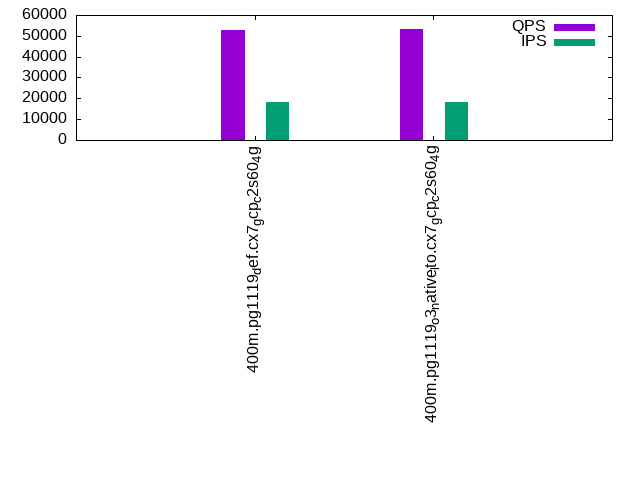
q500.1
q500.1: range queries with 500 insert/s per client. Graphs for performance per 1-second interval are here.
Average throughput:
Query response time histogram: each cell has the percentage of responses that take <= the time in the header and max is the max response time in seconds. For max values in the top 25% of the range have a red background and in the bottom 25% of the range have a green background. The red background is not used when the min value is within 80% of the max value.
| dbms | 256us | 1ms | 4ms | 16ms | 64ms | 256ms | 1s | 4s | 16s | gt | max |
|---|---|---|---|---|---|---|---|---|---|---|---|
| pg1119_def.cx7_gcp_c2s60_4g | 60.970 | 37.684 | 1.215 | 0.125 | 0.006 | nonzero | 0.110 | ||||
| pg1119_o3_native_lto.cx7_gcp_c2s60_4g | 60.551 | 38.066 | 1.254 | 0.123 | 0.006 | 0.056 |
Insert response time histogram: each cell has the percentage of responses that take <= the time in the header and max is the max response time in seconds. For max values in the top 25% of the range have a red background and in the bottom 25% of the range have a green background. The red background is not used when the min value is within 80% of the max value.
| dbms | 256us | 1ms | 4ms | 16ms | 64ms | 256ms | 1s | 4s | 16s | gt | max |
|---|---|---|---|---|---|---|---|---|---|---|---|
| pg1119_def.cx7_gcp_c2s60_4g | 0.002 | 91.782 | 8.216 | nonzero | 0.265 | ||||||
| pg1119_o3_native_lto.cx7_gcp_c2s60_4g | 0.002 | 92.072 | 7.926 | 0.244 |
Performance metrics for the DBMS listed above. Some are normalized by throughput, others are not. Legend for results is here.
ips	qps	rps	rmbps	wps	wmbps	rpq	rkbpq	wpi	wkbpi	csps	cpups	cspq	cpupq	dbgb1	dbgb2	rss	maxop	p50	p99	tag
9885	77728	89264	864.2	29390.5	306.0	1.148	11.385	2.973	31.696	415372	38.5	5.344	149	171.6	247.1	0.0	0.110	4139	1982	400m.pg1119_def.cx7_gcp_c2s60_4g
9890	77910	93006	876.1	29470.3	306.4	1.194	11.514	2.980	31.728	418763	37.5	5.375	144	171.6	246.9	0.0	0.056	4109	2030	400m.pg1119_o3_native_lto.cx7_gcp_c2s60_4g
q1000.1
q1000.1: range queries with 1000 insert/s per client. Graphs for performance per 1-second interval are here.
Average throughput:
Query response time histogram: each cell has the percentage of responses that take <= the time in the header and max is the max response time in seconds. For max values in the top 25% of the range have a red background and in the bottom 25% of the range have a green background. The red background is not used when the min value is within 80% of the max value.
| dbms | 256us | 1ms | 4ms | 16ms | 64ms | 256ms | 1s | 4s | 16s | gt | max |
|---|---|---|---|---|---|---|---|---|---|---|---|
| pg1119_def.cx7_gcp_c2s60_4g | 53.728 | 42.403 | 3.284 | 0.548 | 0.038 | nonzero | 0.085 | ||||
| pg1119_o3_native_lto.cx7_gcp_c2s60_4g | 54.014 | 42.158 | 3.247 | 0.542 | 0.037 | nonzero | 0.082 |
Insert response time histogram: each cell has the percentage of responses that take <= the time in the header and max is the max response time in seconds. For max values in the top 25% of the range have a red background and in the bottom 25% of the range have a green background. The red background is not used when the min value is within 80% of the max value.
| dbms | 256us | 1ms | 4ms | 16ms | 64ms | 256ms | 1s | 4s | 16s | gt | max |
|---|---|---|---|---|---|---|---|---|---|---|---|
| pg1119_def.cx7_gcp_c2s60_4g | 0.003 | 82.715 | 17.280 | 0.001 | 0.282 | ||||||
| pg1119_o3_native_lto.cx7_gcp_c2s60_4g | 0.004 | 82.769 | 17.226 | 0.001 | 0.276 |
Performance metrics for the DBMS listed above. Some are normalized by throughput, others are not. Legend for results is here.
ips	qps	rps	rmbps	wps	wmbps	rpq	rkbpq	wpi	wkbpi	csps	cpups	cspq	cpupq	dbgb1	dbgb2	rss	maxop	p50	p99	tag
18027	52847	95729	935.7	52046.5	528.5	1.811	18.131	2.887	30.022	363340	37.9	6.875	215	185.4	262.2	0.0	0.085	2749	1502	400m.pg1119_def.cx7_gcp_c2s60_4g
18036	53513	95405	933.1	51992.9	528.2	1.783	17.855	2.883	29.987	366499	37.4	6.849	210	185.4	262.1	0.0	0.082	2797	1455	400m.pg1119_o3_native_lto.cx7_gcp_c2s60_4g
l.i0
l.i0: load without secondary indexes
Performance metrics for all DBMS, not just the ones listed above. Some are normalized by throughput, others are not. Legend for results is here.
ips	qps	rps	rmbps	wps	wmbps	rpq	rkbpq	wpi	wkbpi	csps	cpups	cspq	cpupq	dbgb1	dbgb2	rss	maxop	p50	p99	tag
1388889	0	70	3.6	9893.9	580.5	0.000	0.003	0.007	0.428	206614	60.5	0.149	13	38.3	103.2	NA	0.997	78649	9489	400m.pg1119_def.cx7_gcp_c2s60_4g
1428571	0	54	3.2	10074.9	594.0	0.000	0.002	0.007	0.426	224502	59.8	0.157	13	38.3	103.2	NA	0.450	81410	14384	400m.pg1119_o3_native_lto.cx7_gcp_c2s60_4g
l.x
l.x: create secondary indexes
Performance metrics for all DBMS, not just the ones listed above. Some are normalized by throughput, others are not. Legend for results is here.
ips	qps	rps	rmbps	wps	wmbps	rpq	rkbpq	wpi	wkbpi	csps	cpups	cspq	cpupq	dbgb1	dbgb2	rss	maxop	p50	p99	tag
1835321	0	8107	253.0	6367.1	754.1	0.004	0.141	0.003	0.421	140270	21.4	0.076	3	73.5	177.9	NA	0.191	NA	NA	400m.pg1119_def.cx7_gcp_c2s60_4g
1961274	0	13878	269.4	5385.8	760.2	0.007	0.141	0.003	0.397	125614	21.6	0.064	3	73.5	176.1	NA	0.454	NA	NA	400m.pg1119_o3_native_lto.cx7_gcp_c2s60_4g
l.i1
l.i1: continue load after secondary indexes created
Performance metrics for all DBMS, not just the ones listed above. Some are normalized by throughput, others are not. Legend for results is here.
ips	qps	rps	rmbps	wps	wmbps	rpq	rkbpq	wpi	wkbpi	csps	cpups	cspq	cpupq	dbgb1	dbgb2	rss	maxop	p50	p99	tag
23072	0	70133	725.0	62774.9	606.4	3.040	32.179	2.721	26.912	132833	12.3	5.757	160	165.8	246.8	NA	0.438	1199	599	400m.pg1119_def.cx7_gcp_c2s60_4g
23049	0	70546	728.7	62723.6	605.9	3.061	32.373	2.721	26.917	133167	12.1	5.777	157	165.8	246.1	0.0	0.368	1199	599	400m.pg1119_o3_native_lto.cx7_gcp_c2s60_4g
q100.1
q100.1: range queries with 100 insert/s per client
Performance metrics for all DBMS, not just the ones listed above. Some are normalized by throughput, others are not. Legend for results is here.
ips	qps	rps	rmbps	wps	wmbps	rpq	rkbpq	wpi	wkbpi	csps	cpups	cspq	cpupq	dbgb1	dbgb2	rss	maxop	p50	p99	tag
1976	103244	82553	715.9	6270.7	73.8	0.800	7.100	3.174	38.255	474950	39.5	4.600	115	166.6	263.0	0.0	0.023	5194	4683	400m.pg1119_def.cx7_gcp_c2s60_4g
1976	109038	76296	734.4	6276.4	74.4	0.700	6.897	3.177	38.566	495053	40.3	4.540	111	166.6	262.7	0.0	0.060	5580	4923	400m.pg1119_o3_native_lto.cx7_gcp_c2s60_4g
q500.1
q500.1: range queries with 500 insert/s per client
Performance metrics for all DBMS, not just the ones listed above. Some are normalized by throughput, others are not. Legend for results is here.
ips	qps	rps	rmbps	wps	wmbps	rpq	rkbpq	wpi	wkbpi	csps	cpups	cspq	cpupq	dbgb1	dbgb2	rss	maxop	p50	p99	tag
9885	77728	89264	864.2	29390.5	306.0	1.148	11.385	2.973	31.696	415372	38.5	5.344	149	171.6	247.1	0.0	0.110	4139	1982	400m.pg1119_def.cx7_gcp_c2s60_4g
9890	77910	93006	876.1	29470.3	306.4	1.194	11.514	2.980	31.728	418763	37.5	5.375	144	171.6	246.9	0.0	0.056	4109	2030	400m.pg1119_o3_native_lto.cx7_gcp_c2s60_4g
q1000.1
q1000.1: range queries with 1000 insert/s per client
Performance metrics for all DBMS, not just the ones listed above. Some are normalized by throughput, others are not. Legend for results is here.
ips	qps	rps	rmbps	wps	wmbps	rpq	rkbpq	wpi	wkbpi	csps	cpups	cspq	cpupq	dbgb1	dbgb2	rss	maxop	p50	p99	tag
18027	52847	95729	935.7	52046.5	528.5	1.811	18.131	2.887	30.022	363340	37.9	6.875	215	185.4	262.2	0.0	0.085	2749	1502	400m.pg1119_def.cx7_gcp_c2s60_4g
18036	53513	95405	933.1	51992.9	528.2	1.783	17.855	2.883	29.987	366499	37.4	6.849	210	185.4	262.1	0.0	0.082	2797	1455	400m.pg1119_o3_native_lto.cx7_gcp_c2s60_4g
l.i0
- l.i0: load without secondary indexes
- Legend for results is here.
- Each entry lists the percentage of responses that fit in that bucket (slower than max time for previous bucket, faster than min time for next bucket).
Insert response time histogram
256us	1ms	4ms	16ms	64ms	256ms	1s	4s	16s	gt	max	tag
0.000	63.456	35.412	1.047	0.049	0.026	0.010	0.000	0.000	0.000	0.997	pg1119_def.cx7_gcp_c2s60_4g
0.000	63.091	35.848	0.970	0.046	0.034	0.011	0.000	0.000	0.000	0.450	pg1119_o3_native_lto.cx7_gcp_c2s60_4g
l.x
- l.x: create secondary indexes
- Legend for results is here.
- Each entry lists the percentage of responses that fit in that bucket (slower than max time for previous bucket, faster than min time for next bucket).
TODO - determine whether there is data for create index response time
l.i1
- l.i1: continue load after secondary indexes created
- Legend for results is here.
- Each entry lists the percentage of responses that fit in that bucket (slower than max time for previous bucket, faster than min time for next bucket).
Insert response time histogram
256us	1ms	4ms	16ms	64ms	256ms	1s	4s	16s	gt	max	tag
0.000	0.000	nonzero	0.032	88.386	11.580	0.003	0.000	0.000	0.000	0.438	pg1119_def.cx7_gcp_c2s60_4g
0.000	0.000	0.000	0.014	88.351	11.631	0.004	0.000	0.000	0.000	0.368	pg1119_o3_native_lto.cx7_gcp_c2s60_4g
q100.1
- q100.1: range queries with 100 insert/s per client
- Legend for results is here.
- Each entry lists the percentage of responses that fit in that bucket (slower than max time for previous bucket, faster than min time for next bucket).
Query response time histogram
256us	1ms	4ms	16ms	64ms	256ms	1s	4s	16s	gt	max	tag
67.656	32.154	0.184	0.006	nonzero	0.000	0.000	0.000	0.000	0.000	0.023	pg1119_def.cx7_gcp_c2s60_4g
69.977	29.838	0.179	0.006	nonzero	0.000	0.000	0.000	0.000	0.000	0.060	pg1119_o3_native_lto.cx7_gcp_c2s60_4g
Insert response time histogram
256us	1ms	4ms	16ms	64ms	256ms	1s	4s	16s	gt	max	tag
0.000	0.000	0.000	0.008	99.450	0.542	0.000	0.000	0.000	0.000	0.101	pg1119_def.cx7_gcp_c2s60_4g
0.000	0.000	0.000	0.011	98.931	1.058	0.000	0.000	0.000	0.000	0.123	pg1119_o3_native_lto.cx7_gcp_c2s60_4g
q500.1
- q500.1: range queries with 500 insert/s per client
- Legend for results is here.
- Each entry lists the percentage of responses that fit in that bucket (slower than max time for previous bucket, faster than min time for next bucket).
Query response time histogram
256us	1ms	4ms	16ms	64ms	256ms	1s	4s	16s	gt	max	tag
60.970	37.684	1.215	0.125	0.006	nonzero	0.000	0.000	0.000	0.000	0.110	pg1119_def.cx7_gcp_c2s60_4g
60.551	38.066	1.254	0.123	0.006	0.000	0.000	0.000	0.000	0.000	0.056	pg1119_o3_native_lto.cx7_gcp_c2s60_4g
Insert response time histogram
256us	1ms	4ms	16ms	64ms	256ms	1s	4s	16s	gt	max	tag
0.000	0.000	0.000	0.002	91.782	8.216	nonzero	0.000	0.000	0.000	0.265	pg1119_def.cx7_gcp_c2s60_4g
0.000	0.000	0.000	0.002	92.072	7.926	0.000	0.000	0.000	0.000	0.244	pg1119_o3_native_lto.cx7_gcp_c2s60_4g
q1000.1
- q1000.1: range queries with 1000 insert/s per client
- Legend for results is here.
- Each entry lists the percentage of responses that fit in that bucket (slower than max time for previous bucket, faster than min time for next bucket).
Query response time histogram
256us	1ms	4ms	16ms	64ms	256ms	1s	4s	16s	gt	max	tag
53.728	42.403	3.284	0.548	0.038	nonzero	0.000	0.000	0.000	0.000	0.085	pg1119_def.cx7_gcp_c2s60_4g
54.014	42.158	3.247	0.542	0.037	nonzero	0.000	0.000	0.000	0.000	0.082	pg1119_o3_native_lto.cx7_gcp_c2s60_4g
Insert response time histogram
256us	1ms	4ms	16ms	64ms	256ms	1s	4s	16s	gt	max	tag
0.000	0.000	0.000	0.003	82.715	17.280	0.001	0.000	0.000	0.000	0.282	pg1119_def.cx7_gcp_c2s60_4g
0.000	0.000	0.000	0.004	82.769	17.226	0.001	0.000	0.000	0.000	0.276	pg1119_o3_native_lto.cx7_gcp_c2s60_4g