Introduction
This is a report for the insert benchmark with 50M docs and 4 client(s). It is generated by scripts (bash, awk, sed) and Tufte might not be impressed. An overview of the insert benchmark is here and a short update is here. Below, by DBMS, I mean DBMS+version.config. An example is my8020.c10b40 where my means MySQL, 8020 is version 8.0.20 and c10b40 is the name for the configuration file.
The test server is an c6i.4xl with 8 cores, 8 HW threads (hyperthread disabled), 32G RAM and io2 storage (1T, 32K IOPs). The benchmark was run with 4 clients and there was 1 or 2 connections per client (1 for queries, 1 for inserts). The benchmark loads 25M rows without secondary indexes, creates secondary indexes, loads another 25M rows then does 3 read+write tests for one hour each that do queries as fast as possible with 100, 500 and then 1000 writes/second/client concurrent with the queries. The database is cached by the storage engine and the only IO is for writes. Clients and the DBMS share one server. The per-database configs are in the per-database subdirectories here.
The tested DBMS are:
- my8031.cy8_c16r32_32kio - MySQL 8.0.31 with InnoDB and the cy8_c16r32_32kio config
- fbmy8028.cy9c_c16r32_32kio - FB MySQL 8.0.28 with MyRocks and the cy9c_c16r32_32kio config
- pg151.cx7_c16r32_32kio - Postgres 15.1 and the cx7_c16r32_32kio config
Contents
- Summary
- l.i0: load without secondary indexes
- l.x: create secondary indexes
- l.i1: continue load after secondary indexes created
- q100.1: range queries with 100 insert/s per client
- q500.1: range queries with 500 insert/s per client
- q1000.1: range queries with 1000 insert/s per client
Summary
The numbers are inserts/s for l.i0 and l.i1, indexed docs (or rows) /s for l.x and queries/s for q*.2. The values are the average rate over the entire test for inserts (IPS) and queries (QPS). The range of values for IPS and QPS is split into 3 parts: bottom 25%, middle 50%, top 25%. Values in the bottom 25% have a red background, values in the top 25% have a green background and values in the middle have no color. A gray background is used for values that can be ignored because the DBMS did not sustain the target insert rate. Red backgrounds are not used when the minimum value is within 80% of the max value.
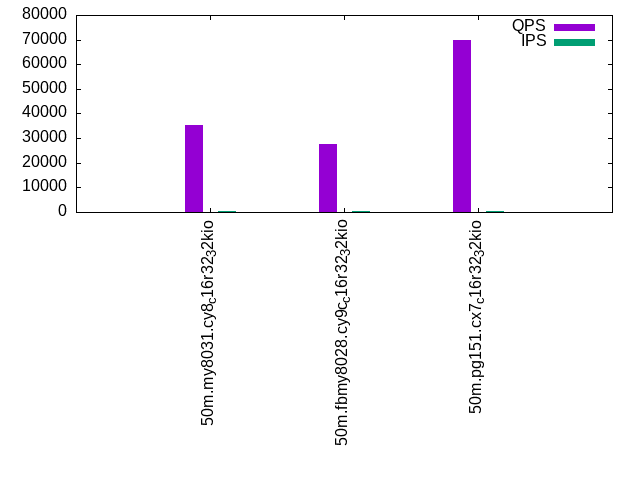
| dbms | l.i0 | l.x | l.i1 | q100.1 | q500.1 | q1000.1 |
|---|---|---|---|---|---|---|
| 50m.my8031.cy8_c16r32_32kio | 373134 | 302410 | 151515 | 35396 | 35065 | 34601 |
| 50m.fbmy8028.cy9c_c16r32_32kio | 308642 | 380303 | 155280 | 27738 | 27554 | 27254 |
| 50m.pg151.cx7_c16r32_32kio | 462963 | 1321053 | 189394 | 70049 | 69632 | 69440 |
This lists the average rate of inserts/s for the tests that do inserts concurrent with queries. For such tests the query rate is listed in the table above. The read+write tests are setup so that the insert rate should match the target rate every second. Cells that are not at least 95% of the target have a red background to indicate a failure to satisfy the target.
| dbms | q100.1 | q500.1 | q1000.1 |
|---|---|---|---|
| my8031.cy8_c16r32_32kio | 399 | 1996 | 3992 |
| fbmy8028.cy9c_c16r32_32kio | 399 | 1996 | 3991 |
| pg151.cx7_c16r32_32kio | 399 | 1996 | 3991 |
| target | 400 | 2000 | 4000 |
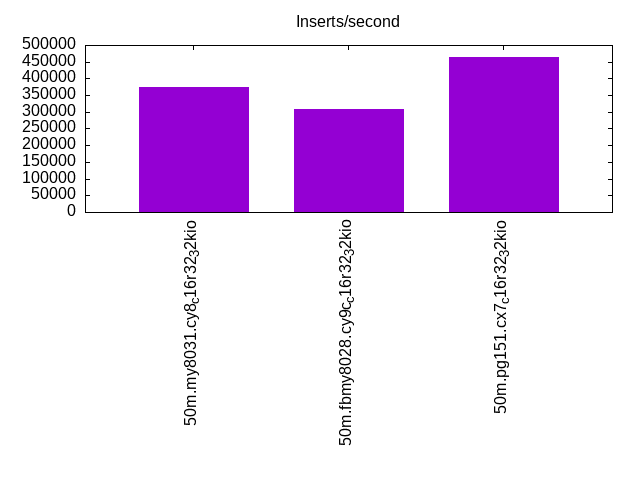
l.i0
l.i0: load without secondary indexes. Graphs for performance per 1-second interval are here.
Average throughput:
Insert response time histogram: each cell has the percentage of responses that take <= the time in the header and max is the max response time in seconds. For the max column values in the top 25% of the range have a red background and in the bottom 25% of the range have a green background. The red background is not used when the min value is within 80% of the max value.
| dbms | 256us | 1ms | 4ms | 16ms | 64ms | 256ms | 1s | 4s | 16s | gt | max |
|---|---|---|---|---|---|---|---|---|---|---|---|
| my8031.cy8_c16r32_32kio | 94.723 | 5.090 | 0.162 | 0.026 | 0.063 | ||||||
| fbmy8028.cy9c_c16r32_32kio | 39.001 | 60.861 | 0.122 | 0.012 | 0.003 | 0.107 | |||||
| pg151.cx7_c16r32_32kio | 99.392 | 0.605 | 0.004 | 0.006 |
Performance metrics for the DBMS listed above. Some are normalized by throughput, others are not. Legend for results is here.
ips	qps	rps	rmbps	wps	wmbps	rpq	rkbpq	wpi	wkbpi	csps	cpups	cspq	cpupq	dbgb1	dbgb2	rss	maxop	p50	p99	tag
373134	0	0	0.0	513.2	95.7	0.000	0.000	0.001	0.263	60003	69.1	0.161	15	1.7	66.2	4.0	0.063	117973	81213	50m.my8031.cy8_c16r32_32kio
308642	0	0	0.0	417.7	93.4	0.000	0.000	0.001	0.310	30820	59.8	0.100	16	0.8	2.3	0.9	0.107	88630	18280	50m.fbmy8028.cy9c_c16r32_32kio
462963	0	0	0.0	866.2	198.6	0.000	0.000	0.002	0.439	51122	61.5	0.110	11	2.4	6.5	0.0	0.006	152337	92301	50m.pg151.cx7_c16r32_32kio
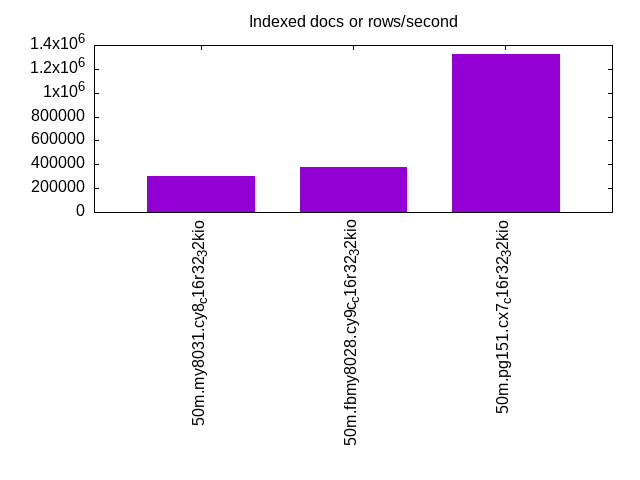
l.x
l.x: create secondary indexes.
Average throughput:
Performance metrics for the DBMS listed above. Some are normalized by throughput, others are not. Legend for results is here.
ips	qps	rps	rmbps	wps	wmbps	rpq	rkbpq	wpi	wkbpi	csps	cpups	cspq	cpupq	dbgb1	dbgb2	rss	maxop	p50	p99	tag
302410	0	1650	108.5	6057.2	295.7	0.005	0.367	0.020	1.001	29381	30.6	0.097	8	3.7	68.3	5.5	0.015	NA	NA	50m.my8031.cy8_c16r32_32kio
380303	0	1	0.0	265.0	60.4	0.000	0.000	0.001	0.163	1158	45.9	0.003	10	1.7	3.2	2.6	0.002	NA	NA	50m.fbmy8028.cy9c_c16r32_32kio
1321053	0	0	0.0	1237.5	302.4	0.000	0.000	0.001	0.234	4642	37.8	0.004	2	4.6	10.7	0.0	0.002	NA	NA	50m.pg151.cx7_c16r32_32kio
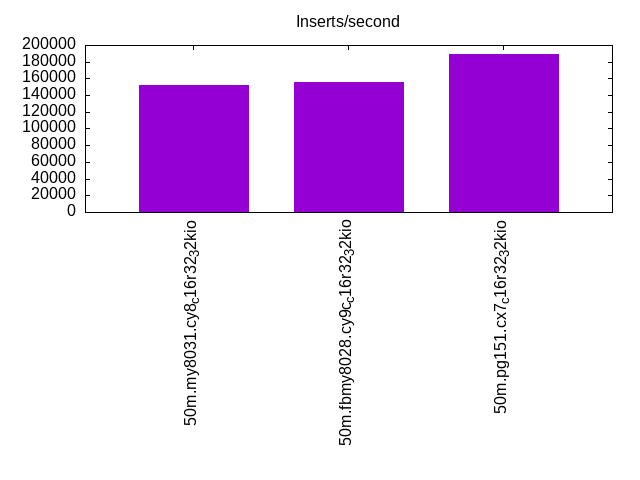
l.i1
l.i1: continue load after secondary indexes created. Graphs for performance per 1-second interval are here.
Average throughput:
Insert response time histogram: each cell has the percentage of responses that take <= the time in the header and max is the max response time in seconds. For the max column values in the top 25% of the range have a red background and in the bottom 25% of the range have a green background. The red background is not used when the min value is within 80% of the max value.
| dbms | 256us | 1ms | 4ms | 16ms | 64ms | 256ms | 1s | 4s | 16s | gt | max |
|---|---|---|---|---|---|---|---|---|---|---|---|
| my8031.cy8_c16r32_32kio | 0.001 | 99.495 | 0.372 | 0.117 | 0.015 | 0.117 | |||||
| fbmy8028.cy9c_c16r32_32kio | 10.129 | 89.579 | 0.282 | 0.008 | nonzero | 0.065 | |||||
| pg151.cx7_c16r32_32kio | 63.616 | 36.380 | 0.003 | 0.008 |
Performance metrics for the DBMS listed above. Some are normalized by throughput, others are not. Legend for results is here.
ips	qps	rps	rmbps	wps	wmbps	rpq	rkbpq	wpi	wkbpi	csps	cpups	cspq	cpupq	dbgb1	dbgb2	rss	maxop	p50	p99	tag
151515	0	694	10.8	1454.8	130.4	0.005	0.073	0.010	0.881	59986	65.8	0.396	35	9.9	74.5	11.3	0.117	41605	899	50m.my8031.cy8_c16r32_32kio
155280	0	47	5.8	667.8	151.4	0.000	0.038	0.004	0.998	34465	71.3	0.222	37	4.6	5.5	3.3	0.065	41267	19529	50m.fbmy8028.cy9c_c16r32_32kio
189394	0	0	0.0	885.9	202.8	0.000	0.000	0.005	1.097	42821	58.8	0.226	25	9.9	26.4	0.0	0.008	49547	16682	50m.pg151.cx7_c16r32_32kio
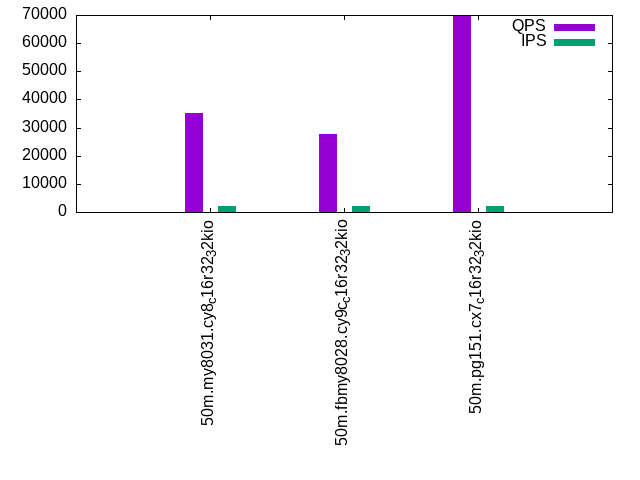
q100.1
q100.1: range queries with 100 insert/s per client. Graphs for performance per 1-second interval are here.
Average throughput:
Query response time histogram: each cell has the percentage of responses that take <= the time in the header and max is the max response time in seconds. For max values in the top 25% of the range have a red background and in the bottom 25% of the range have a green background. The red background is not used when the min value is within 80% of the max value.
| dbms | 256us | 1ms | 4ms | 16ms | 64ms | 256ms | 1s | 4s | 16s | gt | max |
|---|---|---|---|---|---|---|---|---|---|---|---|
| my8031.cy8_c16r32_32kio | 99.989 | 0.010 | 0.001 | nonzero | 0.011 | ||||||
| fbmy8028.cy9c_c16r32_32kio | 99.971 | 0.028 | 0.001 | nonzero | nonzero | 0.020 | |||||
| pg151.cx7_c16r32_32kio | 99.996 | 0.003 | 0.001 | nonzero | 0.006 |
Insert response time histogram: each cell has the percentage of responses that take <= the time in the header and max is the max response time in seconds. For max values in the top 25% of the range have a red background and in the bottom 25% of the range have a green background. The red background is not used when the min value is within 80% of the max value.
| dbms | 256us | 1ms | 4ms | 16ms | 64ms | 256ms | 1s | 4s | 16s | gt | max |
|---|---|---|---|---|---|---|---|---|---|---|---|
| my8031.cy8_c16r32_32kio | 99.281 | 0.719 | 0.010 | ||||||||
| fbmy8028.cy9c_c16r32_32kio | 10.042 | 89.955 | 0.003 | 0.006 | |||||||
| pg151.cx7_c16r32_32kio | 99.976 | 0.024 | 0.005 |
Performance metrics for the DBMS listed above. Some are normalized by throughput, others are not. Legend for results is here.
ips	qps	rps	rmbps	wps	wmbps	rpq	rkbpq	wpi	wkbpi	csps	cpups	cspq	cpupq	dbgb1	dbgb2	rss	maxop	p50	p99	tag
399	35396	0	0.0	126.7	3.4	0.000	0.000	0.317	8.625	136213	48.7	3.848	110	10.7	75.3	12.0	0.011	8870	8551	50m.my8031.cy8_c16r32_32kio
399	27738	0	0.0	7.5	1.1	0.000	0.000	0.019	2.791	106277	49.7	3.831	143	3.7	4.7	6.2	0.020	6921	6505	50m.fbmy8028.cy9c_c16r32_32kio
399	70049	0	0.0	475.5	15.0	0.000	0.000	1.192	38.473	267809	46.6	3.823	53	10.4	24.9	0.0	0.006	17682	17006	50m.pg151.cx7_c16r32_32kio
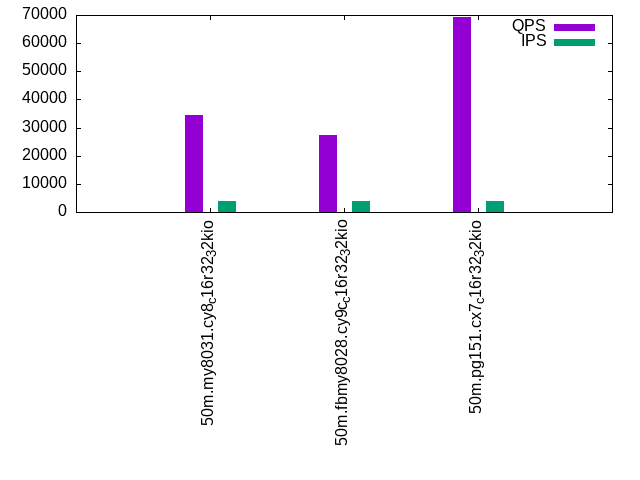
q500.1
q500.1: range queries with 500 insert/s per client. Graphs for performance per 1-second interval are here.
Average throughput:
Query response time histogram: each cell has the percentage of responses that take <= the time in the header and max is the max response time in seconds. For max values in the top 25% of the range have a red background and in the bottom 25% of the range have a green background. The red background is not used when the min value is within 80% of the max value.
| dbms | 256us | 1ms | 4ms | 16ms | 64ms | 256ms | 1s | 4s | 16s | gt | max |
|---|---|---|---|---|---|---|---|---|---|---|---|
| my8031.cy8_c16r32_32kio | 99.981 | 0.014 | 0.005 | nonzero | 0.009 | ||||||
| fbmy8028.cy9c_c16r32_32kio | 99.941 | 0.054 | 0.005 | nonzero | nonzero | 0.025 | |||||
| pg151.cx7_c16r32_32kio | 99.980 | 0.010 | 0.010 | nonzero | 0.009 |
Insert response time histogram: each cell has the percentage of responses that take <= the time in the header and max is the max response time in seconds. For max values in the top 25% of the range have a red background and in the bottom 25% of the range have a green background. The red background is not used when the min value is within 80% of the max value.
| dbms | 256us | 1ms | 4ms | 16ms | 64ms | 256ms | 1s | 4s | 16s | gt | max |
|---|---|---|---|---|---|---|---|---|---|---|---|
| my8031.cy8_c16r32_32kio | 98.856 | 1.144 | 0.001 | 0.023 | |||||||
| fbmy8028.cy9c_c16r32_32kio | 23.371 | 76.449 | 0.178 | 0.002 | 0.021 | ||||||
| pg151.cx7_c16r32_32kio | 1.351 | 98.303 | 0.346 | 0.013 |
Performance metrics for the DBMS listed above. Some are normalized by throughput, others are not. Legend for results is here.
ips	qps	rps	rmbps	wps	wmbps	rpq	rkbpq	wpi	wkbpi	csps	cpups	cspq	cpupq	dbgb1	dbgb2	rss	maxop	p50	p99	tag
1996	35065	0	0.0	26.2	1.5	0.000	0.000	0.013	0.781	134524	49.3	3.836	112	12.1	76.7	13.3	0.009	8791	8663	50m.my8031.cy8_c16r32_32kio
1996	27554	0	0.0	17.1	3.3	0.000	0.000	0.009	1.675	105524	50.6	3.830	147	4.1	6.1	14.2	0.025	6843	6219	50m.fbmy8028.cy9c_c16r32_32kio
1996	69632	0	0.0	640.1	30.2	0.000	0.000	0.321	15.522	266162	47.1	3.822	54	13.2	23.1	0.0	0.009	17326	17085	50m.pg151.cx7_c16r32_32kio
q1000.1
q1000.1: range queries with 1000 insert/s per client. Graphs for performance per 1-second interval are here.
Average throughput:
Query response time histogram: each cell has the percentage of responses that take <= the time in the header and max is the max response time in seconds. For max values in the top 25% of the range have a red background and in the bottom 25% of the range have a green background. The red background is not used when the min value is within 80% of the max value.
| dbms | 256us | 1ms | 4ms | 16ms | 64ms | 256ms | 1s | 4s | 16s | gt | max |
|---|---|---|---|---|---|---|---|---|---|---|---|
| my8031.cy8_c16r32_32kio | 99.973 | 0.021 | 0.006 | nonzero | 0.015 | ||||||
| fbmy8028.cy9c_c16r32_32kio | 99.912 | 0.080 | 0.008 | nonzero | nonzero | 0.028 | |||||
| pg151.cx7_c16r32_32kio | 99.960 | 0.023 | 0.016 | nonzero | 0.012 |
Insert response time histogram: each cell has the percentage of responses that take <= the time in the header and max is the max response time in seconds. For max values in the top 25% of the range have a red background and in the bottom 25% of the range have a green background. The red background is not used when the min value is within 80% of the max value.
| dbms | 256us | 1ms | 4ms | 16ms | 64ms | 256ms | 1s | 4s | 16s | gt | max |
|---|---|---|---|---|---|---|---|---|---|---|---|
| my8031.cy8_c16r32_32kio | 99.171 | 0.824 | 0.005 | 0.030 | |||||||
| fbmy8028.cy9c_c16r32_32kio | 24.122 | 75.406 | 0.466 | 0.006 | 0.025 | ||||||
| pg151.cx7_c16r32_32kio | 11.890 | 87.452 | 0.657 | 0.001 | 0.017 |
Performance metrics for the DBMS listed above. Some are normalized by throughput, others are not. Legend for results is here.
ips	qps	rps	rmbps	wps	wmbps	rpq	rkbpq	wpi	wkbpi	csps	cpups	cspq	cpupq	dbgb1	dbgb2	rss	maxop	p50	p99	tag
3992	34601	0	0.0	186.6	6.0	0.000	0.000	0.047	1.550	132956	50.0	3.843	116	13.2	77.8	14.3	0.015	8668	8519	50m.my8031.cy8_c16r32_32kio
3991	27254	1	0.1	31.6	6.5	0.000	0.005	0.008	1.680	104287	51.7	3.826	152	5.2	7.0	21.2	0.028	6841	6185	50m.fbmy8028.cy9c_c16r32_32kio
3991	69440	0	0.0	689.4	42.8	0.000	0.000	0.173	10.985	264944	47.8	3.815	55	15.5	28.0	0.0	0.012	17309	16654	50m.pg151.cx7_c16r32_32kio
l.i0
l.i0: load without secondary indexes
Performance metrics for all DBMS, not just the ones listed above. Some are normalized by throughput, others are not. Legend for results is here.
ips	qps	rps	rmbps	wps	wmbps	rpq	rkbpq	wpi	wkbpi	csps	cpups	cspq	cpupq	dbgb1	dbgb2	rss	maxop	p50	p99	tag
373134	0	0	0.0	513.2	95.7	0.000	0.000	0.001	0.263	60003	69.1	0.161	15	1.7	66.2	4.0	0.063	117973	81213	50m.my8031.cy8_c16r32_32kio
308642	0	0	0.0	417.7	93.4	0.000	0.000	0.001	0.310	30820	59.8	0.100	16	0.8	2.3	0.9	0.107	88630	18280	50m.fbmy8028.cy9c_c16r32_32kio
462963	0	0	0.0	866.2	198.6	0.000	0.000	0.002	0.439	51122	61.5	0.110	11	2.4	6.5	0.0	0.006	152337	92301	50m.pg151.cx7_c16r32_32kio
l.x
l.x: create secondary indexes
Performance metrics for all DBMS, not just the ones listed above. Some are normalized by throughput, others are not. Legend for results is here.
ips	qps	rps	rmbps	wps	wmbps	rpq	rkbpq	wpi	wkbpi	csps	cpups	cspq	cpupq	dbgb1	dbgb2	rss	maxop	p50	p99	tag
302410	0	1650	108.5	6057.2	295.7	0.005	0.367	0.020	1.001	29381	30.6	0.097	8	3.7	68.3	5.5	0.015	NA	NA	50m.my8031.cy8_c16r32_32kio
380303	0	1	0.0	265.0	60.4	0.000	0.000	0.001	0.163	1158	45.9	0.003	10	1.7	3.2	2.6	0.002	NA	NA	50m.fbmy8028.cy9c_c16r32_32kio
1321053	0	0	0.0	1237.5	302.4	0.000	0.000	0.001	0.234	4642	37.8	0.004	2	4.6	10.7	0.0	0.002	NA	NA	50m.pg151.cx7_c16r32_32kio
l.i1
l.i1: continue load after secondary indexes created
Performance metrics for all DBMS, not just the ones listed above. Some are normalized by throughput, others are not. Legend for results is here.
ips	qps	rps	rmbps	wps	wmbps	rpq	rkbpq	wpi	wkbpi	csps	cpups	cspq	cpupq	dbgb1	dbgb2	rss	maxop	p50	p99	tag
151515	0	694	10.8	1454.8	130.4	0.005	0.073	0.010	0.881	59986	65.8	0.396	35	9.9	74.5	11.3	0.117	41605	899	50m.my8031.cy8_c16r32_32kio
155280	0	47	5.8	667.8	151.4	0.000	0.038	0.004	0.998	34465	71.3	0.222	37	4.6	5.5	3.3	0.065	41267	19529	50m.fbmy8028.cy9c_c16r32_32kio
189394	0	0	0.0	885.9	202.8	0.000	0.000	0.005	1.097	42821	58.8	0.226	25	9.9	26.4	0.0	0.008	49547	16682	50m.pg151.cx7_c16r32_32kio
q100.1
q100.1: range queries with 100 insert/s per client
Performance metrics for all DBMS, not just the ones listed above. Some are normalized by throughput, others are not. Legend for results is here.
ips	qps	rps	rmbps	wps	wmbps	rpq	rkbpq	wpi	wkbpi	csps	cpups	cspq	cpupq	dbgb1	dbgb2	rss	maxop	p50	p99	tag
399	35396	0	0.0	126.7	3.4	0.000	0.000	0.317	8.625	136213	48.7	3.848	110	10.7	75.3	12.0	0.011	8870	8551	50m.my8031.cy8_c16r32_32kio
399	27738	0	0.0	7.5	1.1	0.000	0.000	0.019	2.791	106277	49.7	3.831	143	3.7	4.7	6.2	0.020	6921	6505	50m.fbmy8028.cy9c_c16r32_32kio
399	70049	0	0.0	475.5	15.0	0.000	0.000	1.192	38.473	267809	46.6	3.823	53	10.4	24.9	0.0	0.006	17682	17006	50m.pg151.cx7_c16r32_32kio
q500.1
q500.1: range queries with 500 insert/s per client
Performance metrics for all DBMS, not just the ones listed above. Some are normalized by throughput, others are not. Legend for results is here.
ips	qps	rps	rmbps	wps	wmbps	rpq	rkbpq	wpi	wkbpi	csps	cpups	cspq	cpupq	dbgb1	dbgb2	rss	maxop	p50	p99	tag
1996	35065	0	0.0	26.2	1.5	0.000	0.000	0.013	0.781	134524	49.3	3.836	112	12.1	76.7	13.3	0.009	8791	8663	50m.my8031.cy8_c16r32_32kio
1996	27554	0	0.0	17.1	3.3	0.000	0.000	0.009	1.675	105524	50.6	3.830	147	4.1	6.1	14.2	0.025	6843	6219	50m.fbmy8028.cy9c_c16r32_32kio
1996	69632	0	0.0	640.1	30.2	0.000	0.000	0.321	15.522	266162	47.1	3.822	54	13.2	23.1	0.0	0.009	17326	17085	50m.pg151.cx7_c16r32_32kio
q1000.1
q1000.1: range queries with 1000 insert/s per client
Performance metrics for all DBMS, not just the ones listed above. Some are normalized by throughput, others are not. Legend for results is here.
ips	qps	rps	rmbps	wps	wmbps	rpq	rkbpq	wpi	wkbpi	csps	cpups	cspq	cpupq	dbgb1	dbgb2	rss	maxop	p50	p99	tag
3992	34601	0	0.0	186.6	6.0	0.000	0.000	0.047	1.550	132956	50.0	3.843	116	13.2	77.8	14.3	0.015	8668	8519	50m.my8031.cy8_c16r32_32kio
3991	27254	1	0.1	31.6	6.5	0.000	0.005	0.008	1.680	104287	51.7	3.826	152	5.2	7.0	21.2	0.028	6841	6185	50m.fbmy8028.cy9c_c16r32_32kio
3991	69440	0	0.0	689.4	42.8	0.000	0.000	0.173	10.985	264944	47.8	3.815	55	15.5	28.0	0.0	0.012	17309	16654	50m.pg151.cx7_c16r32_32kio
l.i0
- l.i0: load without secondary indexes
- Legend for results is here.
- Each entry lists the percentage of responses that fit in that bucket (slower than max time for previous bucket, faster than min time for next bucket).
Insert response time histogram
256us	1ms	4ms	16ms	64ms	256ms	1s	4s	16s	gt	max	tag
0.000	94.723	5.090	0.162	0.026	0.000	0.000	0.000	0.000	0.000	0.063	my8031.cy8_c16r32_32kio
0.000	39.001	60.861	0.122	0.012	0.003	0.000	0.000	0.000	0.000	0.107	fbmy8028.cy9c_c16r32_32kio
0.000	99.392	0.605	0.004	0.000	0.000	0.000	0.000	0.000	0.000	0.006	pg151.cx7_c16r32_32kio
l.x
- l.x: create secondary indexes
- Legend for results is here.
- Each entry lists the percentage of responses that fit in that bucket (slower than max time for previous bucket, faster than min time for next bucket).
TODO - determine whether there is data for create index response time
l.i1
- l.i1: continue load after secondary indexes created
- Legend for results is here.
- Each entry lists the percentage of responses that fit in that bucket (slower than max time for previous bucket, faster than min time for next bucket).
Insert response time histogram
256us	1ms	4ms	16ms	64ms	256ms	1s	4s	16s	gt	max	tag
0.000	0.001	99.495	0.372	0.117	0.015	0.000	0.000	0.000	0.000	0.117	my8031.cy8_c16r32_32kio
0.000	10.129	89.579	0.282	0.008	nonzero	0.000	0.000	0.000	0.000	0.065	fbmy8028.cy9c_c16r32_32kio
0.000	63.616	36.380	0.003	0.000	0.000	0.000	0.000	0.000	0.000	0.008	pg151.cx7_c16r32_32kio
q100.1
- q100.1: range queries with 100 insert/s per client
- Legend for results is here.
- Each entry lists the percentage of responses that fit in that bucket (slower than max time for previous bucket, faster than min time for next bucket).
Query response time histogram
256us	1ms	4ms	16ms	64ms	256ms	1s	4s	16s	gt	max	tag
99.989	0.010	0.001	nonzero	0.000	0.000	0.000	0.000	0.000	0.000	0.011	my8031.cy8_c16r32_32kio
99.971	0.028	0.001	nonzero	nonzero	0.000	0.000	0.000	0.000	0.000	0.020	fbmy8028.cy9c_c16r32_32kio
99.996	0.003	0.001	nonzero	0.000	0.000	0.000	0.000	0.000	0.000	0.006	pg151.cx7_c16r32_32kio
Insert response time histogram
256us	1ms	4ms	16ms	64ms	256ms	1s	4s	16s	gt	max	tag
0.000	0.000	99.281	0.719	0.000	0.000	0.000	0.000	0.000	0.000	0.010	my8031.cy8_c16r32_32kio
0.000	10.042	89.955	0.003	0.000	0.000	0.000	0.000	0.000	0.000	0.006	fbmy8028.cy9c_c16r32_32kio
0.000	0.000	99.976	0.024	0.000	0.000	0.000	0.000	0.000	0.000	0.005	pg151.cx7_c16r32_32kio
q500.1
- q500.1: range queries with 500 insert/s per client
- Legend for results is here.
- Each entry lists the percentage of responses that fit in that bucket (slower than max time for previous bucket, faster than min time for next bucket).
Query response time histogram
256us	1ms	4ms	16ms	64ms	256ms	1s	4s	16s	gt	max	tag
99.981	0.014	0.005	nonzero	0.000	0.000	0.000	0.000	0.000	0.000	0.009	my8031.cy8_c16r32_32kio
99.941	0.054	0.005	nonzero	nonzero	0.000	0.000	0.000	0.000	0.000	0.025	fbmy8028.cy9c_c16r32_32kio
99.980	0.010	0.010	nonzero	0.000	0.000	0.000	0.000	0.000	0.000	0.009	pg151.cx7_c16r32_32kio
Insert response time histogram
256us	1ms	4ms	16ms	64ms	256ms	1s	4s	16s	gt	max	tag
0.000	0.000	98.856	1.144	0.001	0.000	0.000	0.000	0.000	0.000	0.023	my8031.cy8_c16r32_32kio
0.000	23.371	76.449	0.178	0.002	0.000	0.000	0.000	0.000	0.000	0.021	fbmy8028.cy9c_c16r32_32kio
0.000	1.351	98.303	0.346	0.000	0.000	0.000	0.000	0.000	0.000	0.013	pg151.cx7_c16r32_32kio
q1000.1
- q1000.1: range queries with 1000 insert/s per client
- Legend for results is here.
- Each entry lists the percentage of responses that fit in that bucket (slower than max time for previous bucket, faster than min time for next bucket).
Query response time histogram
256us	1ms	4ms	16ms	64ms	256ms	1s	4s	16s	gt	max	tag
99.973	0.021	0.006	nonzero	0.000	0.000	0.000	0.000	0.000	0.000	0.015	my8031.cy8_c16r32_32kio
99.912	0.080	0.008	nonzero	nonzero	0.000	0.000	0.000	0.000	0.000	0.028	fbmy8028.cy9c_c16r32_32kio
99.960	0.023	0.016	nonzero	0.000	0.000	0.000	0.000	0.000	0.000	0.012	pg151.cx7_c16r32_32kio
Insert response time histogram
256us	1ms	4ms	16ms	64ms	256ms	1s	4s	16s	gt	max	tag
0.000	0.000	99.171	0.824	0.005	0.000	0.000	0.000	0.000	0.000	0.030	my8031.cy8_c16r32_32kio
0.000	24.122	75.406	0.466	0.006	0.000	0.000	0.000	0.000	0.000	0.025	fbmy8028.cy9c_c16r32_32kio
0.000	11.890	87.452	0.657	0.001	0.000	0.000	0.000	0.000	0.000	0.017	pg151.cx7_c16r32_32kio