Introduction
This is a report for the insert benchmark with 150M docs and 44 client(s). It is generated by scripts (bash, awk, sed) and Tufte might not be impressed. An overview of the insert benchmark is here and a short update is here. Below, by DBMS, I mean DBMS+version.config. An example is my8020.c10b40 where my means MySQL, 8020 is version 8.0.20 and c10b40 is the name for the configuration file.
The test server is an c7g.16xl with 64 cores, 128G RAM and io2 storage (5T, 100K IOPs). The benchmark was run with 44 clients and there was 1 or 2 connections per client (1 for queries, 1 for inserts). The benchmark loads 100M rows without secondary indexes, creates secondary indexes, loads another 50M rows then does 3 read+write tests for one hour each that do queries as fast as possible with 100, 500 and then 1000 writes/second/client concurrent with the queries. The database is cached by the storage engine and the only IO is for writes. Clients and the DBMS share one server. The per-database configs are in the per-database subdirectories here.
The tested DBMS are:
- my8031.cy8 - MySQL 8.0.31 with InnoDB and the cy8_128gram_64kiops config
- fbmy8028.clang.cy9c - FB MySQL 8.0.28 with MyRocks and the cy9c_128gram_64kiops config, compiled with clang
- fbmy8028.gcc.cy9c - FB MySQL 8.0.28 with MyRocks and the cy9c_128gram_64kiops config, compiled with gcc
- pg151.cx7 - Postgres 15.1 and the cx7_128gram_64kiops config
Contents
- Summary
- l.i0: load without secondary indexes
- l.x: create secondary indexes
- l.i1: continue load after secondary indexes created
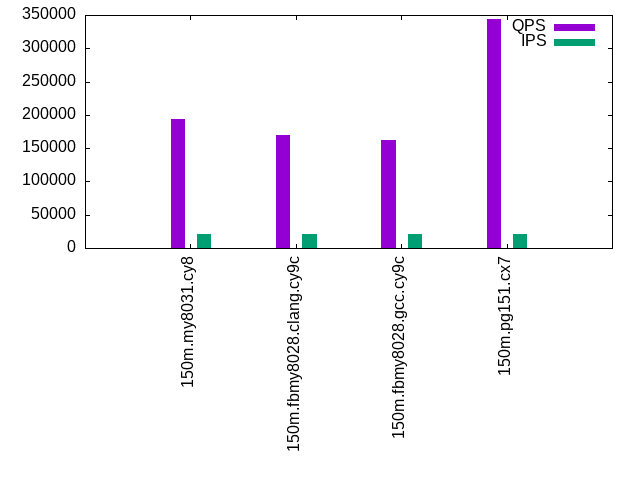
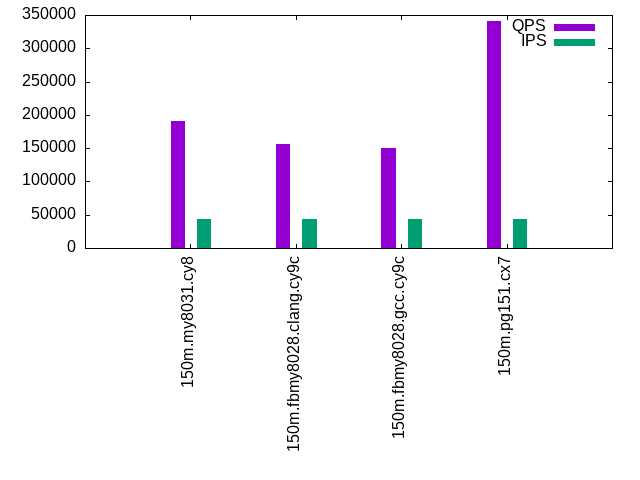
- q100.1: range queries with 100 insert/s per client
- q500.1: range queries with 500 insert/s per client
- q1000.1: range queries with 1000 insert/s per client
Summary
The numbers are inserts/s for l.i0 and l.i1, indexed docs (or rows) /s for l.x and queries/s for q*.2. The values are the average rate over the entire test for inserts (IPS) and queries (QPS). The range of values for IPS and QPS is split into 3 parts: bottom 25%, middle 50%, top 25%. Values in the bottom 25% have a red background, values in the top 25% have a green background and values in the middle have no color. A gray background is used for values that can be ignored because the DBMS did not sustain the target insert rate. Red backgrounds are not used when the minimum value is within 80% of the max value.
| dbms | l.i0 | l.x | l.i1 | q100.1 | q500.1 | q1000.1 |
|---|---|---|---|---|---|---|
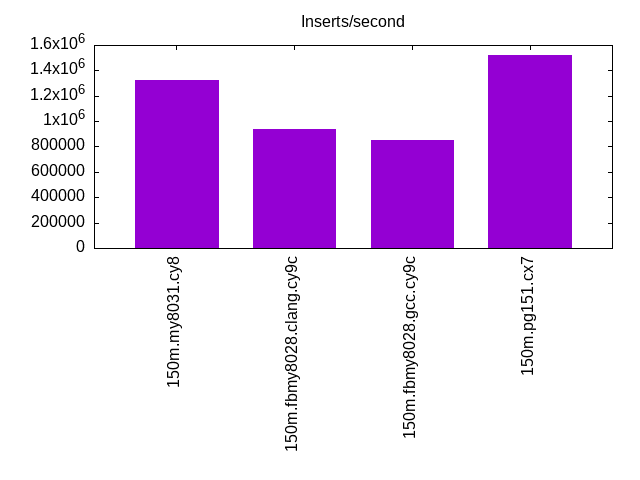
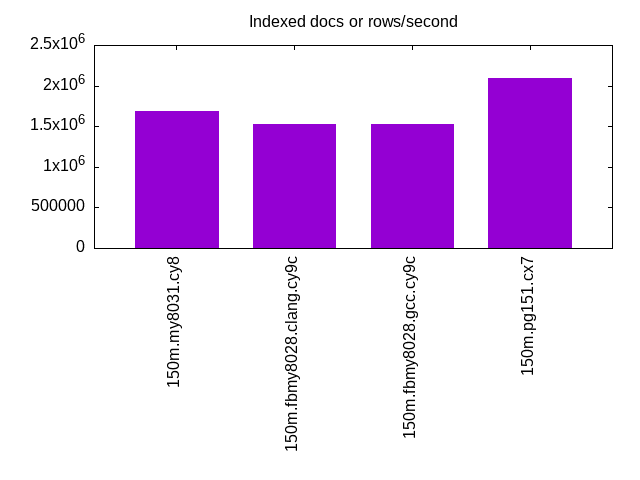
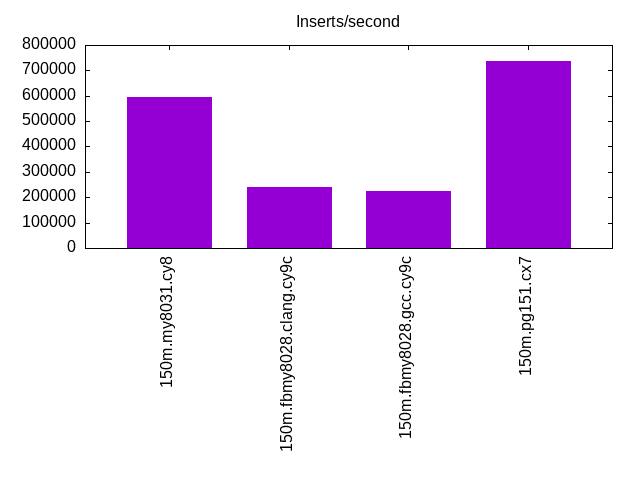
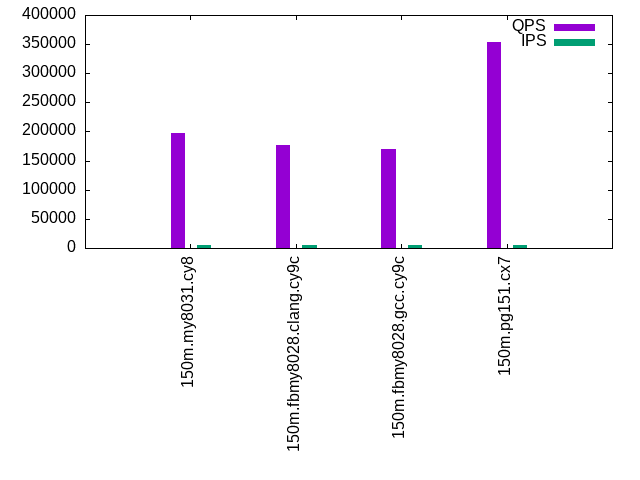
| 150m.my8031.cy8 | 1327311 | 1692864 | 595782 | 197086 | 193475 | 190101 |
| 150m.fbmy8028.clang.cy9c | 936228 | 1521125 | 240499 | 176211 | 169581 | 156082 |
| 150m.fbmy8028.gcc.cy9c | 852501 | 1521125 | 225016 | 169724 | 162922 | 149651 |
| 150m.pg151.cx7 | 1519675 | 2099152 | 738434 | 353185 | 344137 | 341230 |
This lists the average rate of inserts/s for the tests that do inserts concurrent with queries. For such tests the query rate is listed in the table above. The read+write tests are setup so that the insert rate should match the target rate every second. Cells that are not at least 95% of the target have a red background to indicate a failure to satisfy the target.
| dbms | q100.1 | q500.1 | q1000.1 |
|---|---|---|---|
| my8031.cy8 | 4343 | 21716 | 43433 |
| fbmy8028.clang.cy9c | 4343 | 21716 | 43433 |
| fbmy8028.gcc.cy9c | 4343 | 21716 | 43445 |
| pg151.cx7 | 4344 | 21716 | 43433 |
| target | 4400 | 22000 | 44000 |
l.i0
l.i0: load without secondary indexes. Graphs for performance per 1-second interval are here.
Average throughput:
Insert response time histogram: each cell has the percentage of responses that take <= the time in the header and max is the max response time in seconds. For the max column values in the top 25% of the range have a red background and in the bottom 25% of the range have a green background. The red background is not used when the min value is within 80% of the max value.
| dbms | 256us | 1ms | 4ms | 16ms | 64ms | 256ms | 1s | 4s | 16s | gt | max |
|---|---|---|---|---|---|---|---|---|---|---|---|
| my8031.cy8 | 18.895 | 80.865 | 0.155 | 0.041 | 0.044 | 0.138 | |||||
| fbmy8028.clang.cy9c | 4.798 | 91.345 | 3.747 | 0.103 | 0.008 | 0.095 | |||||
| fbmy8028.gcc.cy9c | 4.227 | 79.566 | 16.099 | 0.090 | 0.018 | 0.074 | |||||
| pg151.cx7 | 99.851 | 0.149 | nonzero | 0.005 |
Performance metrics for the DBMS listed above. Some are normalized by throughput, others are not. Legend for results is here.
ips	qps	rps	rmbps	wps	wmbps	rpq	rkbpq	wpi	wkbpi	csps	cpups	cspq	cpupq	dbgb1	dbgb2	rss	maxop	p50	p99	tag
1327311	0	0	0.0	1996.5	337.8	0.000	0.000	0.002	0.261	232783	34.5	0.175	17	7.2	135.8	14.6	0.138	108486	27870	150m.my8031.cy8
936228	0	0	0.0	1381.8	312.6	0.000	0.000	0.001	0.342	479580	41.7	0.512	29	5.4	5.9	1.9	0.095	100393	15883	150m.fbmy8028.clang.cy9c
852501	0	0	0.0	1282.0	291.4	0.000	0.000	0.002	0.350	528785	43.6	0.620	33	5.6	6.1	1.9	0.074	99993	39676	150m.fbmy8028.gcc.cy9c
1519675	0	0	0.0	2579.9	598.3	0.000	0.000	0.002	0.403	178366	29.1	0.117	12	10.0	27.1	8.0	0.005	146648	48748	150m.pg151.cx7
l.x
l.x: create secondary indexes.
Average throughput:
Performance metrics for the DBMS listed above. Some are normalized by throughput, others are not. Legend for results is here.
ips	qps	rps	rmbps	wps	wmbps	rpq	rkbpq	wpi	wkbpi	csps	cpups	cspq	cpupq	dbgb1	dbgb2	rss	maxop	p50	p99	tag
1692864	0	9872	617.1	33230.1	1493.8	0.006	0.373	0.020	0.904	164504	25.4	0.097	10	15.6	144.2	16.1	0.002	NA	NA	150m.my8031.cy8
1521125	0	8	0.3	1539.6	340.9	0.000	0.000	0.001	0.229	11200	27.5	0.007	12	7.2	7.8	8.3	0.002	NA	NA	150m.fbmy8028.clang.cy9c
1521125	0	8	0.3	1526.0	340.7	0.000	0.000	0.001	0.229	11586	27.5	0.008	12	7.3	7.8	9.4	0.009	NA	NA	150m.fbmy8028.gcc.cy9c
2099152	0	0	0.0	2387.8	575.2	0.000	0.000	0.001	0.281	36333	10.6	0.017	3	19.3	44.8	0.0	0.032	NA	NA	150m.pg151.cx7
l.i1
l.i1: continue load after secondary indexes created. Graphs for performance per 1-second interval are here.
Average throughput:
Insert response time histogram: each cell has the percentage of responses that take <= the time in the header and max is the max response time in seconds. For the max column values in the top 25% of the range have a red background and in the bottom 25% of the range have a green background. The red background is not used when the min value is within 80% of the max value.
| dbms | 256us | 1ms | 4ms | 16ms | 64ms | 256ms | 1s | 4s | 16s | gt | max |
|---|---|---|---|---|---|---|---|---|---|---|---|
| my8031.cy8 | 99.240 | 0.391 | 0.206 | 0.162 | nonzero | 0.277 | |||||
| fbmy8028.clang.cy9c | 0.998 | 11.550 | 87.367 | 0.067 | 0.018 | 0.082 | |||||
| fbmy8028.gcc.cy9c | 0.410 | 9.896 | 89.601 | 0.073 | 0.020 | 0.075 | |||||
| pg151.cx7 | 11.377 | 88.585 | 0.038 | 0.012 |
Performance metrics for the DBMS listed above. Some are normalized by throughput, others are not. Legend for results is here.
ips	qps	rps	rmbps	wps	wmbps	rpq	rkbpq	wpi	wkbpi	csps	cpups	cspq	cpupq	dbgb1	dbgb2	rss	maxop	p50	p99	tag
595782	0	5244	81.9	3968.3	453.5	0.009	0.141	0.007	0.779	257310	37.9	0.432	41	27.8	156.4	32.8	0.277	30377	400	150m.my8031.cy8
240499	0	148	18.1	1371.0	318.7	0.001	0.077	0.006	1.357	154361	20.9	0.642	56	16.7	18.0	10.1	0.082	5744	4845	150m.fbmy8028.clang.cy9c
225016	0	138	17.0	1331.1	309.4	0.001	0.077	0.006	1.408	130949	20.5	0.582	58	11.6	12.9	11.2	0.075	5344	1498	150m.fbmy8028.gcc.cy9c
738434	0	0	0.0	3565.1	836.2	0.000	0.000	0.005	1.160	337559	35.9	0.457	31	33.6	82.3	23.2	0.012	46850	1998	150m.pg151.cx7
q100.1
q100.1: range queries with 100 insert/s per client. Graphs for performance per 1-second interval are here.
Average throughput:
Query response time histogram: each cell has the percentage of responses that take <= the time in the header and max is the max response time in seconds. For max values in the top 25% of the range have a red background and in the bottom 25% of the range have a green background. The red background is not used when the min value is within 80% of the max value.
| dbms | 256us | 1ms | 4ms | 16ms | 64ms | 256ms | 1s | 4s | 16s | gt | max |
|---|---|---|---|---|---|---|---|---|---|---|---|
| my8031.cy8 | 93.425 | 6.568 | 0.006 | nonzero | nonzero | 0.019 | |||||
| fbmy8028.clang.cy9c | 80.079 | 19.918 | 0.003 | nonzero | nonzero | 0.018 | |||||
| fbmy8028.gcc.cy9c | 71.377 | 28.620 | 0.003 | nonzero | nonzero | 0.016 | |||||
| pg151.cx7 | 99.886 | 0.109 | 0.005 | nonzero | nonzero | 0.024 |
Insert response time histogram: each cell has the percentage of responses that take <= the time in the header and max is the max response time in seconds. For max values in the top 25% of the range have a red background and in the bottom 25% of the range have a green background. The red background is not used when the min value is within 80% of the max value.
| dbms | 256us | 1ms | 4ms | 16ms | 64ms | 256ms | 1s | 4s | 16s | gt | max |
|---|---|---|---|---|---|---|---|---|---|---|---|
| my8031.cy8 | 98.355 | 1.645 | 0.015 | ||||||||
| fbmy8028.clang.cy9c | 0.395 | 98.939 | 0.667 | 0.014 | |||||||
| fbmy8028.gcc.cy9c | 0.034 | 98.628 | 1.338 | 0.016 | |||||||
| pg151.cx7 | 0.001 | 94.988 | 4.088 | 0.917 | 0.006 | 0.077 |
Performance metrics for the DBMS listed above. Some are normalized by throughput, others are not. Legend for results is here.
ips	qps	rps	rmbps	wps	wmbps	rpq	rkbpq	wpi	wkbpi	csps	cpups	cspq	cpupq	dbgb1	dbgb2	rss	maxop	p50	p99	tag
4343	197086	0	0.0	412.0	12.8	0.000	0.000	0.095	3.026	742584	67.2	3.768	218	28.9	157.5	33.8	0.019	4541	4507	150m.my8031.cy8
4343	176211	0	0.0	46.2	10.3	0.000	0.000	0.011	2.428	672122	68.4	3.814	248	12.2	13.6	40.1	0.018	4044	3836	150m.fbmy8028.clang.cy9c
4343	169724	0	0.0	47.2	10.5	0.000	0.000	0.011	2.481	647218	68.5	3.813	258	12.2	13.6	41.3	0.016	3900	3692	150m.fbmy8028.gcc.cy9c
4344	353185	0	0.0	1896.8	84.8	0.000	0.000	0.437	19.977	1283275	65.4	3.633	119	35.1	85.5	17.3	0.024	7991	7784	150m.pg151.cx7
q500.1
q500.1: range queries with 500 insert/s per client. Graphs for performance per 1-second interval are here.
Average throughput:
Query response time histogram: each cell has the percentage of responses that take <= the time in the header and max is the max response time in seconds. For max values in the top 25% of the range have a red background and in the bottom 25% of the range have a green background. The red background is not used when the min value is within 80% of the max value.
| dbms | 256us | 1ms | 4ms | 16ms | 64ms | 256ms | 1s | 4s | 16s | gt | max |
|---|---|---|---|---|---|---|---|---|---|---|---|
| my8031.cy8 | 92.420 | 7.534 | 0.044 | 0.001 | nonzero | 0.028 | |||||
| fbmy8028.clang.cy9c | 70.462 | 29.512 | 0.025 | 0.001 | nonzero | 0.038 | |||||
| fbmy8028.gcc.cy9c | 57.586 | 42.386 | 0.027 | 0.001 | nonzero | 0.049 | |||||
| pg151.cx7 | 99.752 | 0.220 | 0.026 | 0.002 | nonzero | 0.031 |
Insert response time histogram: each cell has the percentage of responses that take <= the time in the header and max is the max response time in seconds. For max values in the top 25% of the range have a red background and in the bottom 25% of the range have a green background. The red background is not used when the min value is within 80% of the max value.
| dbms | 256us | 1ms | 4ms | 16ms | 64ms | 256ms | 1s | 4s | 16s | gt | max |
|---|---|---|---|---|---|---|---|---|---|---|---|
| my8031.cy8 | 69.252 | 30.685 | 0.063 | 0.035 | |||||||
| fbmy8028.clang.cy9c | 0.020 | 8.959 | 88.494 | 2.528 | 0.043 | ||||||
| fbmy8028.gcc.cy9c | 0.002 | 8.491 | 88.224 | 3.283 | 0.043 | ||||||
| pg151.cx7 | nonzero | 57.663 | 34.767 | 7.464 | 0.107 | 0.134 |
Performance metrics for the DBMS listed above. Some are normalized by throughput, others are not. Legend for results is here.
ips	qps	rps	rmbps	wps	wmbps	rpq	rkbpq	wpi	wkbpi	csps	cpups	cspq	cpupq	dbgb1	dbgb2	rss	maxop	p50	p99	tag
21716	193475	0	0.0	995.9	41.8	0.000	0.000	0.046	1.972	728213	68.4	3.764	226	51.4	180.0	53.9	0.028	4427	4363	150m.my8031.cy8
21716	169581	0	0.0	198.9	46.9	0.000	0.000	0.009	2.212	653435	69.8	3.853	263	17.8	19.8	87.4	0.038	3884	3660	150m.fbmy8028.clang.cy9c
21716	162922	0	0.0	199.4	46.9	0.000	0.000	0.009	2.214	626800	70.1	3.847	275	17.8	19.8	88.7	0.049	3740	3516	150m.fbmy8028.gcc.cy9c
21716	344137	0	0.0	1413.2	147.1	0.000	0.000	0.065	6.937	1252317	66.1	3.639	123	58.1	103.0	0.0	0.031	7847	7416	150m.pg151.cx7
q1000.1
q1000.1: range queries with 1000 insert/s per client. Graphs for performance per 1-second interval are here.
Average throughput:
Query response time histogram: each cell has the percentage of responses that take <= the time in the header and max is the max response time in seconds. For max values in the top 25% of the range have a red background and in the bottom 25% of the range have a green background. The red background is not used when the min value is within 80% of the max value.
| dbms | 256us | 1ms | 4ms | 16ms | 64ms | 256ms | 1s | 4s | 16s | gt | max |
|---|---|---|---|---|---|---|---|---|---|---|---|
| my8031.cy8 | 91.865 | 8.077 | 0.056 | 0.002 | nonzero | 0.028 | |||||
| fbmy8028.clang.cy9c | 42.068 | 57.873 | 0.057 | 0.002 | nonzero | 0.062 | |||||
| fbmy8028.gcc.cy9c | 25.400 | 74.537 | 0.061 | 0.002 | nonzero | 0.060 | |||||
| pg151.cx7 | 99.600 | 0.344 | 0.046 | 0.011 | nonzero | nonzero | nonzero | 0.427 |
Insert response time histogram: each cell has the percentage of responses that take <= the time in the header and max is the max response time in seconds. For max values in the top 25% of the range have a red background and in the bottom 25% of the range have a green background. The red background is not used when the min value is within 80% of the max value.
| dbms | 256us | 1ms | 4ms | 16ms | 64ms | 256ms | 1s | 4s | 16s | gt | max |
|---|---|---|---|---|---|---|---|---|---|---|---|
| my8031.cy8 | 60.705 | 39.044 | 0.251 | 0.058 | |||||||
| fbmy8028.clang.cy9c | 0.009 | 8.853 | 86.727 | 4.411 | 0.063 | ||||||
| fbmy8028.gcc.cy9c | 0.001 | 8.028 | 86.335 | 5.636 | 0.062 | ||||||
| pg151.cx7 | 0.001 | 52.912 | 36.624 | 10.299 | 0.158 | 0.007 | 0.522 |
Performance metrics for the DBMS listed above. Some are normalized by throughput, others are not. Legend for results is here.
ips	qps	rps	rmbps	wps	wmbps	rpq	rkbpq	wpi	wkbpi	csps	cpups	cspq	cpupq	dbgb1	dbgb2	rss	maxop	p50	p99	tag
43433	190101	0	0.0	1811.0	71.6	0.000	0.000	0.042	1.688	703173	69.8	3.699	235	76.5	205.1	77.0	0.028	4347	4267	150m.my8031.cy8
43433	156082	80	9.2	409.5	91.5	0.001	0.061	0.009	2.158	616663	71.5	3.951	293	29.1	30.2	109.3	0.062	3580	3276	150m.fbmy8028.clang.cy9c
43445	149651	70	8.4	409.8	92.0	0.000	0.058	0.009	2.168	588220	71.7	3.931	307	29.5	30.6	104.7	0.060	3438	3149	150m.fbmy8028.gcc.cy9c
43433	341230	2	0.0	2158.3	258.7	0.000	0.000	0.050	6.099	1227152	66.8	3.596	125	80.4	157.4	0.0	0.427	7768	6521	150m.pg151.cx7
l.i0
l.i0: load without secondary indexes
Performance metrics for all DBMS, not just the ones listed above. Some are normalized by throughput, others are not. Legend for results is here.
ips	qps	rps	rmbps	wps	wmbps	rpq	rkbpq	wpi	wkbpi	csps	cpups	cspq	cpupq	dbgb1	dbgb2	rss	maxop	p50	p99	tag
1327311	0	0	0.0	1996.5	337.8	0.000	0.000	0.002	0.261	232783	34.5	0.175	17	7.2	135.8	14.6	0.138	108486	27870	150m.my8031.cy8
936228	0	0	0.0	1381.8	312.6	0.000	0.000	0.001	0.342	479580	41.7	0.512	29	5.4	5.9	1.9	0.095	100393	15883	150m.fbmy8028.clang.cy9c
852501	0	0	0.0	1282.0	291.4	0.000	0.000	0.002	0.350	528785	43.6	0.620	33	5.6	6.1	1.9	0.074	99993	39676	150m.fbmy8028.gcc.cy9c
1519675	0	0	0.0	2579.9	598.3	0.000	0.000	0.002	0.403	178366	29.1	0.117	12	10.0	27.1	8.0	0.005	146648	48748	150m.pg151.cx7
l.x
l.x: create secondary indexes
Performance metrics for all DBMS, not just the ones listed above. Some are normalized by throughput, others are not. Legend for results is here.
ips	qps	rps	rmbps	wps	wmbps	rpq	rkbpq	wpi	wkbpi	csps	cpups	cspq	cpupq	dbgb1	dbgb2	rss	maxop	p50	p99	tag
1692864	0	9872	617.1	33230.1	1493.8	0.006	0.373	0.020	0.904	164504	25.4	0.097	10	15.6	144.2	16.1	0.002	NA	NA	150m.my8031.cy8
1521125	0	8	0.3	1539.6	340.9	0.000	0.000	0.001	0.229	11200	27.5	0.007	12	7.2	7.8	8.3	0.002	NA	NA	150m.fbmy8028.clang.cy9c
1521125	0	8	0.3	1526.0	340.7	0.000	0.000	0.001	0.229	11586	27.5	0.008	12	7.3	7.8	9.4	0.009	NA	NA	150m.fbmy8028.gcc.cy9c
2099152	0	0	0.0	2387.8	575.2	0.000	0.000	0.001	0.281	36333	10.6	0.017	3	19.3	44.8	0.0	0.032	NA	NA	150m.pg151.cx7
l.i1
l.i1: continue load after secondary indexes created
Performance metrics for all DBMS, not just the ones listed above. Some are normalized by throughput, others are not. Legend for results is here.
ips	qps	rps	rmbps	wps	wmbps	rpq	rkbpq	wpi	wkbpi	csps	cpups	cspq	cpupq	dbgb1	dbgb2	rss	maxop	p50	p99	tag
595782	0	5244	81.9	3968.3	453.5	0.009	0.141	0.007	0.779	257310	37.9	0.432	41	27.8	156.4	32.8	0.277	30377	400	150m.my8031.cy8
240499	0	148	18.1	1371.0	318.7	0.001	0.077	0.006	1.357	154361	20.9	0.642	56	16.7	18.0	10.1	0.082	5744	4845	150m.fbmy8028.clang.cy9c
225016	0	138	17.0	1331.1	309.4	0.001	0.077	0.006	1.408	130949	20.5	0.582	58	11.6	12.9	11.2	0.075	5344	1498	150m.fbmy8028.gcc.cy9c
738434	0	0	0.0	3565.1	836.2	0.000	0.000	0.005	1.160	337559	35.9	0.457	31	33.6	82.3	23.2	0.012	46850	1998	150m.pg151.cx7
q100.1
q100.1: range queries with 100 insert/s per client
Performance metrics for all DBMS, not just the ones listed above. Some are normalized by throughput, others are not. Legend for results is here.
ips	qps	rps	rmbps	wps	wmbps	rpq	rkbpq	wpi	wkbpi	csps	cpups	cspq	cpupq	dbgb1	dbgb2	rss	maxop	p50	p99	tag
4343	197086	0	0.0	412.0	12.8	0.000	0.000	0.095	3.026	742584	67.2	3.768	218	28.9	157.5	33.8	0.019	4541	4507	150m.my8031.cy8
4343	176211	0	0.0	46.2	10.3	0.000	0.000	0.011	2.428	672122	68.4	3.814	248	12.2	13.6	40.1	0.018	4044	3836	150m.fbmy8028.clang.cy9c
4343	169724	0	0.0	47.2	10.5	0.000	0.000	0.011	2.481	647218	68.5	3.813	258	12.2	13.6	41.3	0.016	3900	3692	150m.fbmy8028.gcc.cy9c
4344	353185	0	0.0	1896.8	84.8	0.000	0.000	0.437	19.977	1283275	65.4	3.633	119	35.1	85.5	17.3	0.024	7991	7784	150m.pg151.cx7
q500.1
q500.1: range queries with 500 insert/s per client
Performance metrics for all DBMS, not just the ones listed above. Some are normalized by throughput, others are not. Legend for results is here.
ips	qps	rps	rmbps	wps	wmbps	rpq	rkbpq	wpi	wkbpi	csps	cpups	cspq	cpupq	dbgb1	dbgb2	rss	maxop	p50	p99	tag
21716	193475	0	0.0	995.9	41.8	0.000	0.000	0.046	1.972	728213	68.4	3.764	226	51.4	180.0	53.9	0.028	4427	4363	150m.my8031.cy8
21716	169581	0	0.0	198.9	46.9	0.000	0.000	0.009	2.212	653435	69.8	3.853	263	17.8	19.8	87.4	0.038	3884	3660	150m.fbmy8028.clang.cy9c
21716	162922	0	0.0	199.4	46.9	0.000	0.000	0.009	2.214	626800	70.1	3.847	275	17.8	19.8	88.7	0.049	3740	3516	150m.fbmy8028.gcc.cy9c
21716	344137	0	0.0	1413.2	147.1	0.000	0.000	0.065	6.937	1252317	66.1	3.639	123	58.1	103.0	0.0	0.031	7847	7416	150m.pg151.cx7
q1000.1
q1000.1: range queries with 1000 insert/s per client
Performance metrics for all DBMS, not just the ones listed above. Some are normalized by throughput, others are not. Legend for results is here.
ips	qps	rps	rmbps	wps	wmbps	rpq	rkbpq	wpi	wkbpi	csps	cpups	cspq	cpupq	dbgb1	dbgb2	rss	maxop	p50	p99	tag
43433	190101	0	0.0	1811.0	71.6	0.000	0.000	0.042	1.688	703173	69.8	3.699	235	76.5	205.1	77.0	0.028	4347	4267	150m.my8031.cy8
43433	156082	80	9.2	409.5	91.5	0.001	0.061	0.009	2.158	616663	71.5	3.951	293	29.1	30.2	109.3	0.062	3580	3276	150m.fbmy8028.clang.cy9c
43445	149651	70	8.4	409.8	92.0	0.000	0.058	0.009	2.168	588220	71.7	3.931	307	29.5	30.6	104.7	0.060	3438	3149	150m.fbmy8028.gcc.cy9c
43433	341230	2	0.0	2158.3	258.7	0.000	0.000	0.050	6.099	1227152	66.8	3.596	125	80.4	157.4	0.0	0.427	7768	6521	150m.pg151.cx7
l.i0
- l.i0: load without secondary indexes
- Legend for results is here.
- Each entry lists the percentage of responses that fit in that bucket (slower than max time for previous bucket, faster than min time for next bucket).
Insert response time histogram
256us	1ms	4ms	16ms	64ms	256ms	1s	4s	16s	gt	max	tag
0.000	18.895	80.865	0.155	0.041	0.044	0.000	0.000	0.000	0.000	0.138	my8031.cy8
0.000	4.798	91.345	3.747	0.103	0.008	0.000	0.000	0.000	0.000	0.095	fbmy8028.clang.cy9c
0.000	4.227	79.566	16.099	0.090	0.018	0.000	0.000	0.000	0.000	0.074	fbmy8028.gcc.cy9c
0.000	99.851	0.149	nonzero	0.000	0.000	0.000	0.000	0.000	0.000	0.005	pg151.cx7
l.x
- l.x: create secondary indexes
- Legend for results is here.
- Each entry lists the percentage of responses that fit in that bucket (slower than max time for previous bucket, faster than min time for next bucket).
TODO - determine whether there is data for create index response time
l.i1
- l.i1: continue load after secondary indexes created
- Legend for results is here.
- Each entry lists the percentage of responses that fit in that bucket (slower than max time for previous bucket, faster than min time for next bucket).
Insert response time histogram
256us	1ms	4ms	16ms	64ms	256ms	1s	4s	16s	gt	max	tag
0.000	0.000	99.240	0.391	0.206	0.162	nonzero	0.000	0.000	0.000	0.277	my8031.cy8
0.000	0.998	11.550	87.367	0.067	0.018	0.000	0.000	0.000	0.000	0.082	fbmy8028.clang.cy9c
0.000	0.410	9.896	89.601	0.073	0.020	0.000	0.000	0.000	0.000	0.075	fbmy8028.gcc.cy9c
0.000	11.377	88.585	0.038	0.000	0.000	0.000	0.000	0.000	0.000	0.012	pg151.cx7
q100.1
- q100.1: range queries with 100 insert/s per client
- Legend for results is here.
- Each entry lists the percentage of responses that fit in that bucket (slower than max time for previous bucket, faster than min time for next bucket).
Query response time histogram
256us	1ms	4ms	16ms	64ms	256ms	1s	4s	16s	gt	max	tag
93.425	6.568	0.006	nonzero	nonzero	0.000	0.000	0.000	0.000	0.000	0.019	my8031.cy8
80.079	19.918	0.003	nonzero	nonzero	0.000	0.000	0.000	0.000	0.000	0.018	fbmy8028.clang.cy9c
71.377	28.620	0.003	nonzero	nonzero	0.000	0.000	0.000	0.000	0.000	0.016	fbmy8028.gcc.cy9c
99.886	0.109	0.005	nonzero	nonzero	0.000	0.000	0.000	0.000	0.000	0.024	pg151.cx7
Insert response time histogram
256us	1ms	4ms	16ms	64ms	256ms	1s	4s	16s	gt	max	tag
0.000	0.000	98.355	1.645	0.000	0.000	0.000	0.000	0.000	0.000	0.015	my8031.cy8
0.000	0.395	98.939	0.667	0.000	0.000	0.000	0.000	0.000	0.000	0.014	fbmy8028.clang.cy9c
0.000	0.034	98.628	1.338	0.000	0.000	0.000	0.000	0.000	0.000	0.016	fbmy8028.gcc.cy9c
0.000	0.001	94.988	4.088	0.917	0.006	0.000	0.000	0.000	0.000	0.077	pg151.cx7
q500.1
- q500.1: range queries with 500 insert/s per client
- Legend for results is here.
- Each entry lists the percentage of responses that fit in that bucket (slower than max time for previous bucket, faster than min time for next bucket).
Query response time histogram
256us	1ms	4ms	16ms	64ms	256ms	1s	4s	16s	gt	max	tag
92.420	7.534	0.044	0.001	nonzero	0.000	0.000	0.000	0.000	0.000	0.028	my8031.cy8
70.462	29.512	0.025	0.001	nonzero	0.000	0.000	0.000	0.000	0.000	0.038	fbmy8028.clang.cy9c
57.586	42.386	0.027	0.001	nonzero	0.000	0.000	0.000	0.000	0.000	0.049	fbmy8028.gcc.cy9c
99.752	0.220	0.026	0.002	nonzero	0.000	0.000	0.000	0.000	0.000	0.031	pg151.cx7
Insert response time histogram
256us	1ms	4ms	16ms	64ms	256ms	1s	4s	16s	gt	max	tag
0.000	0.000	69.252	30.685	0.063	0.000	0.000	0.000	0.000	0.000	0.035	my8031.cy8
0.000	0.020	8.959	88.494	2.528	0.000	0.000	0.000	0.000	0.000	0.043	fbmy8028.clang.cy9c
0.000	0.002	8.491	88.224	3.283	0.000	0.000	0.000	0.000	0.000	0.043	fbmy8028.gcc.cy9c
0.000	nonzero	57.663	34.767	7.464	0.107	0.000	0.000	0.000	0.000	0.134	pg151.cx7
q1000.1
- q1000.1: range queries with 1000 insert/s per client
- Legend for results is here.
- Each entry lists the percentage of responses that fit in that bucket (slower than max time for previous bucket, faster than min time for next bucket).
Query response time histogram
256us	1ms	4ms	16ms	64ms	256ms	1s	4s	16s	gt	max	tag
91.865	8.077	0.056	0.002	nonzero	0.000	0.000	0.000	0.000	0.000	0.028	my8031.cy8
42.068	57.873	0.057	0.002	nonzero	0.000	0.000	0.000	0.000	0.000	0.062	fbmy8028.clang.cy9c
25.400	74.537	0.061	0.002	nonzero	0.000	0.000	0.000	0.000	0.000	0.060	fbmy8028.gcc.cy9c
99.600	0.344	0.046	0.011	nonzero	nonzero	nonzero	0.000	0.000	0.000	0.427	pg151.cx7
Insert response time histogram
256us	1ms	4ms	16ms	64ms	256ms	1s	4s	16s	gt	max	tag
0.000	0.000	60.705	39.044	0.251	0.000	0.000	0.000	0.000	0.000	0.058	my8031.cy8
0.000	0.009	8.853	86.727	4.411	0.000	0.000	0.000	0.000	0.000	0.063	fbmy8028.clang.cy9c
0.000	0.001	8.028	86.335	5.636	0.000	0.000	0.000	0.000	0.000	0.062	fbmy8028.gcc.cy9c
0.000	0.001	52.912	36.624	10.299	0.158	0.007	0.000	0.000	0.000	0.522	pg151.cx7