Introduction
This is a report for the insert benchmark with 20M docs and 1 client(s). It is generated by scripts (bash, awk, sed) and Tufte might not be impressed. An overview of the insert benchmark is here and a short update is here. Below, by DBMS, I mean DBMS+version.config. An example is my8020.c10b40 where my means MySQL, 8020 is version 8.0.20 and c10b40 is the name for the configuration file.
The test server is an c7g.2xl with 8 cores, 16G RAM and io2 storage (256G, 10K IOPs). The benchmark was run with 1 clients and there was 1 or 2 connections per client (1 for queries, 1 for inserts). The benchmark loads 20M rows without secondary indexes, creates secondary indexes, loads another 20M rows then does 3 read+write tests for one hour each that do queries as fast as possible with 100, 500 and then 1000 writes/second/client concurrent with the queries. The database is cached by the storage engine and the only IO is for writes. Clients and the DBMS share one server. The per-database configs are in the per-database subdirectories here.
The tested DBMS are:
- my8031.cy8 - MySQL 8.0.31 with InnoDB and the cy8 config
- fbmy8028.cy9c - FB MySQL 8.0.28 with MyRocks and the cy9c config
- pg151.cx7 - Postgres 15.1 and the cx7 config
Contents
- Summary
- l.i0: load without secondary indexes
- l.x: create secondary indexes
- l.i1: continue load after secondary indexes created
- q100.1: range queries with 100 insert/s per client
- q500.1: range queries with 500 insert/s per client
- q1000.1: range queries with 1000 insert/s per client
Summary
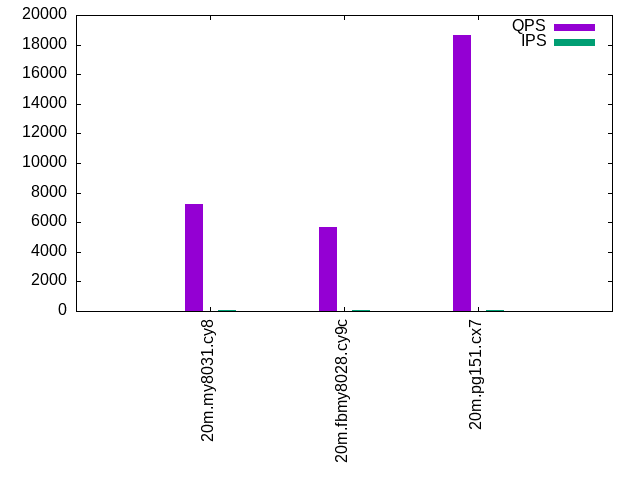
The numbers are inserts/s for l.i0 and l.i1, indexed docs (or rows) /s for l.x and queries/s for q*.2. The values are the average rate over the entire test for inserts (IPS) and queries (QPS). The range of values for IPS and QPS is split into 3 parts: bottom 25%, middle 50%, top 25%. Values in the bottom 25% have a red background, values in the top 25% have a green background and values in the middle have no color. A gray background is used for values that can be ignored because the DBMS did not sustain the target insert rate. Red backgrounds are not used when the minimum value is within 80% of the max value.
| dbms | l.i0 | l.x | l.i1 | q100.1 | q500.1 | q1000.1 |
|---|---|---|---|---|---|---|
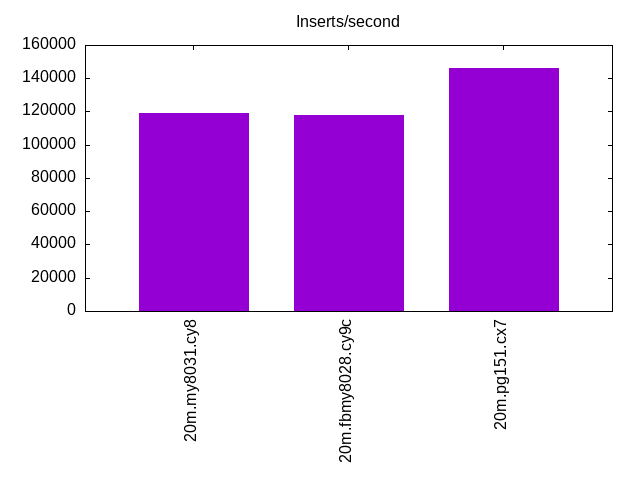
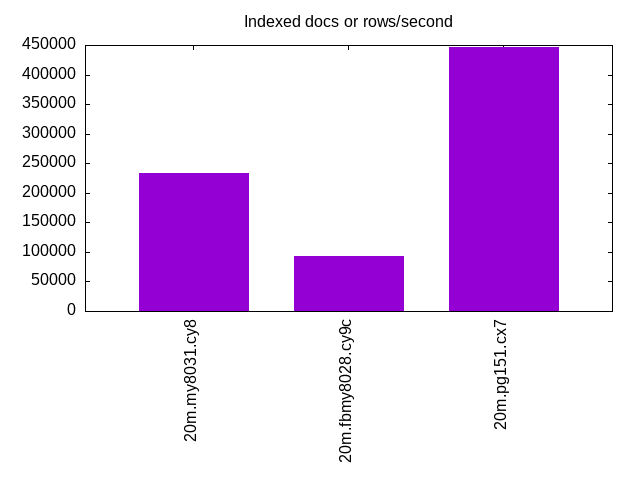
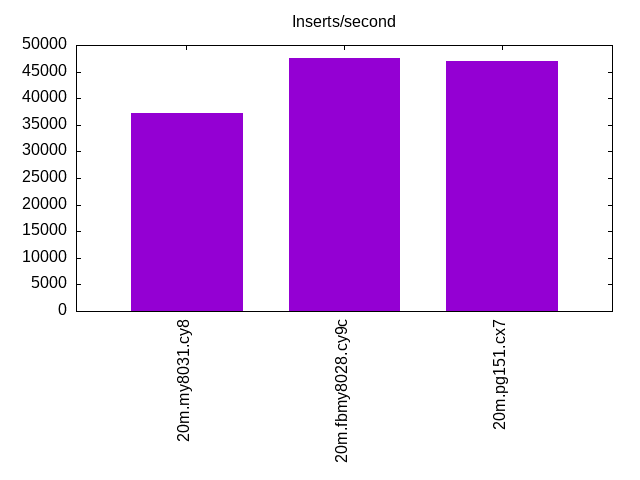
| 20m.my8031.cy8 | 119048 | 233721 | 37244 | 7243 | 7188 | 7085 |
| 20m.fbmy8028.cy9c | 117647 | 93056 | 47619 | 5699 | 5486 | 5465 |
| 20m.pg151.cx7 | 145985 | 446667 | 46948 | 18682 | 18456 | 18311 |
This lists the average rate of inserts/s for the tests that do inserts concurrent with queries. For such tests the query rate is listed in the table above. The read+write tests are setup so that the insert rate should match the target rate every second. Cells that are not at least 95% of the target have a red background to indicate a failure to satisfy the target.
| dbms | q100.1 | q500.1 | q1000.1 |
|---|---|---|---|
| my8031.cy8 | 100 | 499 | 999 |
| fbmy8028.cy9c | 100 | 500 | 999 |
| pg151.cx7 | 100 | 500 | 999 |
| target | 100 | 500 | 1000 |
l.i0
l.i0: load without secondary indexes. Graphs for performance per 1-second interval are here.
Average throughput:
Insert response time histogram: each cell has the percentage of responses that take <= the time in the header and max is the max response time in seconds. For the max column values in the top 25% of the range have a red background and in the bottom 25% of the range have a green background. The red background is not used when the min value is within 80% of the max value.
| dbms | 256us | 1ms | 4ms | 16ms | 64ms | 256ms | 1s | 4s | 16s | gt | max |
|---|---|---|---|---|---|---|---|---|---|---|---|
| my8031.cy8 | 99.722 | 0.102 | 0.172 | 0.003 | 0.046 | ||||||
| fbmy8028.cy9c | 99.826 | 0.170 | 0.004 | 0.047 | |||||||
| pg151.cx7 | 99.996 | 0.004 | 0.003 |
Performance metrics for the DBMS listed above. Some are normalized by throughput, others are not. Legend for results is here.
ips	qps	rps	rmbps	wps	wmbps	rpq	rkbpq	wpi	wkbpi	csps	cpups	cspq	cpupq	dbgb1	dbgb2	rss	maxop	p50	p99	tag
119048	0	0	0.0	623.0	41.2	0.000	0.000	0.005	0.355	14160	18.4	0.119	6	1.3	3.8	2.5	0.046	119670	112978	20m.my8031.cy8
117647	0	0	0.0	113.6	23.2	0.000	0.000	0.001	0.202	12891	20.1	0.110	7	0.7	1.9	0.6	0.047	119372	106886	20m.fbmy8028.cy9c
145985	0	0	0.0	269.5	61.9	0.000	0.000	0.002	0.434	18552	20.3	0.127	6	1.9	5.2	0.0	0.003	146748	41555	20m.pg151.cx7
l.x
l.x: create secondary indexes.
Average throughput:
Performance metrics for the DBMS listed above. Some are normalized by throughput, others are not. Legend for results is here.
ips	qps	rps	rmbps	wps	wmbps	rpq	rkbpq	wpi	wkbpi	csps	cpups	cspq	cpupq	dbgb1	dbgb2	rss	maxop	p50	p99	tag
233721	0	1215	81.5	4779.3	246.5	0.005	0.357	0.020	1.080	20322	23.1	0.087	4	3.0	5.4	3.9	0.006	NA	NA	20m.my8031.cy8
93056	0	0	0.0	62.7	14.2	0.000	0.000	0.001	0.156	753	12.4	0.008	5	1.4	2.7	1.7	0.002	NA	NA	20m.fbmy8028.cy9c
446667	0	0	0.0	426.6	104.1	0.000	0.000	0.001	0.239	4311	12.2	0.010	1	3.7	8.6	0.0	0.003	NA	NA	20m.pg151.cx7
l.i1
l.i1: continue load after secondary indexes created. Graphs for performance per 1-second interval are here.
Average throughput:
Insert response time histogram: each cell has the percentage of responses that take <= the time in the header and max is the max response time in seconds. For the max column values in the top 25% of the range have a red background and in the bottom 25% of the range have a green background. The red background is not used when the min value is within 80% of the max value.
| dbms | 256us | 1ms | 4ms | 16ms | 64ms | 256ms | 1s | 4s | 16s | gt | max |
|---|---|---|---|---|---|---|---|---|---|---|---|
| my8031.cy8 | 99.509 | 0.357 | 0.097 | 0.036 | 0.123 | ||||||
| fbmy8028.cy9c | 30.409 | 69.588 | 0.001 | 0.002 | 0.025 | ||||||
| pg151.cx7 | 22.347 | 77.652 | 0.001 | 0.008 |
Performance metrics for the DBMS listed above. Some are normalized by throughput, others are not. Legend for results is here.
ips	qps	rps	rmbps	wps	wmbps	rpq	rkbpq	wpi	wkbpi	csps	cpups	cspq	cpupq	dbgb1	dbgb2	rss	maxop	p50	p99	tag
37244	0	172	2.7	2645.6	88.7	0.005	0.074	0.071	2.440	17263	14.5	0.464	16	7.9	10.3	8.3	0.123	40007	549	20m.my8031.cy8
47619	0	14	1.8	232.8	52.7	0.000	0.038	0.005	1.133	11654	26.2	0.245	22	3.0	4.9	2.4	0.025	47250	42904	20m.fbmy8028.cy9c
46948	0	0	0.0	361.9	81.6	0.000	0.000	0.008	1.781	13658	15.5	0.291	13	8.2	23.0	0.0	0.008	47099	37011	20m.pg151.cx7
q100.1
q100.1: range queries with 100 insert/s per client. Graphs for performance per 1-second interval are here.
Average throughput:
Query response time histogram: each cell has the percentage of responses that take <= the time in the header and max is the max response time in seconds. For max values in the top 25% of the range have a red background and in the bottom 25% of the range have a green background. The red background is not used when the min value is within 80% of the max value.
| dbms | 256us | 1ms | 4ms | 16ms | 64ms | 256ms | 1s | 4s | 16s | gt | max |
|---|---|---|---|---|---|---|---|---|---|---|---|
| my8031.cy8 | 99.999 | 0.001 | nonzero | nonzero | 0.005 | ||||||
| fbmy8028.cy9c | 99.996 | 0.004 | nonzero | 0.003 | |||||||
| pg151.cx7 | 100.000 | nonzero | nonzero | 0.003 |
Insert response time histogram: each cell has the percentage of responses that take <= the time in the header and max is the max response time in seconds. For max values in the top 25% of the range have a red background and in the bottom 25% of the range have a green background. The red background is not used when the min value is within 80% of the max value.
| dbms | 256us | 1ms | 4ms | 16ms | 64ms | 256ms | 1s | 4s | 16s | gt | max |
|---|---|---|---|---|---|---|---|---|---|---|---|
| my8031.cy8 | 99.319 | 0.681 | 0.007 | ||||||||
| fbmy8028.cy9c | 1.514 | 98.486 | 0.002 | ||||||||
| pg151.cx7 | 99.708 | 0.292 | 0.016 |
Performance metrics for the DBMS listed above. Some are normalized by throughput, others are not. Legend for results is here.
ips	qps	rps	rmbps	wps	wmbps	rpq	rkbpq	wpi	wkbpi	csps	cpups	cspq	cpupq	dbgb1	dbgb2	rss	maxop	p50	p99	tag
100	7243	0	0.0	124.3	3.0	0.000	0.000	1.246	31.065	28460	13.1	3.929	72	8.0	10.5	8.5	0.005	7256	6985	20m.my8031.cy8
100	5699	0	0.0	3.7	0.2	0.000	0.000	0.037	1.713	22028	13.1	3.866	92	2.8	4.8	4.1	0.003	5690	5274	20m.fbmy8028.cy9c
100	18682	0	0.0	188.9	4.5	0.000	0.000	1.893	45.897	71550	12.2	3.830	26	8.2	17.7	0.0	0.003	18716	18236	20m.pg151.cx7
q500.1
q500.1: range queries with 500 insert/s per client. Graphs for performance per 1-second interval are here.
Average throughput:

Query response time histogram: each cell has the percentage of responses that take <= the time in the header and max is the max response time in seconds. For max values in the top 25% of the range have a red background and in the bottom 25% of the range have a green background. The red background is not used when the min value is within 80% of the max value.
| dbms | 256us | 1ms | 4ms | 16ms | 64ms | 256ms | 1s | 4s | 16s | gt | max |
|---|---|---|---|---|---|---|---|---|---|---|---|
| my8031.cy8 | 99.998 | 0.002 | nonzero | nonzero | 0.005 | ||||||
| fbmy8028.cy9c | 99.994 | 0.006 | nonzero | 0.003 | |||||||
| pg151.cx7 | 100.000 | nonzero | nonzero | 0.003 |
Insert response time histogram: each cell has the percentage of responses that take <= the time in the header and max is the max response time in seconds. For max values in the top 25% of the range have a red background and in the bottom 25% of the range have a green background. The red background is not used when the min value is within 80% of the max value.
| dbms | 256us | 1ms | 4ms | 16ms | 64ms | 256ms | 1s | 4s | 16s | gt | max |
|---|---|---|---|---|---|---|---|---|---|---|---|
| my8031.cy8 | 99.542 | 0.458 | 0.007 | ||||||||
| fbmy8028.cy9c | 5.872 | 94.125 | 0.003 | 0.004 | |||||||
| pg151.cx7 | 99.931 | 0.067 | 0.003 | 0.016 |
Performance metrics for the DBMS listed above. Some are normalized by throughput, others are not. Legend for results is here.
ips	qps	rps	rmbps	wps	wmbps	rpq	rkbpq	wpi	wkbpi	csps	cpups	cspq	cpupq	dbgb1	dbgb2	rss	maxop	p50	p99	tag
499	7188	0	0.0	234.9	6.1	0.000	0.000	0.470	12.561	28681	13.3	3.990	74	8.7	11.1	9.1	0.005	7208	6924	20m.my8031.cy8
500	5486	0	0.0	4.7	0.4	0.000	0.000	0.009	0.862	21293	13.0	3.881	95	3.0	3.2	4.7	0.003	5498	5035	20m.fbmy8028.cy9c
500	18456	0	0.0	343.4	11.7	0.000	0.000	0.687	23.928	70913	12.6	3.842	27	8.7	13.1	0.0	0.003	18476	18029	20m.pg151.cx7
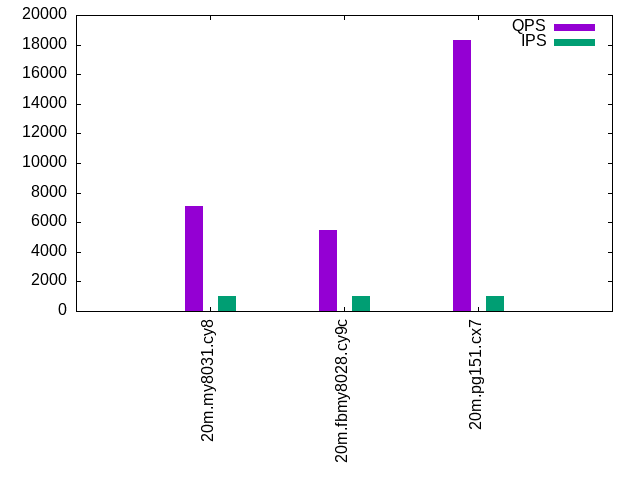
q1000.1
q1000.1: range queries with 1000 insert/s per client. Graphs for performance per 1-second interval are here.
Average throughput:
Query response time histogram: each cell has the percentage of responses that take <= the time in the header and max is the max response time in seconds. For max values in the top 25% of the range have a red background and in the bottom 25% of the range have a green background. The red background is not used when the min value is within 80% of the max value.
| dbms | 256us | 1ms | 4ms | 16ms | 64ms | 256ms | 1s | 4s | 16s | gt | max |
|---|---|---|---|---|---|---|---|---|---|---|---|
| my8031.cy8 | 99.998 | 0.002 | nonzero | nonzero | 0.005 | ||||||
| fbmy8028.cy9c | 99.993 | 0.007 | nonzero | 0.004 | |||||||
| pg151.cx7 | 100.000 | nonzero | nonzero | nonzero | 0.005 |
Insert response time histogram: each cell has the percentage of responses that take <= the time in the header and max is the max response time in seconds. For max values in the top 25% of the range have a red background and in the bottom 25% of the range have a green background. The red background is not used when the min value is within 80% of the max value.
| dbms | 256us | 1ms | 4ms | 16ms | 64ms | 256ms | 1s | 4s | 16s | gt | max |
|---|---|---|---|---|---|---|---|---|---|---|---|
| my8031.cy8 | 99.847 | 0.153 | 0.008 | ||||||||
| fbmy8028.cy9c | 12.639 | 87.356 | 0.006 | 0.006 | |||||||
| pg151.cx7 | 99.954 | 0.043 | 0.003 | 0.040 |
Performance metrics for the DBMS listed above. Some are normalized by throughput, others are not. Legend for results is here.
ips	qps	rps	rmbps	wps	wmbps	rpq	rkbpq	wpi	wkbpi	csps	cpups	cspq	cpupq	dbgb1	dbgb2	rss	maxop	p50	p99	tag
999	7085	0	0.0	373.3	9.6	0.000	0.000	0.374	9.888	28858	13.2	4.073	75	9.1	11.6	9.5	0.005	7096	6841	20m.my8031.cy8
999	5465	1	0.1	8.0	1.2	0.000	0.016	0.008	1.246	21340	13.4	3.905	98	3.3	3.9	6.9	0.004	5482	5003	20m.fbmy8028.cy9c
999	18311	7	0.1	424.4	17.4	0.000	0.003	0.425	17.811	70619	13.0	3.857	28	10.6	15.4	0.0	0.005	18364	17501	20m.pg151.cx7
l.i0
l.i0: load without secondary indexes
Performance metrics for all DBMS, not just the ones listed above. Some are normalized by throughput, others are not. Legend for results is here.
ips	qps	rps	rmbps	wps	wmbps	rpq	rkbpq	wpi	wkbpi	csps	cpups	cspq	cpupq	dbgb1	dbgb2	rss	maxop	p50	p99	tag
119048	0	0	0.0	623.0	41.2	0.000	0.000	0.005	0.355	14160	18.4	0.119	6	1.3	3.8	2.5	0.046	119670	112978	20m.my8031.cy8
117647	0	0	0.0	113.6	23.2	0.000	0.000	0.001	0.202	12891	20.1	0.110	7	0.7	1.9	0.6	0.047	119372	106886	20m.fbmy8028.cy9c
145985	0	0	0.0	269.5	61.9	0.000	0.000	0.002	0.434	18552	20.3	0.127	6	1.9	5.2	0.0	0.003	146748	41555	20m.pg151.cx7
l.x
l.x: create secondary indexes
Performance metrics for all DBMS, not just the ones listed above. Some are normalized by throughput, others are not. Legend for results is here.
ips	qps	rps	rmbps	wps	wmbps	rpq	rkbpq	wpi	wkbpi	csps	cpups	cspq	cpupq	dbgb1	dbgb2	rss	maxop	p50	p99	tag
233721	0	1215	81.5	4779.3	246.5	0.005	0.357	0.020	1.080	20322	23.1	0.087	4	3.0	5.4	3.9	0.006	NA	NA	20m.my8031.cy8
93056	0	0	0.0	62.7	14.2	0.000	0.000	0.001	0.156	753	12.4	0.008	5	1.4	2.7	1.7	0.002	NA	NA	20m.fbmy8028.cy9c
446667	0	0	0.0	426.6	104.1	0.000	0.000	0.001	0.239	4311	12.2	0.010	1	3.7	8.6	0.0	0.003	NA	NA	20m.pg151.cx7
l.i1
l.i1: continue load after secondary indexes created
Performance metrics for all DBMS, not just the ones listed above. Some are normalized by throughput, others are not. Legend for results is here.
ips	qps	rps	rmbps	wps	wmbps	rpq	rkbpq	wpi	wkbpi	csps	cpups	cspq	cpupq	dbgb1	dbgb2	rss	maxop	p50	p99	tag
37244	0	172	2.7	2645.6	88.7	0.005	0.074	0.071	2.440	17263	14.5	0.464	16	7.9	10.3	8.3	0.123	40007	549	20m.my8031.cy8
47619	0	14	1.8	232.8	52.7	0.000	0.038	0.005	1.133	11654	26.2	0.245	22	3.0	4.9	2.4	0.025	47250	42904	20m.fbmy8028.cy9c
46948	0	0	0.0	361.9	81.6	0.000	0.000	0.008	1.781	13658	15.5	0.291	13	8.2	23.0	0.0	0.008	47099	37011	20m.pg151.cx7
q100.1
q100.1: range queries with 100 insert/s per client
Performance metrics for all DBMS, not just the ones listed above. Some are normalized by throughput, others are not. Legend for results is here.
ips	qps	rps	rmbps	wps	wmbps	rpq	rkbpq	wpi	wkbpi	csps	cpups	cspq	cpupq	dbgb1	dbgb2	rss	maxop	p50	p99	tag
100	7243	0	0.0	124.3	3.0	0.000	0.000	1.246	31.065	28460	13.1	3.929	72	8.0	10.5	8.5	0.005	7256	6985	20m.my8031.cy8
100	5699	0	0.0	3.7	0.2	0.000	0.000	0.037	1.713	22028	13.1	3.866	92	2.8	4.8	4.1	0.003	5690	5274	20m.fbmy8028.cy9c
100	18682	0	0.0	188.9	4.5	0.000	0.000	1.893	45.897	71550	12.2	3.830	26	8.2	17.7	0.0	0.003	18716	18236	20m.pg151.cx7
q500.1
q500.1: range queries with 500 insert/s per client
Performance metrics for all DBMS, not just the ones listed above. Some are normalized by throughput, others are not. Legend for results is here.
ips	qps	rps	rmbps	wps	wmbps	rpq	rkbpq	wpi	wkbpi	csps	cpups	cspq	cpupq	dbgb1	dbgb2	rss	maxop	p50	p99	tag
499	7188	0	0.0	234.9	6.1	0.000	0.000	0.470	12.561	28681	13.3	3.990	74	8.7	11.1	9.1	0.005	7208	6924	20m.my8031.cy8
500	5486	0	0.0	4.7	0.4	0.000	0.000	0.009	0.862	21293	13.0	3.881	95	3.0	3.2	4.7	0.003	5498	5035	20m.fbmy8028.cy9c
500	18456	0	0.0	343.4	11.7	0.000	0.000	0.687	23.928	70913	12.6	3.842	27	8.7	13.1	0.0	0.003	18476	18029	20m.pg151.cx7
q1000.1
q1000.1: range queries with 1000 insert/s per client
Performance metrics for all DBMS, not just the ones listed above. Some are normalized by throughput, others are not. Legend for results is here.
ips	qps	rps	rmbps	wps	wmbps	rpq	rkbpq	wpi	wkbpi	csps	cpups	cspq	cpupq	dbgb1	dbgb2	rss	maxop	p50	p99	tag
999	7085	0	0.0	373.3	9.6	0.000	0.000	0.374	9.888	28858	13.2	4.073	75	9.1	11.6	9.5	0.005	7096	6841	20m.my8031.cy8
999	5465	1	0.1	8.0	1.2	0.000	0.016	0.008	1.246	21340	13.4	3.905	98	3.3	3.9	6.9	0.004	5482	5003	20m.fbmy8028.cy9c
999	18311	7	0.1	424.4	17.4	0.000	0.003	0.425	17.811	70619	13.0	3.857	28	10.6	15.4	0.0	0.005	18364	17501	20m.pg151.cx7
l.i0
- l.i0: load without secondary indexes
- Legend for results is here.
- Each entry lists the percentage of responses that fit in that bucket (slower than max time for previous bucket, faster than min time for next bucket).
Insert response time histogram
256us	1ms	4ms	16ms	64ms	256ms	1s	4s	16s	gt	max	tag
0.000	99.722	0.102	0.172	0.003	0.000	0.000	0.000	0.000	0.000	0.046	my8031.cy8
0.000	99.826	0.170	0.000	0.004	0.000	0.000	0.000	0.000	0.000	0.047	fbmy8028.cy9c
0.000	99.996	0.004	0.000	0.000	0.000	0.000	0.000	0.000	0.000	0.003	pg151.cx7
l.x
- l.x: create secondary indexes
- Legend for results is here.
- Each entry lists the percentage of responses that fit in that bucket (slower than max time for previous bucket, faster than min time for next bucket).
TODO - determine whether there is data for create index response time
l.i1
- l.i1: continue load after secondary indexes created
- Legend for results is here.
- Each entry lists the percentage of responses that fit in that bucket (slower than max time for previous bucket, faster than min time for next bucket).
Insert response time histogram
256us	1ms	4ms	16ms	64ms	256ms	1s	4s	16s	gt	max	tag
0.000	0.000	99.509	0.357	0.097	0.036	0.000	0.000	0.000	0.000	0.123	my8031.cy8
0.000	30.409	69.588	0.001	0.002	0.000	0.000	0.000	0.000	0.000	0.025	fbmy8028.cy9c
0.000	22.347	77.652	0.001	0.000	0.000	0.000	0.000	0.000	0.000	0.008	pg151.cx7
q100.1
- q100.1: range queries with 100 insert/s per client
- Legend for results is here.
- Each entry lists the percentage of responses that fit in that bucket (slower than max time for previous bucket, faster than min time for next bucket).
Query response time histogram
256us	1ms	4ms	16ms	64ms	256ms	1s	4s	16s	gt	max	tag
99.999	0.001	nonzero	nonzero	0.000	0.000	0.000	0.000	0.000	0.000	0.005	my8031.cy8
99.996	0.004	nonzero	0.000	0.000	0.000	0.000	0.000	0.000	0.000	0.003	fbmy8028.cy9c
100.000	nonzero	nonzero	0.000	0.000	0.000	0.000	0.000	0.000	0.000	0.003	pg151.cx7
Insert response time histogram
256us	1ms	4ms	16ms	64ms	256ms	1s	4s	16s	gt	max	tag
0.000	0.000	99.319	0.681	0.000	0.000	0.000	0.000	0.000	0.000	0.007	my8031.cy8
0.000	1.514	98.486	0.000	0.000	0.000	0.000	0.000	0.000	0.000	0.002	fbmy8028.cy9c
0.000	0.000	99.708	0.292	0.000	0.000	0.000	0.000	0.000	0.000	0.016	pg151.cx7
q500.1
- q500.1: range queries with 500 insert/s per client
- Legend for results is here.
- Each entry lists the percentage of responses that fit in that bucket (slower than max time for previous bucket, faster than min time for next bucket).
Query response time histogram
256us	1ms	4ms	16ms	64ms	256ms	1s	4s	16s	gt	max	tag
99.998	0.002	nonzero	nonzero	0.000	0.000	0.000	0.000	0.000	0.000	0.005	my8031.cy8
99.994	0.006	nonzero	0.000	0.000	0.000	0.000	0.000	0.000	0.000	0.003	fbmy8028.cy9c
100.000	nonzero	nonzero	0.000	0.000	0.000	0.000	0.000	0.000	0.000	0.003	pg151.cx7
Insert response time histogram
256us	1ms	4ms	16ms	64ms	256ms	1s	4s	16s	gt	max	tag
0.000	0.000	99.542	0.458	0.000	0.000	0.000	0.000	0.000	0.000	0.007	my8031.cy8
0.000	5.872	94.125	0.003	0.000	0.000	0.000	0.000	0.000	0.000	0.004	fbmy8028.cy9c
0.000	0.000	99.931	0.067	0.003	0.000	0.000	0.000	0.000	0.000	0.016	pg151.cx7
q1000.1
- q1000.1: range queries with 1000 insert/s per client
- Legend for results is here.
- Each entry lists the percentage of responses that fit in that bucket (slower than max time for previous bucket, faster than min time for next bucket).
Query response time histogram
256us	1ms	4ms	16ms	64ms	256ms	1s	4s	16s	gt	max	tag
99.998	0.002	nonzero	nonzero	0.000	0.000	0.000	0.000	0.000	0.000	0.005	my8031.cy8
99.993	0.007	nonzero	0.000	0.000	0.000	0.000	0.000	0.000	0.000	0.004	fbmy8028.cy9c
100.000	nonzero	nonzero	nonzero	0.000	0.000	0.000	0.000	0.000	0.000	0.005	pg151.cx7
Insert response time histogram
256us	1ms	4ms	16ms	64ms	256ms	1s	4s	16s	gt	max	tag
0.000	0.000	99.847	0.153	0.000	0.000	0.000	0.000	0.000	0.000	0.008	my8031.cy8
0.000	12.639	87.356	0.006	0.000	0.000	0.000	0.000	0.000	0.000	0.006	fbmy8028.cy9c
0.000	0.000	99.954	0.043	0.003	0.000	0.000	0.000	0.000	0.000	0.040	pg151.cx7